
|
|||||
|
 | |
| |
| |
| |
| |
| |
|
Gene: EFHD1 |
Gene summary for EFHD1 |
| Gene information | Species | Human | Gene symbol | EFHD1 | Gene ID | 80303 |
| Gene name | EF-hand domain family member D1 | |
| Gene Alias | MST133 | |
| Cytomap | 2q37.1 | |
| Gene Type | protein-coding | GO ID | GO:0006950 | UniProtAcc | Q9BUP0 |
Top |
Malignant transformation analysis |
| Identification of the aberrant gene expression in precancerous and cancerous lesions by comparing the gene expression of stem-like cells in diseased tissues with normal stem cells |
| Entrez ID | Symbol | Replicates | Species | Organ | Tissue | Adj P-value | Log2FC | Malignancy |
| 80303 | EFHD1 | GSM4909282 | Human | Breast | IDC | 5.26e-16 | -4.07e-01 | -0.0288 |
| 80303 | EFHD1 | GSM4909285 | Human | Breast | IDC | 3.13e-04 | -7.65e-02 | 0.21 |
| 80303 | EFHD1 | GSM4909286 | Human | Breast | IDC | 3.01e-04 | 1.84e-01 | 0.1081 |
| 80303 | EFHD1 | GSM4909291 | Human | Breast | IDC | 2.73e-03 | -3.53e-01 | 0.1753 |
| 80303 | EFHD1 | GSM4909293 | Human | Breast | IDC | 6.40e-24 | 5.68e-01 | 0.1581 |
| 80303 | EFHD1 | GSM4909296 | Human | Breast | IDC | 1.82e-02 | -1.42e-01 | 0.1524 |
| 80303 | EFHD1 | GSM4909297 | Human | Breast | IDC | 1.45e-03 | -3.62e-02 | 0.1517 |
| 80303 | EFHD1 | GSM4909298 | Human | Breast | IDC | 2.65e-02 | 8.98e-02 | 0.1551 |
| 80303 | EFHD1 | GSM4909301 | Human | Breast | IDC | 3.08e-02 | -2.24e-01 | 0.1577 |
| 80303 | EFHD1 | GSM4909303 | Human | Breast | IDC | 8.03e-08 | 7.18e-01 | 0.0438 |
| 80303 | EFHD1 | GSM4909306 | Human | Breast | IDC | 4.07e-03 | 3.71e-01 | 0.1564 |
| 80303 | EFHD1 | GSM4909308 | Human | Breast | IDC | 1.97e-04 | 1.60e-01 | 0.158 |
| 80303 | EFHD1 | GSM4909311 | Human | Breast | IDC | 6.66e-15 | -4.92e-02 | 0.1534 |
| 80303 | EFHD1 | GSM4909317 | Human | Breast | IDC | 3.35e-18 | 6.79e-01 | 0.1355 |
| 80303 | EFHD1 | GSM4909318 | Human | Breast | IDC | 4.21e-08 | 7.78e-01 | 0.2031 |
| 80303 | EFHD1 | GSM4909319 | Human | Breast | IDC | 7.68e-23 | -2.61e-02 | 0.1563 |
| 80303 | EFHD1 | GSM4909321 | Human | Breast | IDC | 7.32e-03 | 6.80e-02 | 0.1559 |
| 80303 | EFHD1 | brca1 | Human | Breast | Precancer | 6.09e-11 | -3.69e-01 | -0.0338 |
| 80303 | EFHD1 | NCCBC11 | Human | Breast | DCIS | 5.39e-07 | 7.22e-01 | 0.1232 |
| 80303 | EFHD1 | NCCBC3 | Human | Breast | DCIS | 6.32e-04 | -3.00e-01 | 0.1198 |
| Page: 1 2 3 |
| Tissue | Expression Dynamics | Abbreviation |
| Breast |  | IDC: Invasive ductal carcinoma |
| DCIS: Ductal carcinoma in situ | ||
| Precancer(BRCA1-mut): Precancerous lesion from BRCA1 mutation carriers | ||
| Esophagus | 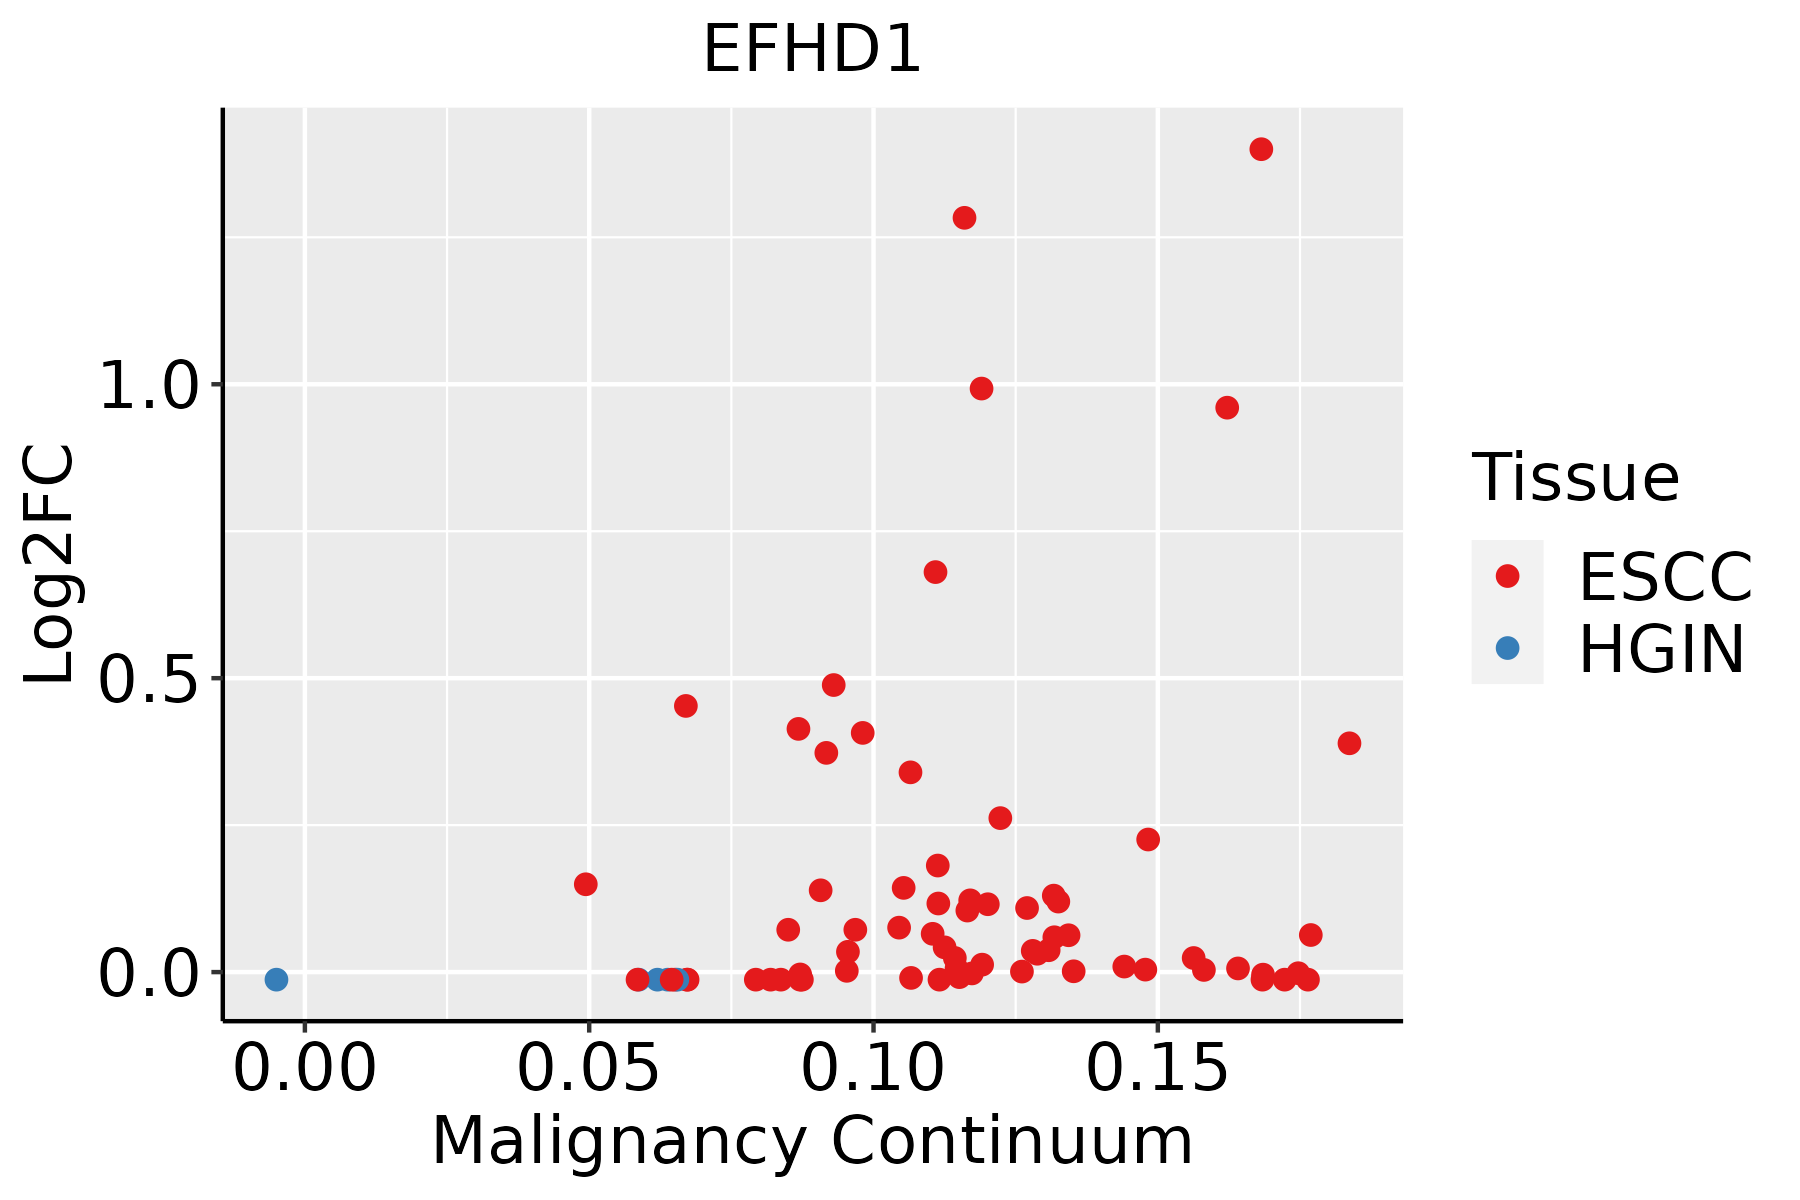 | ESCC: Esophageal squamous cell carcinoma |
| HGIN: High-grade intraepithelial neoplasias | ||
| LGIN: Low-grade intraepithelial neoplasias | ||
| Liver | 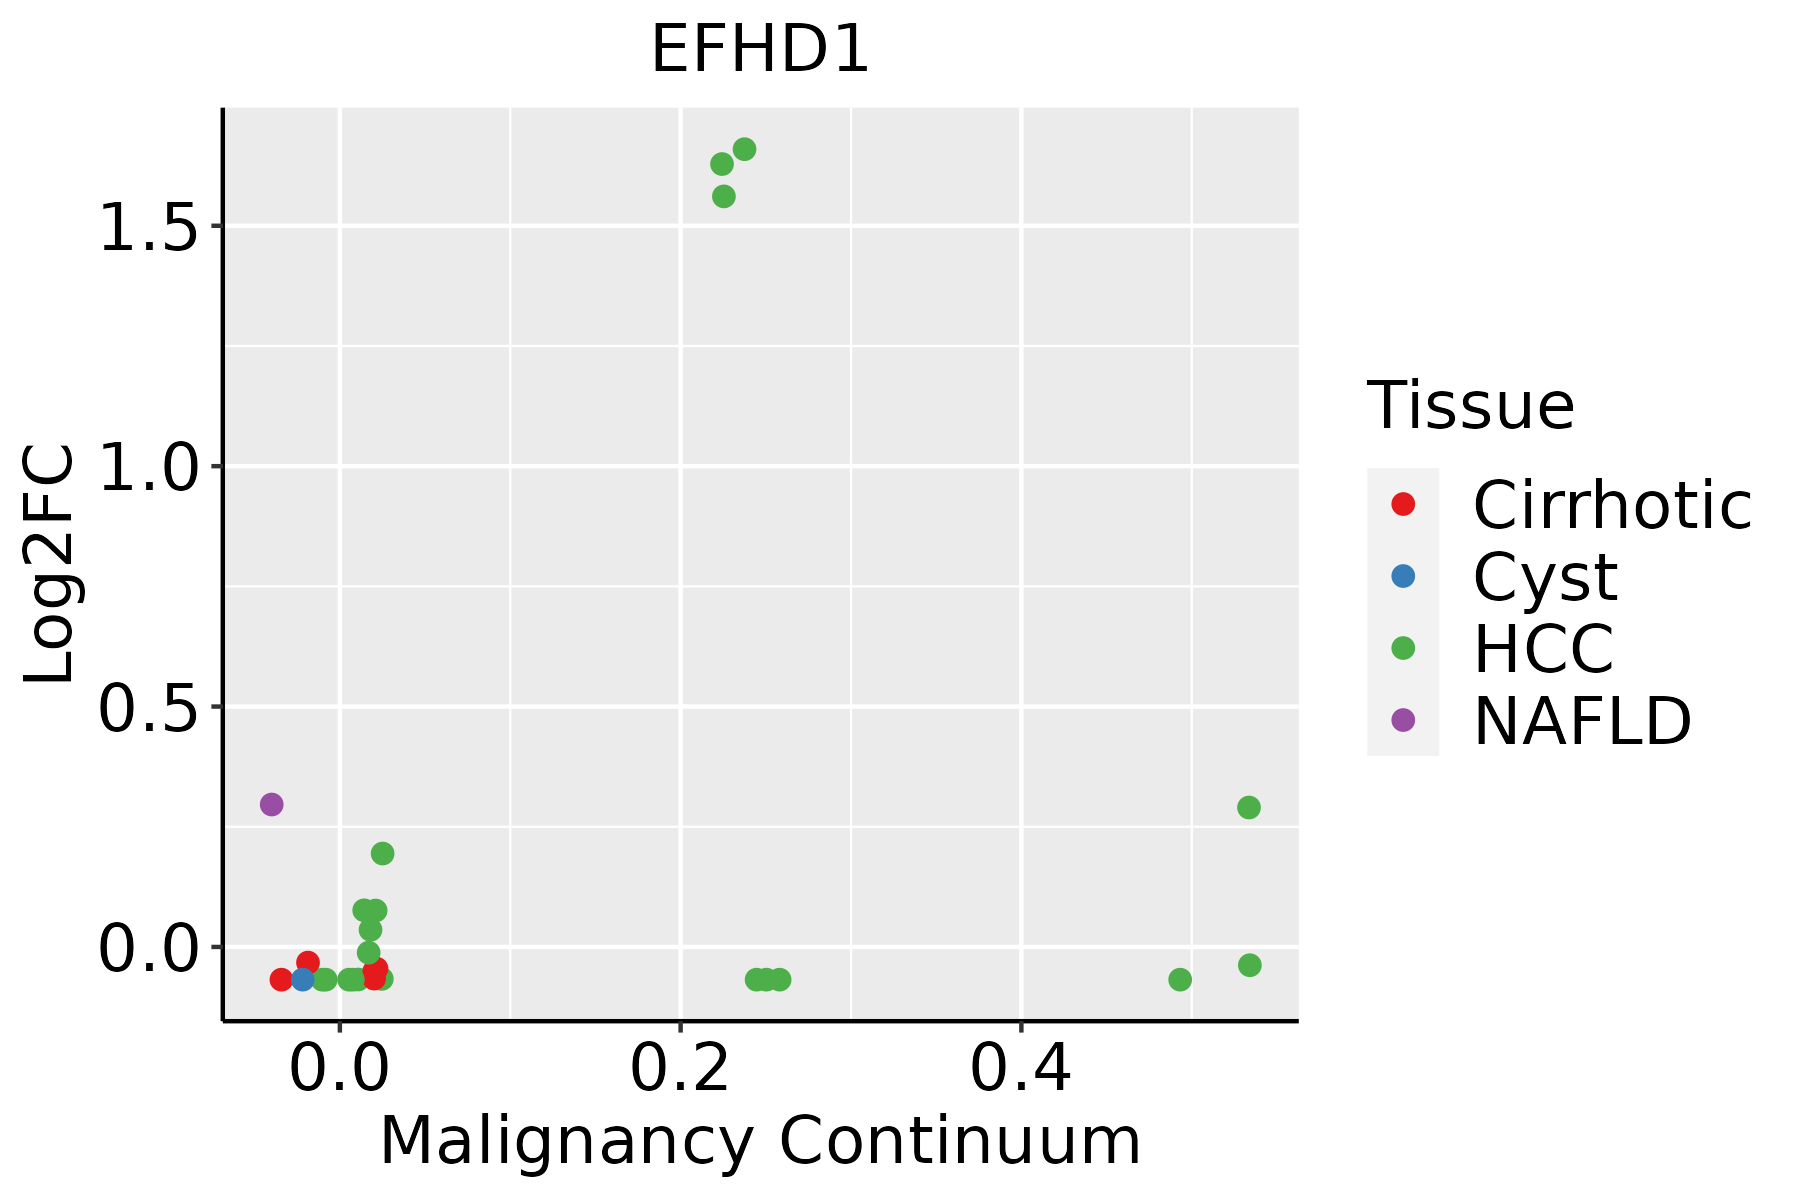 | HCC: Hepatocellular carcinoma |
| NAFLD: Non-alcoholic fatty liver disease |
| ∗log2FC in expression of this searched gene in stem-like cells from each diseased tissue sample relative to stem-like cells in normal samples in each tissue plotted against the malignancy continuum. Samples are colored based on if they are from different disease stage. |
Top |
Malignant transformation related pathway analysis |
| Find out the enriched GO biological processes and KEGG pathways involved in transition from healthy to precancer to cancer |
| Tissue | Disease Stage | Enriched GO biological Processes |
| Colorectum | AD |  |
| Colorectum | SER |  |
| Colorectum | MSS |  |
| Colorectum | MSI-H |  |
| Colorectum | FAP |  |
| ∗Top 15 enriched GO BP terms are showed in the bar plot of each disease state in each tissue. Each row represents a significant GO biological process which is colored according to the -log10(p.adjust). |
| Page: 1 2 3 4 5 6 7 8 9 |
| GO ID | Tissue | Disease Stage | Description | Gene Ratio | Bg Ratio | pvalue | p.adjust | Count |
| GO:00621979 | Breast | Precancer | cellular response to chemical stress | 51/1080 | 337/18723 | 2.40e-10 | 2.34e-08 | 51 |
| GO:00712147 | Breast | Precancer | cellular response to abiotic stimulus | 37/1080 | 331/18723 | 9.12e-05 | 1.73e-03 | 37 |
| GO:01040047 | Breast | Precancer | cellular response to environmental stimulus | 37/1080 | 331/18723 | 9.12e-05 | 1.73e-03 | 37 |
| GO:00714703 | Breast | Precancer | cellular response to osmotic stress | 8/1080 | 41/18723 | 2.08e-03 | 1.97e-02 | 8 |
| GO:006219714 | Breast | IDC | cellular response to chemical stress | 55/1434 | 337/18723 | 7.07e-08 | 4.36e-06 | 55 |
| GO:007121413 | Breast | IDC | cellular response to abiotic stimulus | 48/1434 | 331/18723 | 1.37e-05 | 3.53e-04 | 48 |
| GO:010400413 | Breast | IDC | cellular response to environmental stimulus | 48/1434 | 331/18723 | 1.37e-05 | 3.53e-04 | 48 |
| GO:007147011 | Breast | IDC | cellular response to osmotic stress | 10/1434 | 41/18723 | 8.38e-04 | 9.79e-03 | 10 |
| GO:00714742 | Breast | IDC | cellular hyperosmotic response | 5/1434 | 15/18723 | 4.10e-03 | 3.25e-02 | 5 |
| GO:006219724 | Breast | DCIS | cellular response to chemical stress | 56/1390 | 337/18723 | 9.64e-09 | 7.38e-07 | 56 |
| GO:007121423 | Breast | DCIS | cellular response to abiotic stimulus | 47/1390 | 331/18723 | 1.32e-05 | 3.31e-04 | 47 |
| GO:010400423 | Breast | DCIS | cellular response to environmental stimulus | 47/1390 | 331/18723 | 1.32e-05 | 3.31e-04 | 47 |
| GO:00714702 | Breast | DCIS | cellular response to osmotic stress | 10/1390 | 41/18723 | 6.57e-04 | 8.09e-03 | 10 |
| GO:007147411 | Breast | DCIS | cellular hyperosmotic response | 5/1390 | 15/18723 | 3.58e-03 | 2.92e-02 | 5 |
| GO:0062197111 | Esophagus | ESCC | cellular response to chemical stress | 234/8552 | 337/18723 | 5.37e-19 | 5.97e-17 | 234 |
| GO:007121419 | Esophagus | ESCC | cellular response to abiotic stimulus | 206/8552 | 331/18723 | 7.52e-10 | 1.88e-08 | 206 |
| GO:010400419 | Esophagus | ESCC | cellular response to environmental stimulus | 206/8552 | 331/18723 | 7.52e-10 | 1.88e-08 | 206 |
| GO:00069707 | Esophagus | ESCC | response to osmotic stress | 57/8552 | 84/18723 | 3.26e-05 | 2.70e-04 | 57 |
| GO:00714707 | Esophagus | ESCC | cellular response to osmotic stress | 31/8552 | 41/18723 | 9.32e-05 | 6.68e-04 | 31 |
| GO:00714724 | Esophagus | ESCC | cellular response to salt stress | 10/8552 | 12/18723 | 8.94e-03 | 3.12e-02 | 10 |
| Page: 1 2 |
| Pathway ID | Tissue | Disease Stage | Description | Gene Ratio | Bg Ratio | pvalue | p.adjust | qvalue | Count |
| Page: 1 |
Top |
Cell-cell communication analysis |
| Identification of potential cell-cell interactions between two cell types and their ligand-receptor pairs for different disease states |
| Ligand | Receptor | LRpair | Pathway | Tissue | Disease Stage |
| Page: 1 |
Top |
Single-cell gene regulatory network inference analysis |
| Find out the significant the regulons (TFs) and the target genes of each regulon across cell types for different disease states |
| TF | Cell Type | Tissue | Disease Stage | Target Gene | RSS | Regulon Activity |
| ∗The dot plots of a searched regulon are shown for all cell subpopulations in each disease state of each tissue based on the regulon specific score inferred using pySCENIC and by calculating the average expression. |
| Page: 1 |
Top |
Somatic mutation of malignant transformation related genes |
| Annotation of somatic variants for genes involved in malignant transformation |
| Hugo Symbol | Variant Class | Variant Classification | dbSNP RS | HGVSc | HGVSp | HGVSp Short | SWISSPROT | BIOTYPE | SIFT | PolyPhen | Tumor Sample Barcode | Tissue | Histology | Sex | Age | Stage | Therapy Types | Drugs | Outcome |
| EFHD1 | SNV | Missense_Mutation | novel | c.288G>T | p.Glu96Asp | p.E96D | Q9BUP0 | protein_coding | deleterious(0.01) | probably_damaging(0.99) | TCGA-2W-A8YY-01 | Cervix | cervical & endocervical cancer | Female | <65 | I/II | Chemotherapy | cisplatin | CR |
| EFHD1 | SNV | Missense_Mutation | c.319N>A | p.Asp107Asn | p.D107N | Q9BUP0 | protein_coding | deleterious(0.02) | possibly_damaging(0.893) | TCGA-FU-A40J-01 | Cervix | cervical & endocervical cancer | Female | <65 | III/IV | Chemotherapy | carboplatin | CR | |
| EFHD1 | SNV | Missense_Mutation | rs761223584 | c.677N>A | p.Arg226His | p.R226H | Q9BUP0 | protein_coding | deleterious(0.01) | possibly_damaging(0.691) | TCGA-4T-AA8H-01 | Colorectum | colon adenocarcinoma | Female | <65 | I/II | Unknown | Unknown | SD |
| EFHD1 | SNV | Missense_Mutation | rs761223584 | c.677G>A | p.Arg226His | p.R226H | Q9BUP0 | protein_coding | deleterious(0.01) | possibly_damaging(0.691) | TCGA-AD-A5EJ-01 | Colorectum | colon adenocarcinoma | Female | >=65 | I/II | Unknown | Unknown | SD |
| EFHD1 | SNV | Missense_Mutation | c.331N>A | p.Asp111Asn | p.D111N | Q9BUP0 | protein_coding | deleterious(0.03) | possibly_damaging(0.844) | TCGA-AZ-6601-01 | Colorectum | colon adenocarcinoma | Male | >=65 | I/II | Unknown | Unknown | PD | |
| EFHD1 | SNV | Missense_Mutation | rs771795073 | c.542N>T | p.Ala181Val | p.A181V | Q9BUP0 | protein_coding | tolerated(0.06) | benign(0.015) | TCGA-G4-6302-01 | Colorectum | colon adenocarcinoma | Female | >=65 | I/II | Unknown | Unknown | SD |
| EFHD1 | SNV | Missense_Mutation | rs773966692 | c.446N>A | p.Arg149Gln | p.R149Q | Q9BUP0 | protein_coding | deleterious(0.02) | probably_damaging(0.937) | TCGA-WS-AB45-01 | Colorectum | colon adenocarcinoma | Female | <65 | I/II | Unknown | Unknown | SD |
| EFHD1 | SNV | Missense_Mutation | rs757443440 | c.535N>A | p.Asp179Asn | p.D179N | Q9BUP0 | protein_coding | tolerated(0.25) | benign(0.107) | TCGA-AG-A02N-01 | Colorectum | rectum adenocarcinoma | Male | >=65 | I/II | Chemotherapy | folinic | CR |
| EFHD1 | SNV | Missense_Mutation | rs745364469 | c.427G>A | p.Asp143Asn | p.D143N | Q9BUP0 | protein_coding | deleterious(0) | probably_damaging(1) | TCGA-EI-6917-01 | Colorectum | rectum adenocarcinoma | Male | <65 | III/IV | Chemotherapy | 5fluorouracil+oxaciplatina+l-folinian | SD |
| EFHD1 | SNV | Missense_Mutation | rs757013631 | c.647N>A | p.Arg216Gln | p.R216Q | Q9BUP0 | protein_coding | tolerated(0.08) | benign(0.266) | TCGA-AP-A056-01 | Endometrium | uterine corpus endometrioid carcinoma | Female | <65 | I/II | Unknown | Unknown | SD |
| Page: 1 2 3 |
Top |
Related drugs of malignant transformation related genes |
| Identification of chemicals and drugs interact with genes involved in malignant transfromation |
| (DGIdb 4.0) |
| Entrez ID | Symbol | Category | Interaction Types | Drug Claim Name | Drug Name | PMIDs |
| Page: 1 |

Copyright 2023-Present -The University of Texas Health Science Center at Houston |