
|
|||||
|
 | |
| |
| |
| |
| |
| |
|
Gene: EFHC1 |
Gene summary for EFHC1 |
| Gene information | Species | Human | Gene symbol | EFHC1 | Gene ID | 114327 |
| Gene name | EF-hand domain containing 1 | |
| Gene Alias | EJM1 | |
| Cytomap | 6p12.2 | |
| Gene Type | protein-coding | GO ID | GO:0000226 | UniProtAcc | B2CKC5 |
Top |
Malignant transformation analysis |
| Identification of the aberrant gene expression in precancerous and cancerous lesions by comparing the gene expression of stem-like cells in diseased tissues with normal stem cells |
| Entrez ID | Symbol | Replicates | Species | Organ | Tissue | Adj P-value | Log2FC | Malignancy |
| 114327 | EFHC1 | LZE4T | Human | Esophagus | ESCC | 1.15e-05 | 1.96e-01 | 0.0811 |
| 114327 | EFHC1 | LZE5T | Human | Esophagus | ESCC | 2.15e-05 | 2.88e-01 | 0.0514 |
| 114327 | EFHC1 | LZE7T | Human | Esophagus | ESCC | 1.81e-04 | 1.75e-01 | 0.0667 |
| 114327 | EFHC1 | LZE22D1 | Human | Esophagus | HGIN | 2.95e-03 | 1.63e-01 | 0.0595 |
| 114327 | EFHC1 | LZE24T | Human | Esophagus | ESCC | 2.04e-14 | 6.53e-01 | 0.0596 |
| 114327 | EFHC1 | LZE21T | Human | Esophagus | ESCC | 9.92e-03 | 1.79e-01 | 0.0655 |
| 114327 | EFHC1 | P1T-E | Human | Esophagus | ESCC | 1.13e-07 | 2.39e-01 | 0.0875 |
| 114327 | EFHC1 | P2T-E | Human | Esophagus | ESCC | 6.72e-17 | 2.11e-01 | 0.1177 |
| 114327 | EFHC1 | P4T-E | Human | Esophagus | ESCC | 1.87e-12 | 2.89e-01 | 0.1323 |
| 114327 | EFHC1 | P5T-E | Human | Esophagus | ESCC | 1.76e-08 | 1.63e-01 | 0.1327 |
| 114327 | EFHC1 | P8T-E | Human | Esophagus | ESCC | 1.50e-11 | 2.60e-01 | 0.0889 |
| 114327 | EFHC1 | P9T-E | Human | Esophagus | ESCC | 2.85e-13 | 2.16e-01 | 0.1131 |
| 114327 | EFHC1 | P10T-E | Human | Esophagus | ESCC | 1.77e-20 | 4.36e-01 | 0.116 |
| 114327 | EFHC1 | P11T-E | Human | Esophagus | ESCC | 4.95e-09 | 3.54e-01 | 0.1426 |
| 114327 | EFHC1 | P12T-E | Human | Esophagus | ESCC | 6.98e-19 | 2.57e-01 | 0.1122 |
| 114327 | EFHC1 | P15T-E | Human | Esophagus | ESCC | 3.12e-08 | 2.41e-01 | 0.1149 |
| 114327 | EFHC1 | P16T-E | Human | Esophagus | ESCC | 4.03e-36 | 7.14e-01 | 0.1153 |
| 114327 | EFHC1 | P19T-E | Human | Esophagus | ESCC | 3.08e-02 | 3.31e-01 | 0.1662 |
| 114327 | EFHC1 | P20T-E | Human | Esophagus | ESCC | 3.13e-27 | 5.70e-01 | 0.1124 |
| 114327 | EFHC1 | P21T-E | Human | Esophagus | ESCC | 5.93e-17 | 3.26e-01 | 0.1617 |
| Page: 1 2 3 4 5 6 |
| Tissue | Expression Dynamics | Abbreviation |
| Esophagus | 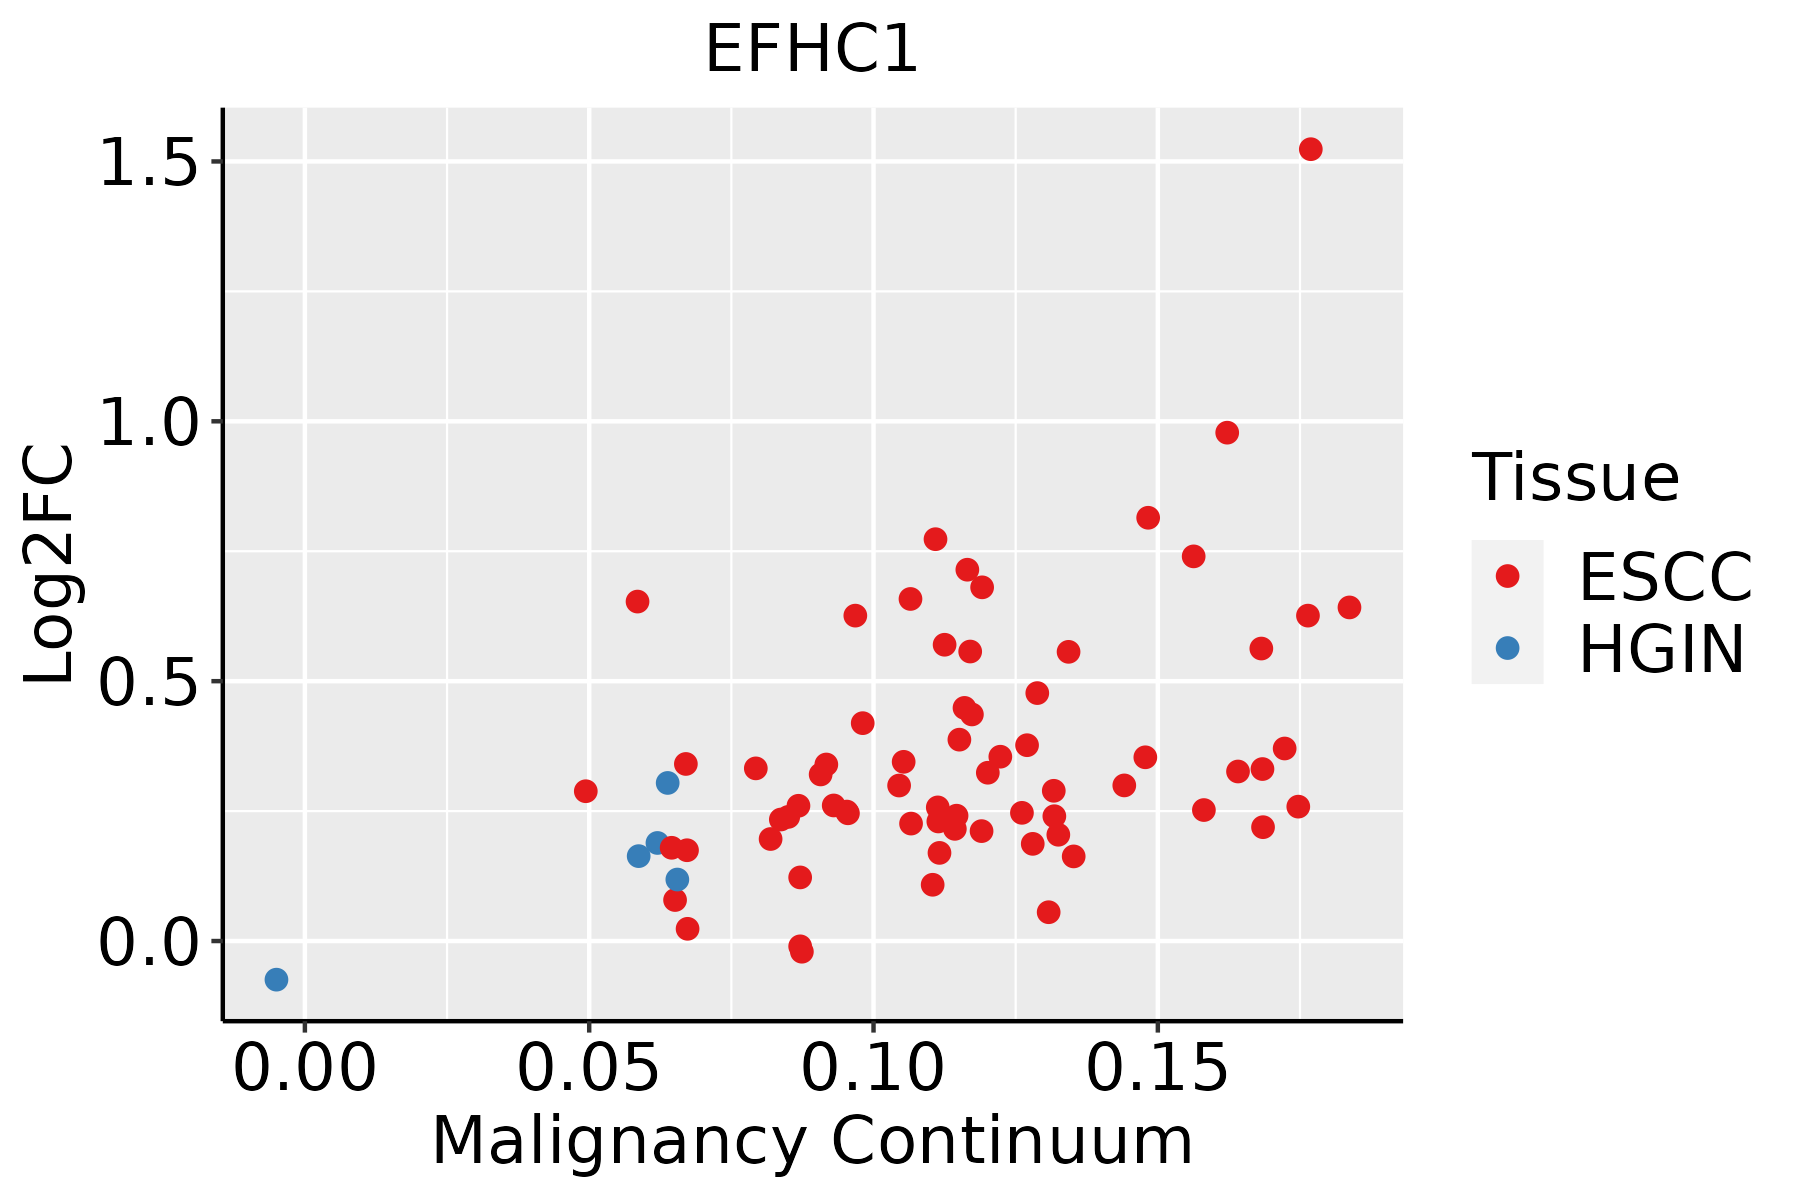 | ESCC: Esophageal squamous cell carcinoma |
| HGIN: High-grade intraepithelial neoplasias | ||
| LGIN: Low-grade intraepithelial neoplasias | ||
| Liver | 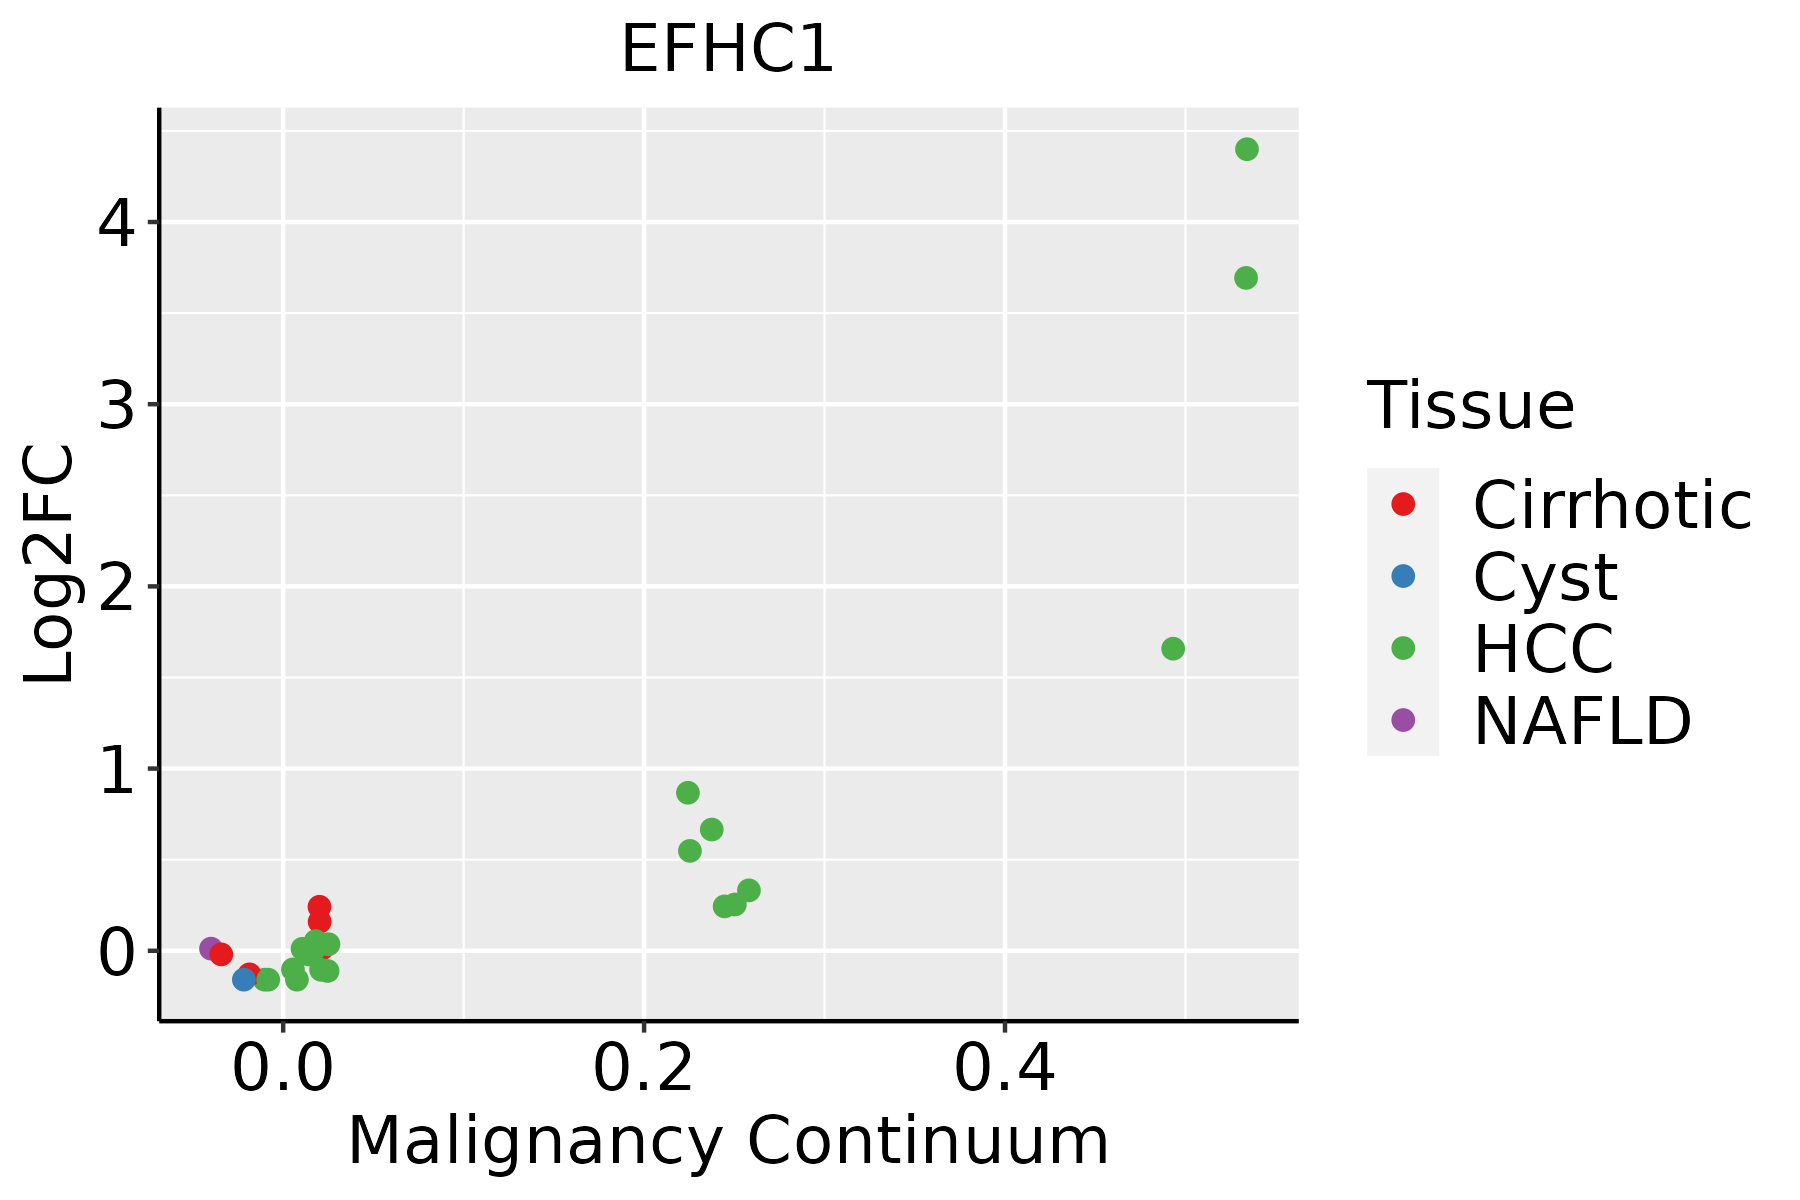 | HCC: Hepatocellular carcinoma |
| NAFLD: Non-alcoholic fatty liver disease | ||
| Lung | 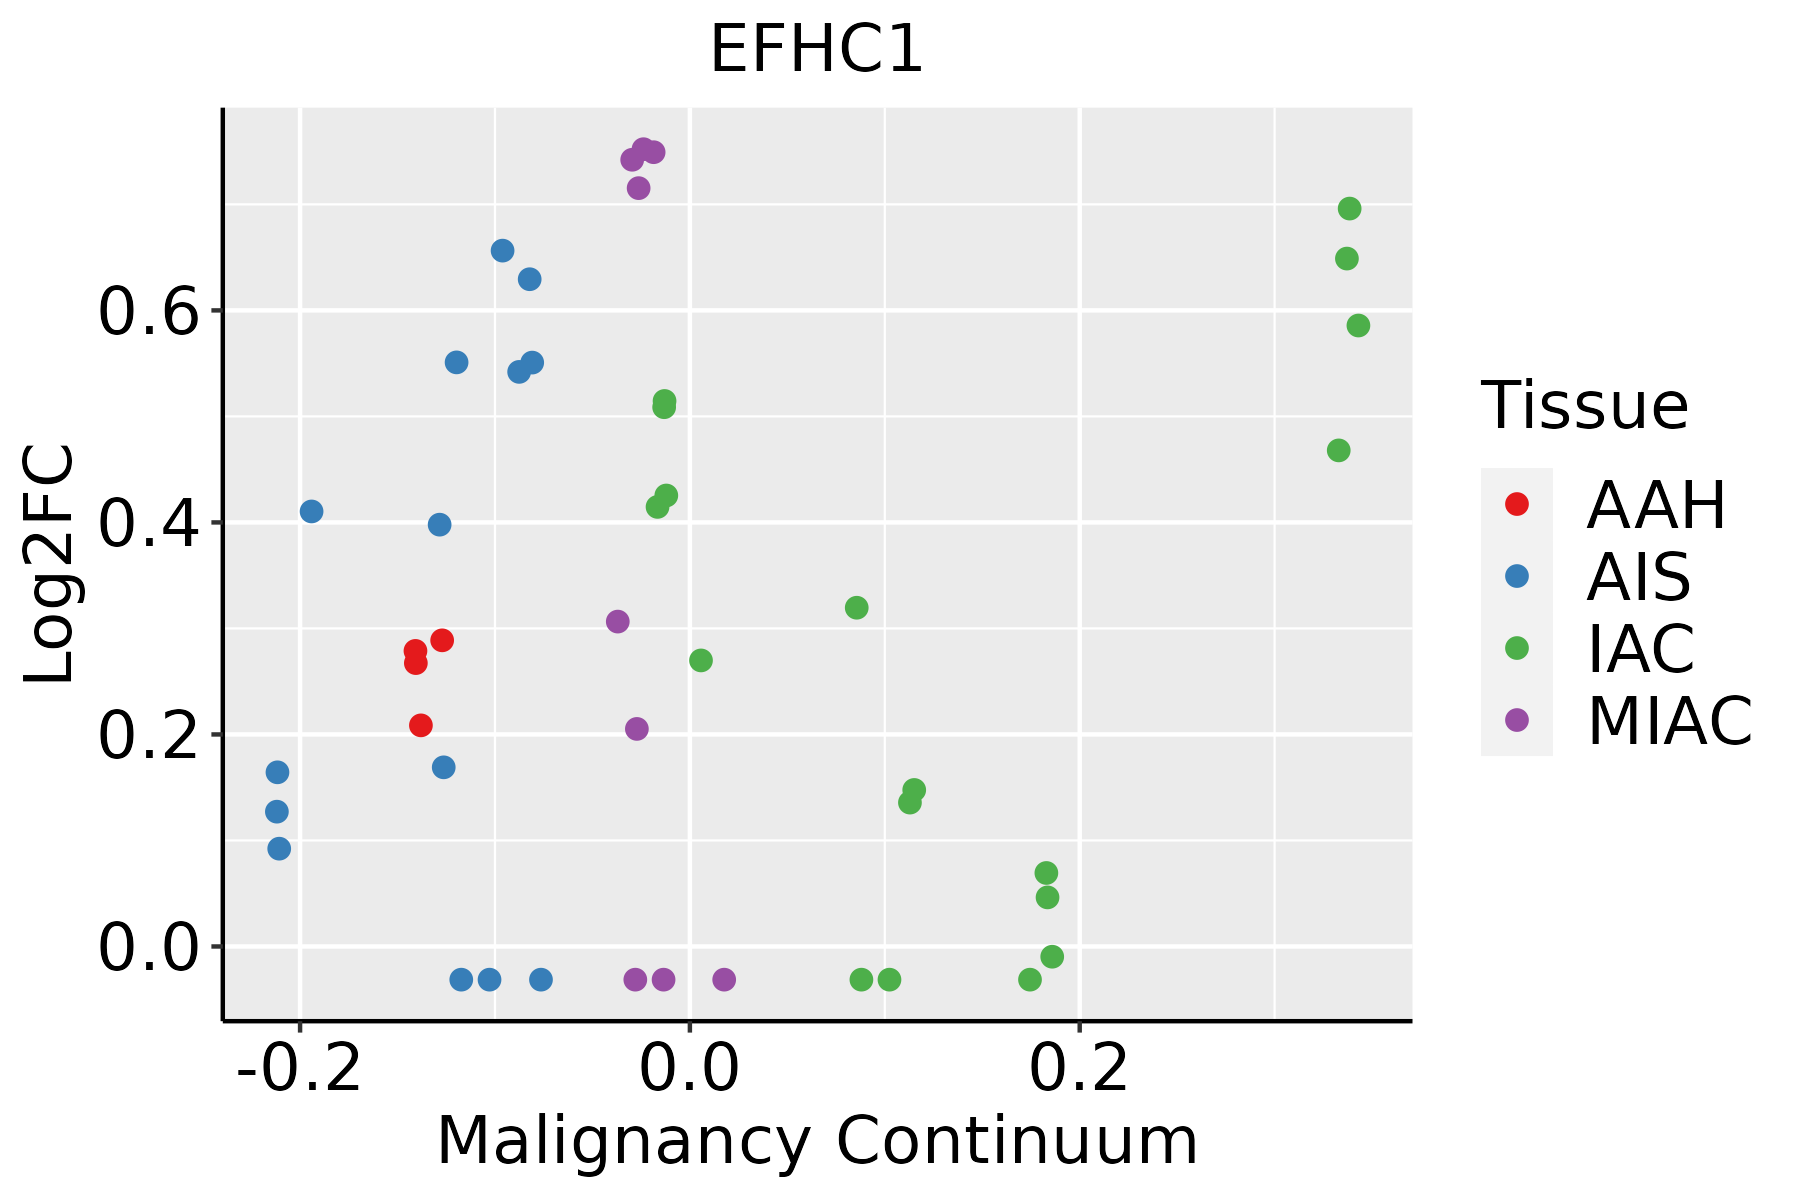 | AAH: Atypical adenomatous hyperplasia |
| AIS: Adenocarcinoma in situ | ||
| IAC: Invasive lung adenocarcinoma | ||
| MIA: Minimally invasive adenocarcinoma | ||
| Oral Cavity | 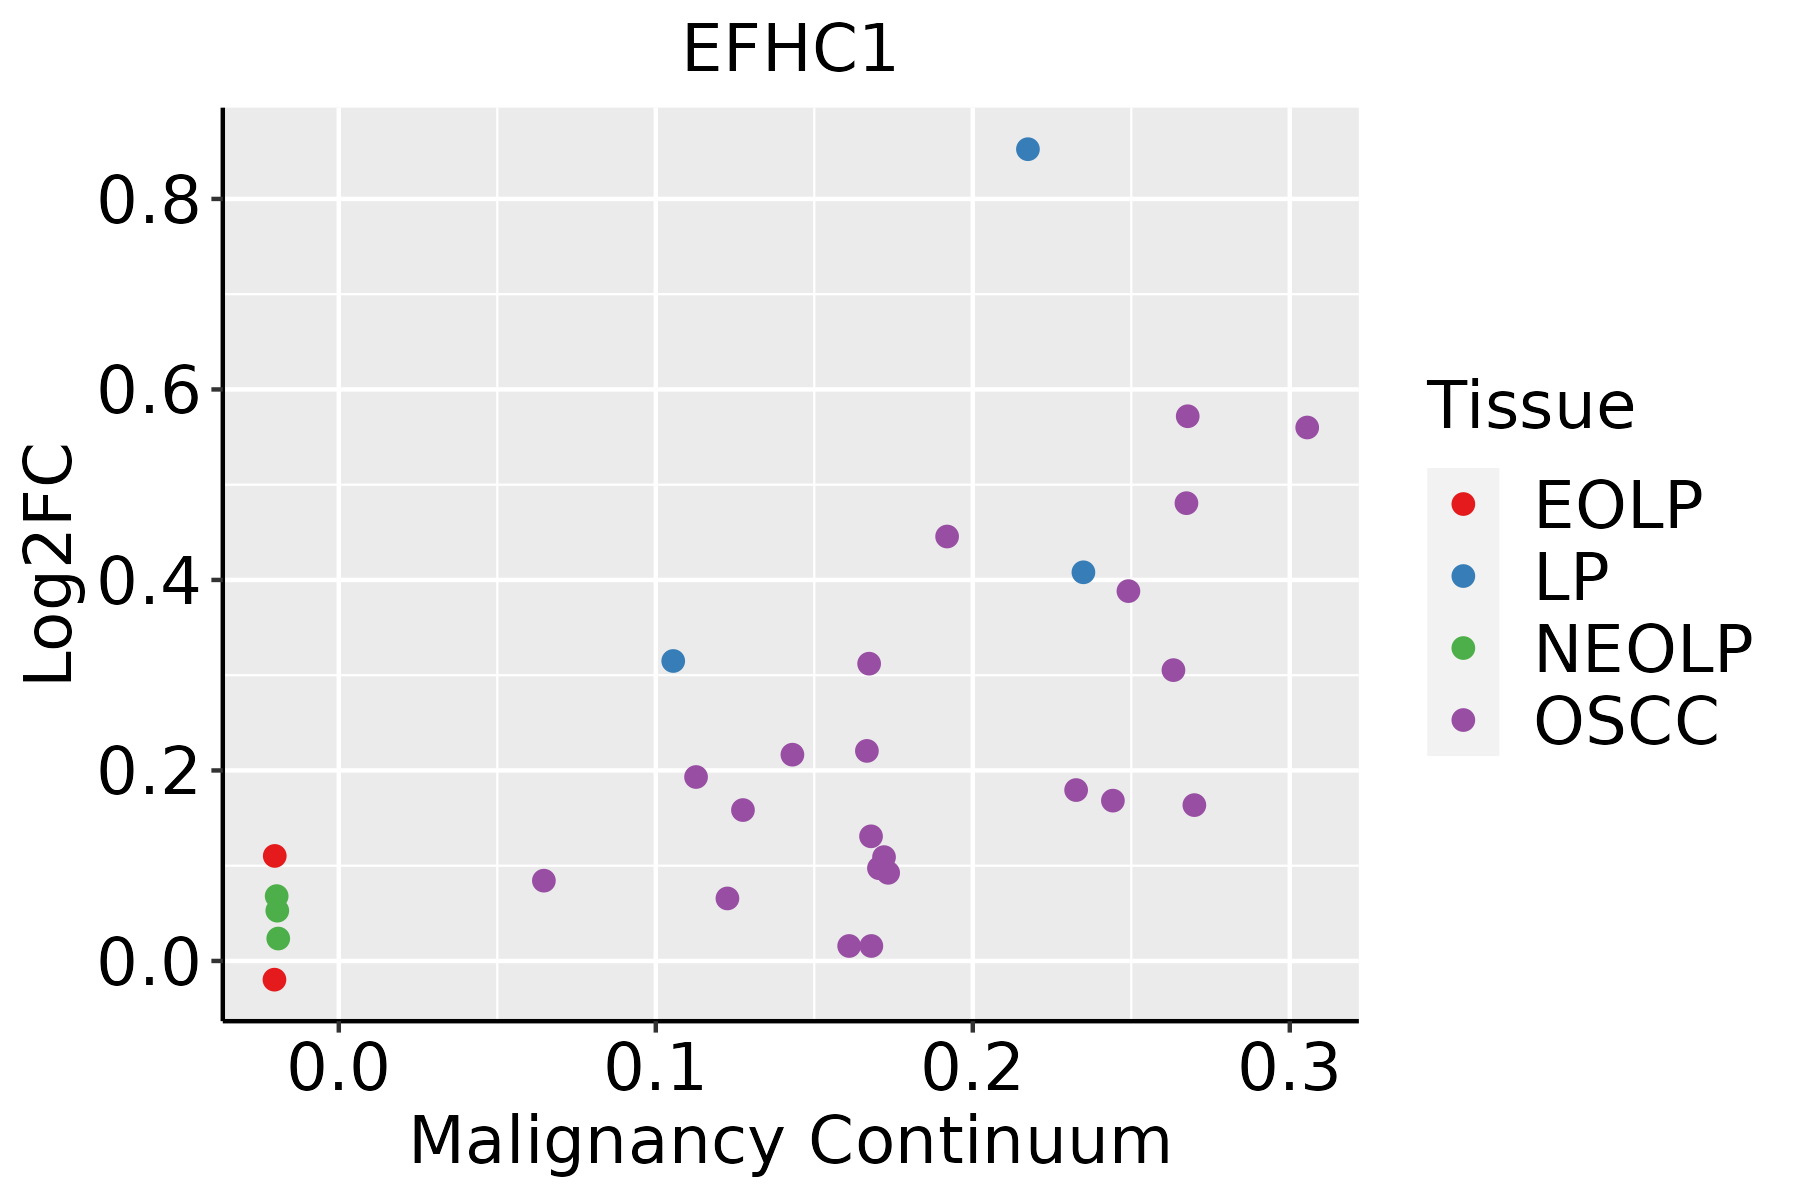 | EOLP: Erosive Oral lichen planus |
| LP: leukoplakia | ||
| NEOLP: Non-erosive oral lichen planus | ||
| OSCC: Oral squamous cell carcinoma | ||
| Thyroid |  | ATC: Anaplastic thyroid cancer |
| HT: Hashimoto's thyroiditis | ||
| PTC: Papillary thyroid cancer |
| ∗log2FC in expression of this searched gene in stem-like cells from each diseased tissue sample relative to stem-like cells in normal samples in each tissue plotted against the malignancy continuum. Samples are colored based on if they are from different disease stage. |
Top |
Malignant transformation related pathway analysis |
| Find out the enriched GO biological processes and KEGG pathways involved in transition from healthy to precancer to cancer |
| Tissue | Disease Stage | Enriched GO biological Processes |
| Colorectum | AD |  |
| Colorectum | SER |  |
| Colorectum | MSS |  |
| Colorectum | MSI-H |  |
| Colorectum | FAP |  |
| ∗Top 15 enriched GO BP terms are showed in the bar plot of each disease state in each tissue. Each row represents a significant GO biological process which is colored according to the -log10(p.adjust). |
| Page: 1 2 3 4 5 6 7 8 9 |
| GO ID | Tissue | Disease Stage | Description | Gene Ratio | Bg Ratio | pvalue | p.adjust | Count |
| GO:000091015 | Esophagus | HGIN | cytokinesis | 44/2587 | 173/18723 | 3.26e-05 | 8.32e-04 | 44 |
| GO:00070527 | Esophagus | HGIN | mitotic spindle organization | 31/2587 | 120/18723 | 3.35e-04 | 5.50e-03 | 31 |
| GO:19028507 | Esophagus | HGIN | microtubule cytoskeleton organization involved in mitosis | 36/2587 | 147/18723 | 3.61e-04 | 5.68e-03 | 36 |
| GO:00616406 | Esophagus | HGIN | cytoskeleton-dependent cytokinesis | 27/2587 | 100/18723 | 3.71e-04 | 5.77e-03 | 27 |
| GO:00070518 | Esophagus | HGIN | spindle organization | 42/2587 | 184/18723 | 6.07e-04 | 8.49e-03 | 42 |
| GO:00002816 | Esophagus | HGIN | mitotic cytokinesis | 19/2587 | 71/18723 | 2.90e-03 | 2.81e-02 | 19 |
| GO:190285015 | Esophagus | ESCC | microtubule cytoskeleton organization involved in mitosis | 116/8552 | 147/18723 | 1.25e-16 | 9.91e-15 | 116 |
| GO:000705214 | Esophagus | ESCC | mitotic spindle organization | 97/8552 | 120/18723 | 2.17e-15 | 1.33e-13 | 97 |
| GO:000705114 | Esophagus | ESCC | spindle organization | 134/8552 | 184/18723 | 5.70e-14 | 2.87e-12 | 134 |
| GO:000028115 | Esophagus | ESCC | mitotic cytokinesis | 58/8552 | 71/18723 | 4.34e-10 | 1.15e-08 | 58 |
| GO:000091016 | Esophagus | ESCC | cytokinesis | 115/8552 | 173/18723 | 2.48e-08 | 4.68e-07 | 115 |
| GO:006164015 | Esophagus | ESCC | cytoskeleton-dependent cytokinesis | 72/8552 | 100/18723 | 8.10e-08 | 1.39e-06 | 72 |
| GO:00215436 | Esophagus | ESCC | pallium development | 94/8552 | 169/18723 | 5.79e-03 | 2.14e-02 | 94 |
| GO:00513025 | Esophagus | ESCC | regulation of cell division | 97/8552 | 177/18723 | 8.93e-03 | 3.12e-02 | 97 |
| GO:00002812 | Liver | Cirrhotic | mitotic cytokinesis | 32/4634 | 71/18723 | 1.48e-04 | 1.42e-03 | 32 |
| GO:00070522 | Liver | Cirrhotic | mitotic spindle organization | 46/4634 | 120/18723 | 6.56e-04 | 4.98e-03 | 46 |
| GO:00009105 | Liver | Cirrhotic | cytokinesis | 62/4634 | 173/18723 | 7.13e-04 | 5.33e-03 | 62 |
| GO:00616402 | Liver | Cirrhotic | cytoskeleton-dependent cytokinesis | 38/4634 | 100/18723 | 2.22e-03 | 1.35e-02 | 38 |
| GO:19028502 | Liver | Cirrhotic | microtubule cytoskeleton organization involved in mitosis | 52/4634 | 147/18723 | 2.52e-03 | 1.51e-02 | 52 |
| GO:00070514 | Liver | Cirrhotic | spindle organization | 62/4634 | 184/18723 | 3.88e-03 | 2.10e-02 | 62 |
| Page: 1 2 3 4 |
| Pathway ID | Tissue | Disease Stage | Description | Gene Ratio | Bg Ratio | pvalue | p.adjust | qvalue | Count |
| Page: 1 |
Top |
Cell-cell communication analysis |
| Identification of potential cell-cell interactions between two cell types and their ligand-receptor pairs for different disease states |
| Ligand | Receptor | LRpair | Pathway | Tissue | Disease Stage |
| Page: 1 |
Top |
Single-cell gene regulatory network inference analysis |
| Find out the significant the regulons (TFs) and the target genes of each regulon across cell types for different disease states |
| TF | Cell Type | Tissue | Disease Stage | Target Gene | RSS | Regulon Activity |
| ∗The dot plots of a searched regulon are shown for all cell subpopulations in each disease state of each tissue based on the regulon specific score inferred using pySCENIC and by calculating the average expression. |
| Page: 1 |
Top |
Somatic mutation of malignant transformation related genes |
| Annotation of somatic variants for genes involved in malignant transformation |
| Hugo Symbol | Variant Class | Variant Classification | dbSNP RS | HGVSc | HGVSp | HGVSp Short | SWISSPROT | BIOTYPE | SIFT | PolyPhen | Tumor Sample Barcode | Tissue | Histology | Sex | Age | Stage | Therapy Types | Drugs | Outcome |
| EFHC1 | SNV | Missense_Mutation | rs754282571 | c.37C>T | p.Pro13Ser | p.P13S | Q5JVL4 | protein_coding | deleterious(0) | probably_damaging(1) | TCGA-3C-AALI-01 | Breast | breast invasive carcinoma | Female | <65 | I/II | Unspecific | Poly E | Complete Response |
| EFHC1 | SNV | Missense_Mutation | rs772750016 | c.325A>G | p.Met109Val | p.M109V | Q5JVL4 | protein_coding | tolerated(0.5) | benign(0) | TCGA-AN-A0XN-01 | Breast | breast invasive carcinoma | Female | >=65 | III/IV | Unknown | Unknown | SD |
| EFHC1 | SNV | Missense_Mutation | c.50T>G | p.Phe17Cys | p.F17C | Q5JVL4 | protein_coding | deleterious(0.01) | benign(0.265) | TCGA-BH-A0C7-01 | Breast | breast invasive carcinoma | Female | <65 | I/II | Chemotherapy | adriamycin | CR | |
| EFHC1 | SNV | Missense_Mutation | c.1071G>C | p.Glu357Asp | p.E357D | Q5JVL4 | protein_coding | tolerated(0.55) | benign(0.003) | TCGA-C8-A1HE-01 | Breast | breast invasive carcinoma | Female | <65 | I/II | Unknown | Unknown | SD | |
| EFHC1 | insertion | Frame_Shift_Ins | novel | c.969_970insGAGGTAGTAGGGTTGAGAATAGACATAGGGAGACAGATCCC | p.Tyr324GlufsTer60 | p.Y324Efs*60 | Q5JVL4 | protein_coding | TCGA-A8-A08H-01 | Breast | breast invasive carcinoma | Female | >=65 | I/II | Unknown | Unknown | SD | ||
| EFHC1 | SNV | Missense_Mutation | rs534406651 | c.105N>A | p.Asn35Lys | p.N35K | Q5JVL4 | protein_coding | deleterious(0) | benign(0.171) | TCGA-C5-A7UH-01 | Cervix | cervical & endocervical cancer | Female | <65 | III/IV | Chemotherapy | cisplatin | SD |
| EFHC1 | SNV | Missense_Mutation | c.224N>A | p.Gly75Asp | p.G75D | Q5JVL4 | protein_coding | deleterious(0.04) | possibly_damaging(0.642) | TCGA-A6-2686-01 | Colorectum | colon adenocarcinoma | Female | >=65 | I/II | Unknown | Unknown | SD | |
| EFHC1 | SNV | Missense_Mutation | rs200375854 | c.451N>T | p.Arg151Cys | p.R151C | Q5JVL4 | protein_coding | deleterious(0) | probably_damaging(1) | TCGA-AA-3956-01 | Colorectum | colon adenocarcinoma | Male | >=65 | I/II | Unknown | Unknown | SD |
| EFHC1 | SNV | Missense_Mutation | rs553105915 | c.838G>A | p.Glu280Lys | p.E280K | Q5JVL4 | protein_coding | tolerated(0.48) | benign(0.086) | TCGA-AA-3977-01 | Colorectum | colon adenocarcinoma | Male | >=65 | I/II | Unknown | Unknown | SD |
| EFHC1 | SNV | Missense_Mutation | rs151126903 | c.842N>A | p.Arg281Gln | p.R281Q | Q5JVL4 | protein_coding | tolerated(0.57) | benign(0.103) | TCGA-AA-A010-01 | Colorectum | colon adenocarcinoma | Female | <65 | I/II | Chemotherapy | folinic | CR |
| Page: 1 2 3 4 5 6 7 8 9 |
Top |
Related drugs of malignant transformation related genes |
| Identification of chemicals and drugs interact with genes involved in malignant transfromation |
| (DGIdb 4.0) |
| Entrez ID | Symbol | Category | Interaction Types | Drug Claim Name | Drug Name | PMIDs |
| Page: 1 |

Copyright 2023-Present -The University of Texas Health Science Center at Houston |