
|
|||||
|
 | |
| |
| |
| |
| |
| |
|
Gene: EFEMP2 |
Gene summary for EFEMP2 |
| Gene information | Species | Human | Gene symbol | EFEMP2 | Gene ID | 30008 |
| Gene name | EGF containing fibulin extracellular matrix protein 2 | |
| Gene Alias | ARCL1B | |
| Cytomap | 11q13.1 | |
| Gene Type | protein-coding | GO ID | GO:0001568 | UniProtAcc | A0A024R5G1 |
Top |
Malignant transformation analysis |
| Identification of the aberrant gene expression in precancerous and cancerous lesions by comparing the gene expression of stem-like cells in diseased tissues with normal stem cells |
| Entrez ID | Symbol | Replicates | Species | Organ | Tissue | Adj P-value | Log2FC | Malignancy |
| 30008 | EFEMP2 | AEH-subject1 | Human | Endometrium | AEH | 1.14e-26 | -5.44e-01 | -0.3059 |
| 30008 | EFEMP2 | AEH-subject2 | Human | Endometrium | AEH | 5.76e-34 | -5.48e-01 | -0.2525 |
| 30008 | EFEMP2 | AEH-subject3 | Human | Endometrium | AEH | 6.04e-26 | -5.39e-01 | -0.2576 |
| 30008 | EFEMP2 | AEH-subject4 | Human | Endometrium | AEH | 3.01e-21 | -4.87e-01 | -0.2657 |
| 30008 | EFEMP2 | AEH-subject5 | Human | Endometrium | AEH | 5.97e-33 | -5.82e-01 | -0.2953 |
| 30008 | EFEMP2 | EEC-subject1 | Human | Endometrium | EEC | 5.74e-31 | -5.51e-01 | -0.2682 |
| 30008 | EFEMP2 | EEC-subject2 | Human | Endometrium | EEC | 1.21e-35 | -5.92e-01 | -0.2607 |
| 30008 | EFEMP2 | EEC-subject3 | Human | Endometrium | EEC | 3.19e-45 | -5.78e-01 | -0.2525 |
| 30008 | EFEMP2 | EEC-subject4 | Human | Endometrium | EEC | 1.76e-28 | -5.36e-01 | -0.2571 |
| 30008 | EFEMP2 | EEC-subject5 | Human | Endometrium | EEC | 9.96e-38 | -5.73e-01 | -0.249 |
| 30008 | EFEMP2 | GSM5276934 | Human | Endometrium | EEC | 6.90e-06 | -2.03e-01 | -0.0913 |
| 30008 | EFEMP2 | GSM5276935 | Human | Endometrium | EEC | 9.40e-36 | -5.74e-01 | -0.123 |
| 30008 | EFEMP2 | GSM5276937 | Human | Endometrium | EEC | 1.38e-03 | -2.63e-01 | -0.0897 |
| 30008 | EFEMP2 | GSM6177620_NYU_UCEC1_lib1_lib1 | Human | Endometrium | EEC | 3.25e-30 | -5.16e-01 | -0.1869 |
| 30008 | EFEMP2 | GSM6177620_NYU_UCEC1_lib2_lib2 | Human | Endometrium | EEC | 6.43e-29 | -5.30e-01 | -0.1875 |
| 30008 | EFEMP2 | GSM6177620_NYU_UCEC1_lib3_lib3 | Human | Endometrium | EEC | 1.09e-33 | -5.93e-01 | -0.1883 |
| 30008 | EFEMP2 | GSM6177621_NYU_UCEC2_lib1_lib1 | Human | Endometrium | EEC | 4.74e-22 | -3.75e-01 | -0.1934 |
| 30008 | EFEMP2 | GSM6177622_NYU_UCEC3_lib1_lib1 | Human | Endometrium | EEC | 3.59e-42 | -4.73e-01 | -0.1917 |
| 30008 | EFEMP2 | GSM6177622_NYU_UCEC3_lib2_lib2 | Human | Endometrium | EEC | 1.25e-44 | -5.22e-01 | -0.1916 |
| 30008 | EFEMP2 | GSM6177623_NYU_UCEC3_Vis | Human | Endometrium | EEC | 5.74e-03 | -8.97e-02 | -0.1269 |
| Page: 1 2 3 4 |
| Tissue | Expression Dynamics | Abbreviation |
| Endometrium | 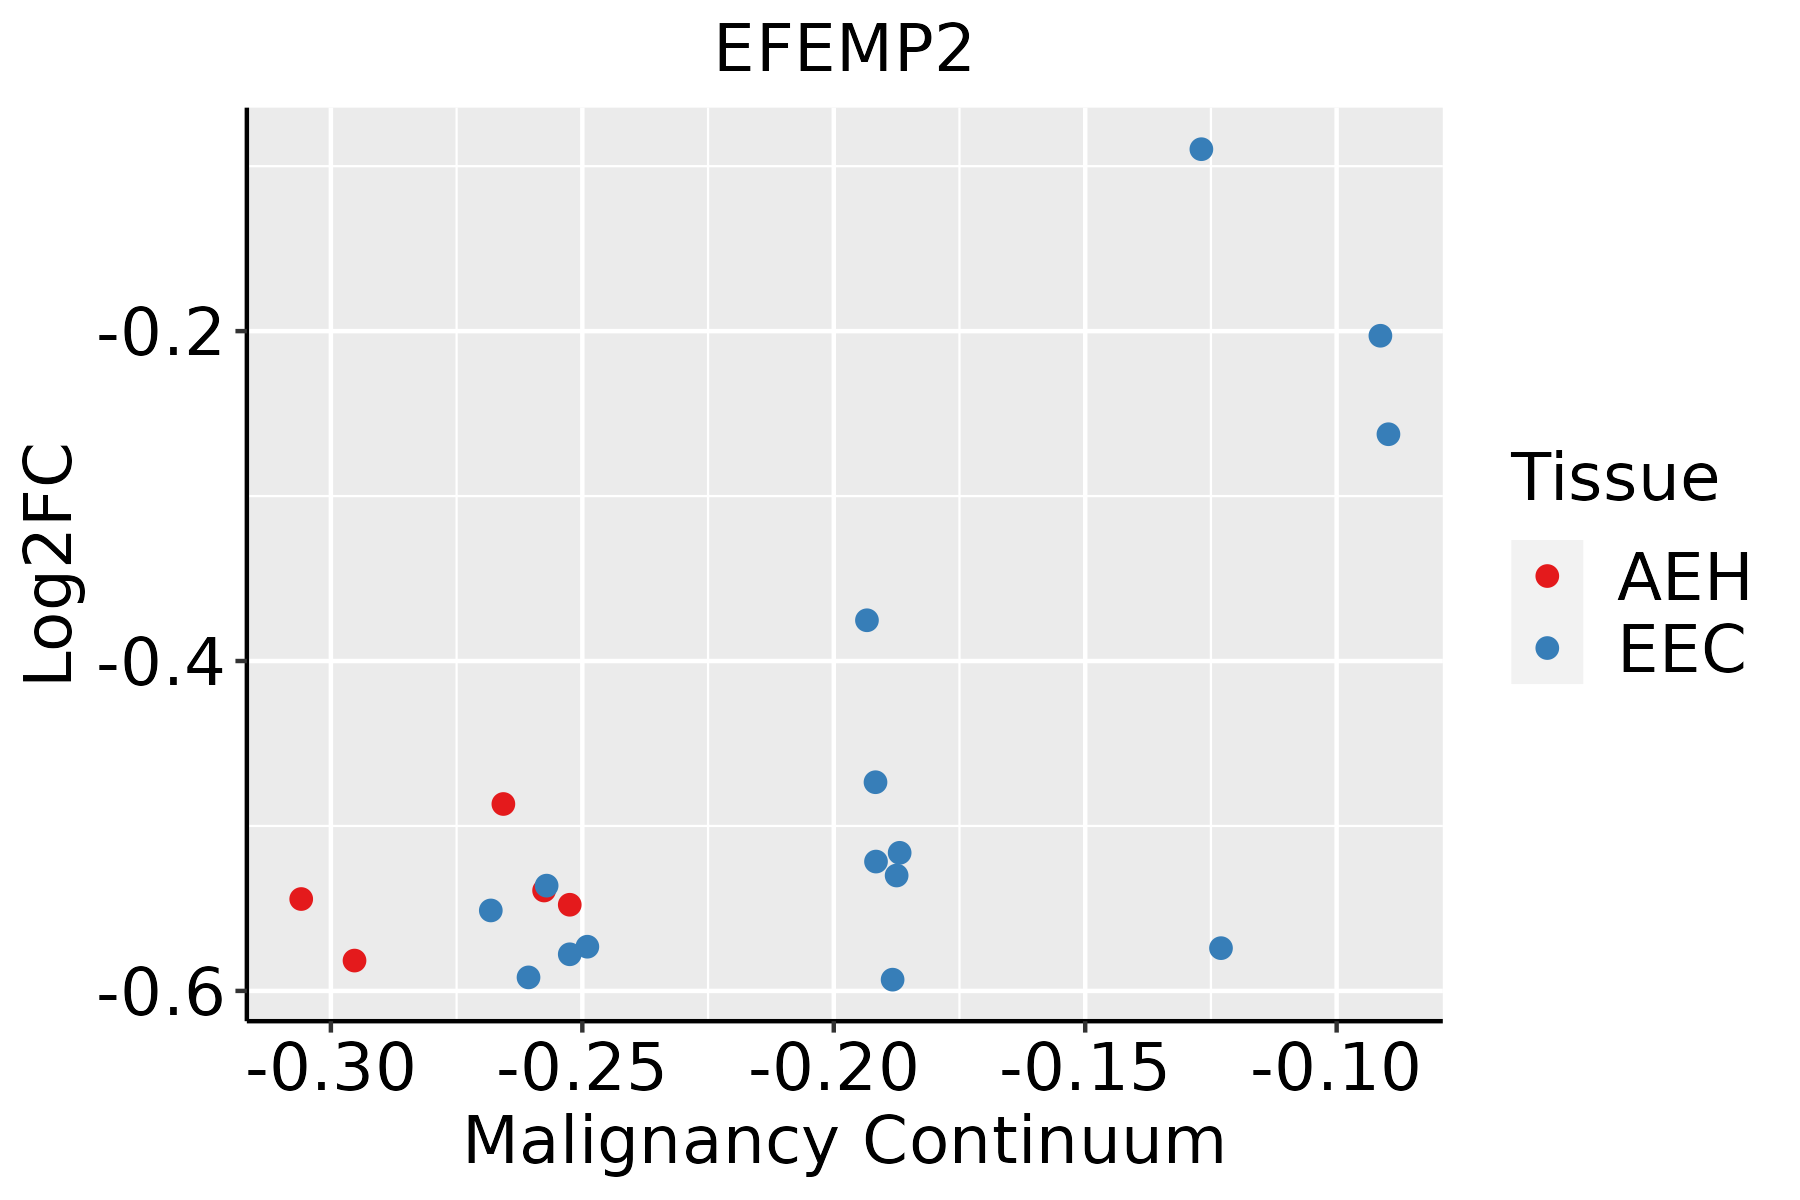 | AEH: Atypical endometrial hyperplasia |
| EEC: Endometrioid Cancer | ||
| Esophagus | 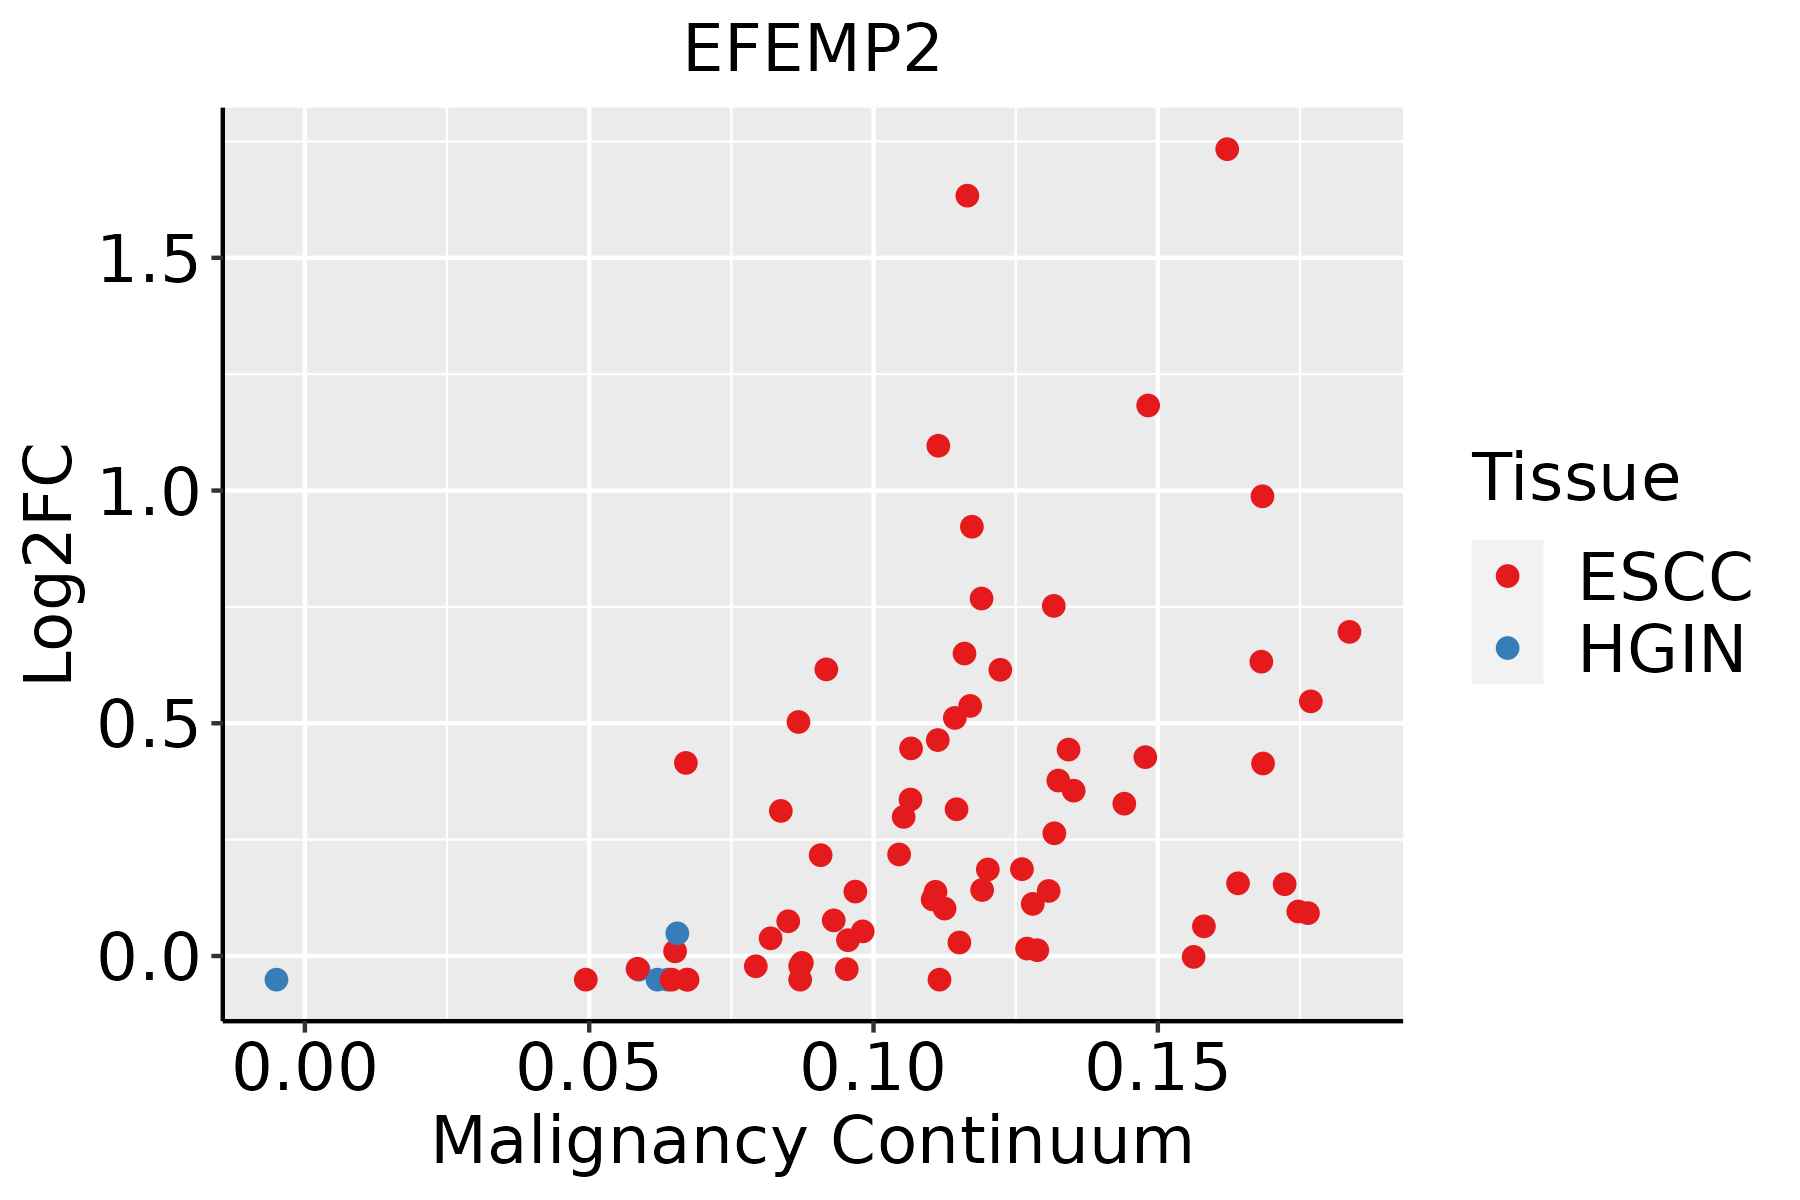 | ESCC: Esophageal squamous cell carcinoma |
| HGIN: High-grade intraepithelial neoplasias | ||
| LGIN: Low-grade intraepithelial neoplasias | ||
| Liver | 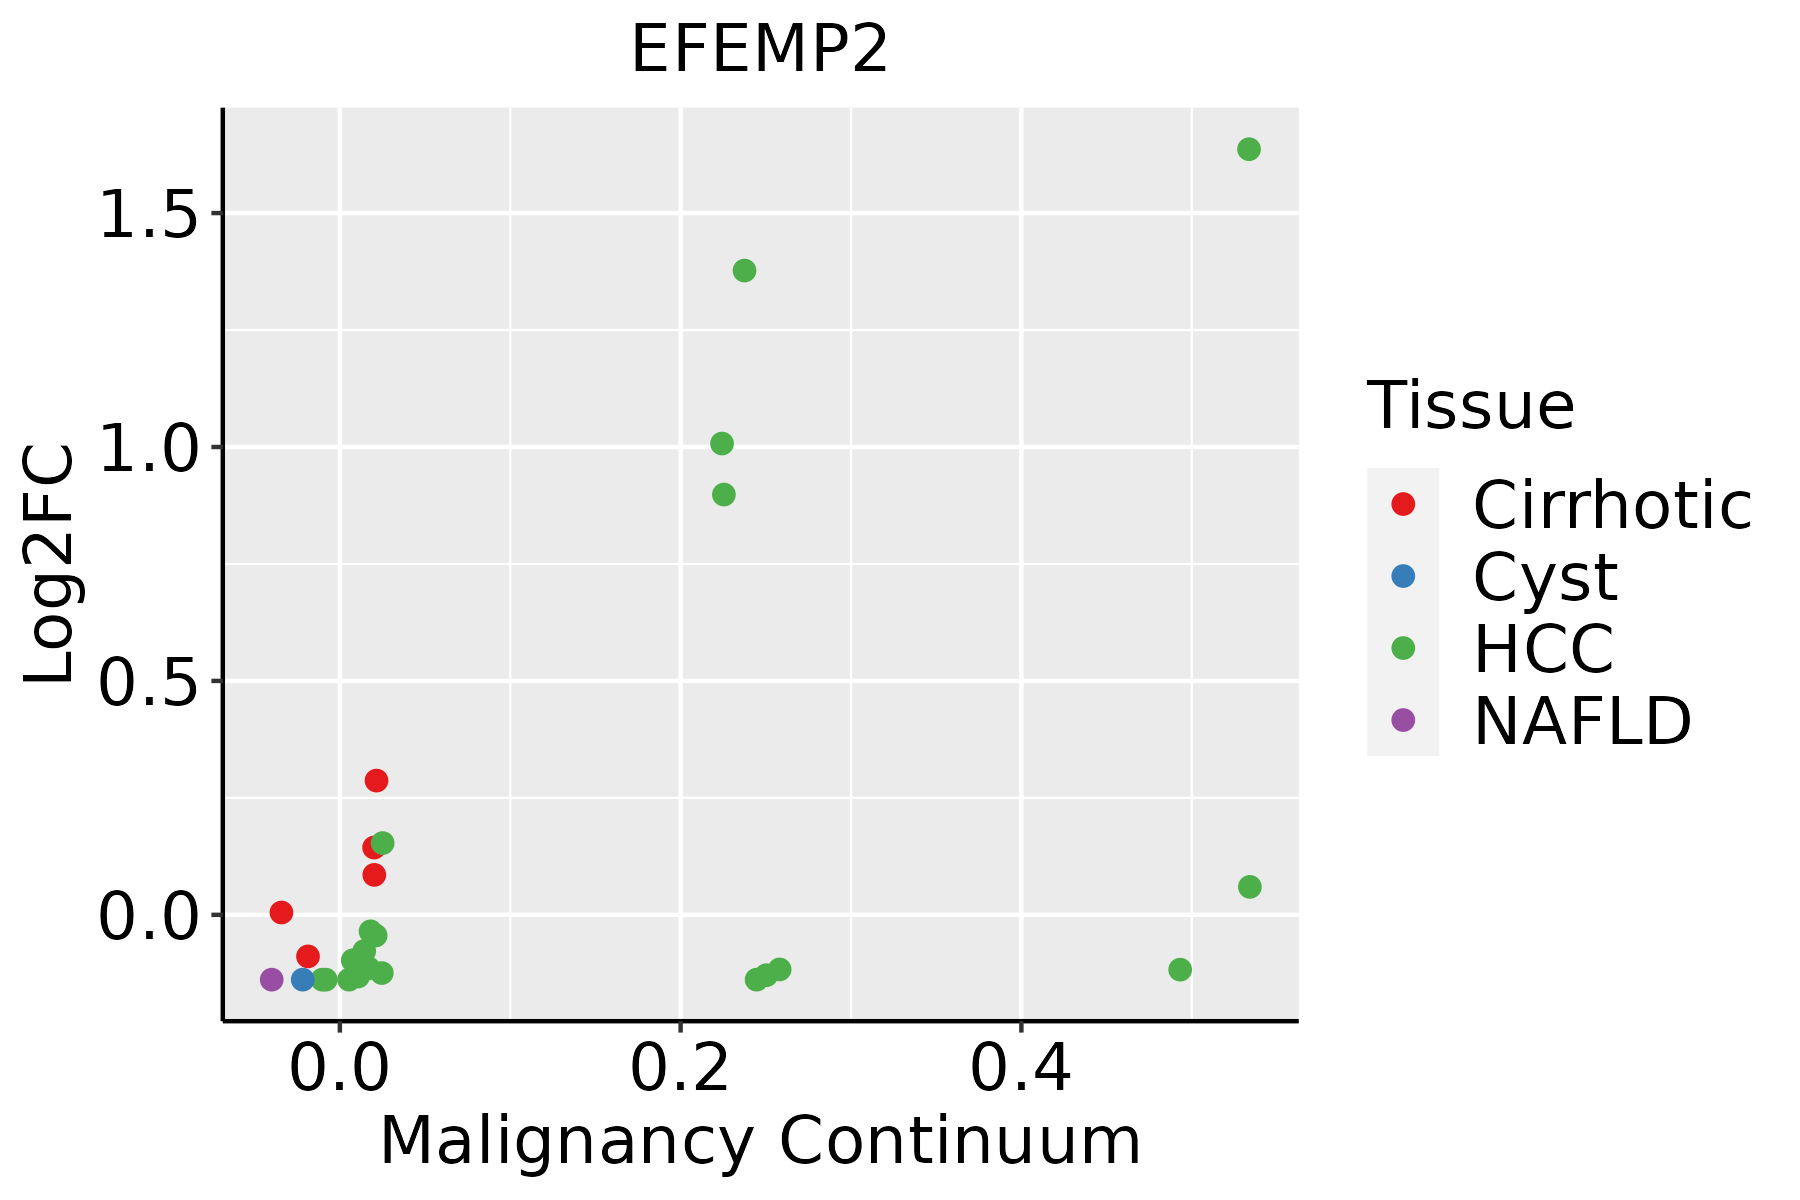 | HCC: Hepatocellular carcinoma |
| NAFLD: Non-alcoholic fatty liver disease | ||
| Oral Cavity |  | EOLP: Erosive Oral lichen planus |
| LP: leukoplakia | ||
| NEOLP: Non-erosive oral lichen planus | ||
| OSCC: Oral squamous cell carcinoma | ||
| Thyroid | 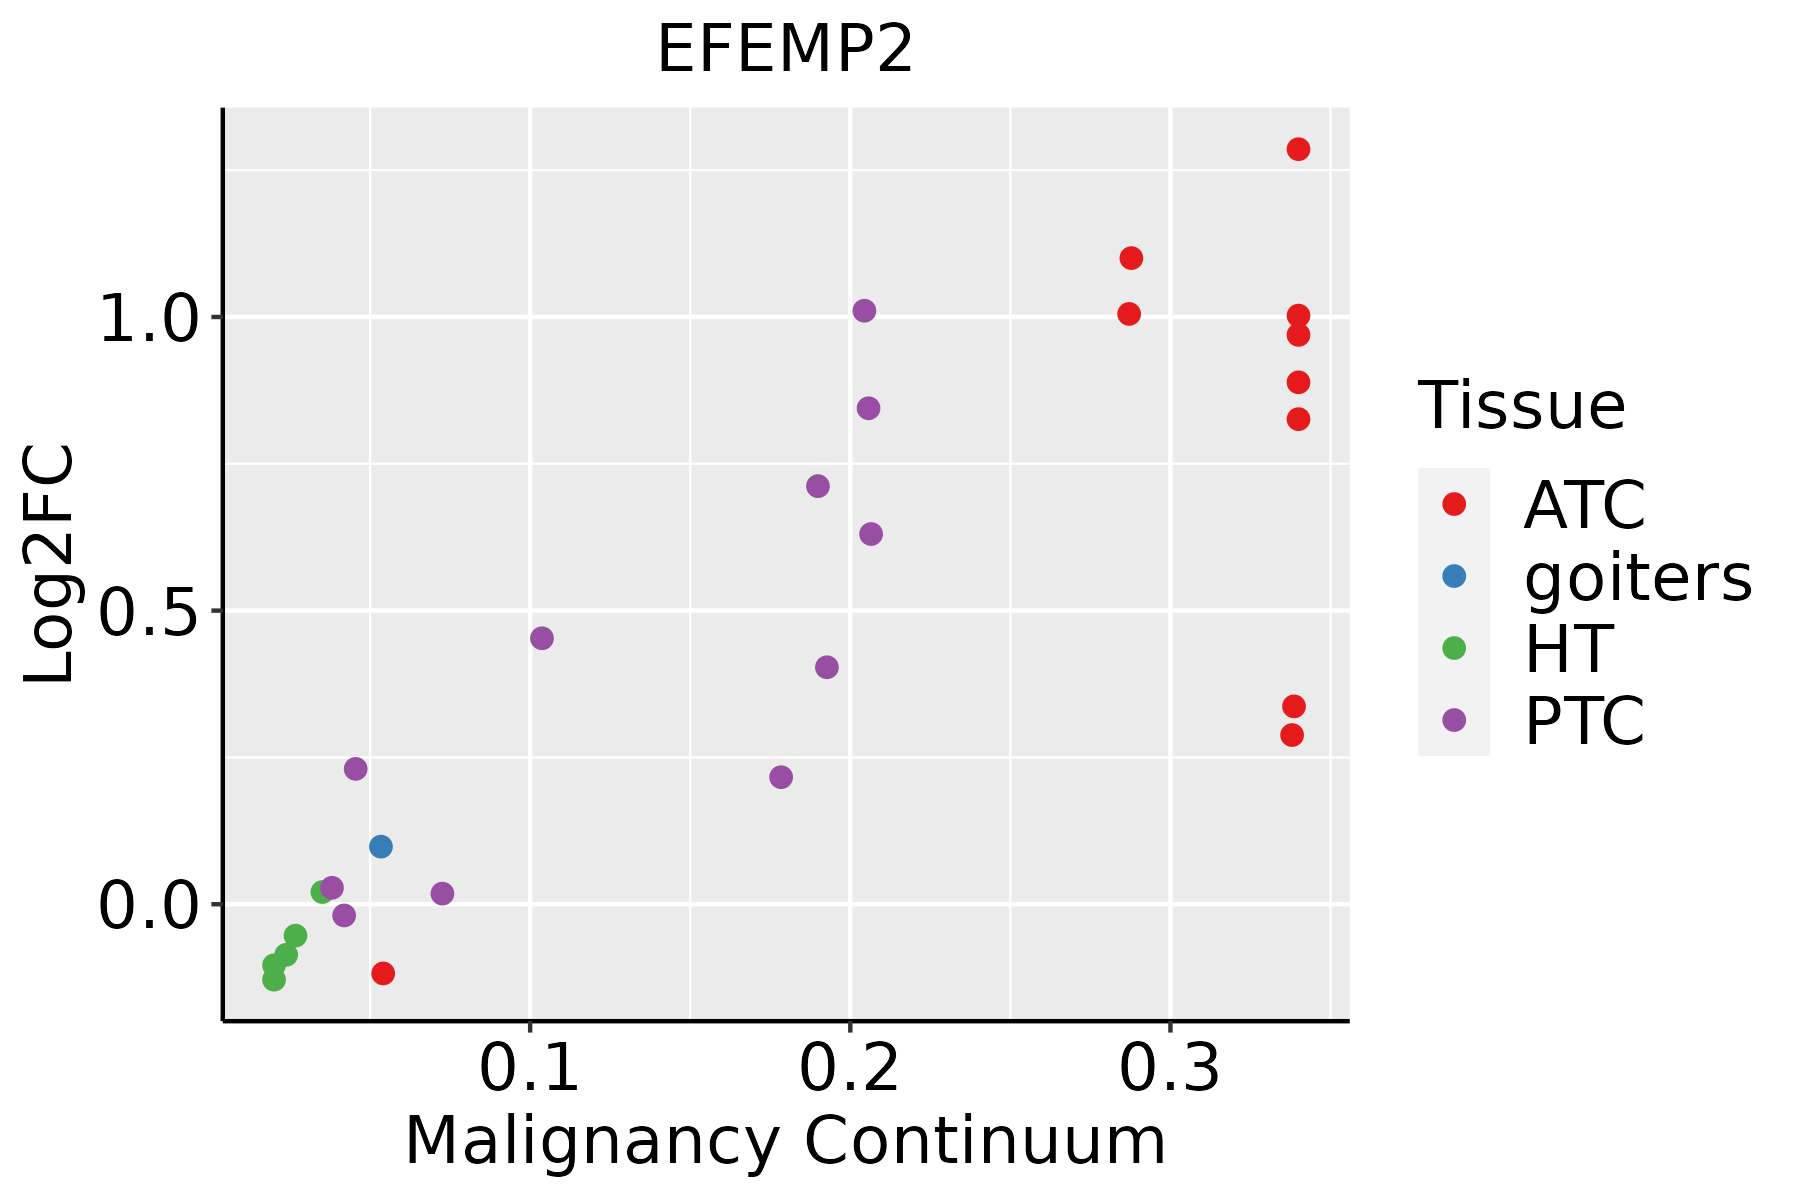 | ATC: Anaplastic thyroid cancer |
| HT: Hashimoto's thyroiditis | ||
| PTC: Papillary thyroid cancer |
| ∗log2FC in expression of this searched gene in stem-like cells from each diseased tissue sample relative to stem-like cells in normal samples in each tissue plotted against the malignancy continuum. Samples are colored based on if they are from different disease stage. |
Top |
Malignant transformation related pathway analysis |
| Find out the enriched GO biological processes and KEGG pathways involved in transition from healthy to precancer to cancer |
| Tissue | Disease Stage | Enriched GO biological Processes |
| Colorectum | AD |  |
| Colorectum | SER |  |
| Colorectum | MSS |  |
| Colorectum | MSI-H |  |
| Colorectum | FAP |  |
| ∗Top 15 enriched GO BP terms are showed in the bar plot of each disease state in each tissue. Each row represents a significant GO biological process which is colored according to the -log10(p.adjust). |
| Page: 1 2 3 4 5 6 7 8 9 |
| GO ID | Tissue | Disease Stage | Description | Gene Ratio | Bg Ratio | pvalue | p.adjust | Count |
| GO:001081015 | Endometrium | AEH | regulation of cell-substrate adhesion | 64/2100 | 221/18723 | 3.85e-13 | 9.62e-11 | 64 |
| GO:00315899 | Endometrium | AEH | cell-substrate adhesion | 87/2100 | 363/18723 | 3.51e-12 | 5.70e-10 | 87 |
| GO:004578516 | Endometrium | AEH | positive regulation of cell adhesion | 96/2100 | 437/18723 | 5.50e-11 | 7.18e-09 | 96 |
| GO:190290316 | Endometrium | AEH | regulation of supramolecular fiber organization | 83/2100 | 383/18723 | 2.20e-09 | 1.78e-07 | 83 |
| GO:001081116 | Endometrium | AEH | positive regulation of cell-substrate adhesion | 38/2100 | 123/18723 | 3.08e-09 | 2.26e-07 | 38 |
| GO:00605376 | Endometrium | AEH | muscle tissue development | 83/2100 | 403/18723 | 2.57e-08 | 1.50e-06 | 83 |
| GO:00019529 | Endometrium | AEH | regulation of cell-matrix adhesion | 37/2100 | 128/18723 | 3.58e-08 | 1.99e-06 | 37 |
| GO:00071609 | Endometrium | AEH | cell-matrix adhesion | 54/2100 | 233/18723 | 1.42e-07 | 6.37e-06 | 54 |
| GO:190290516 | Endometrium | AEH | positive regulation of supramolecular fiber organization | 48/2100 | 209/18723 | 9.11e-07 | 3.20e-05 | 48 |
| GO:00486604 | Endometrium | AEH | regulation of smooth muscle cell proliferation | 43/2100 | 180/18723 | 1.09e-06 | 3.68e-05 | 43 |
| GO:00486594 | Endometrium | AEH | smooth muscle cell proliferation | 43/2100 | 184/18723 | 2.04e-06 | 6.14e-05 | 43 |
| GO:00330022 | Endometrium | AEH | muscle cell proliferation | 51/2100 | 248/18723 | 1.26e-05 | 2.77e-04 | 51 |
| GO:00019549 | Endometrium | AEH | positive regulation of cell-matrix adhesion | 18/2100 | 58/18723 | 3.98e-05 | 6.86e-04 | 18 |
| GO:00075174 | Endometrium | AEH | muscle organ development | 60/2100 | 327/18723 | 8.19e-05 | 1.22e-03 | 60 |
| GO:00426925 | Endometrium | AEH | muscle cell differentiation | 68/2100 | 384/18723 | 8.88e-05 | 1.30e-03 | 68 |
| GO:0048662 | Endometrium | AEH | negative regulation of smooth muscle cell proliferation | 17/2100 | 75/18723 | 3.39e-03 | 2.36e-02 | 17 |
| GO:1904705 | Endometrium | AEH | regulation of vascular associated smooth muscle cell proliferation | 19/2100 | 90/18723 | 4.69e-03 | 2.99e-02 | 19 |
| GO:1990874 | Endometrium | AEH | vascular associated smooth muscle cell proliferation | 19/2100 | 91/18723 | 5.32e-03 | 3.32e-02 | 19 |
| GO:0030199 | Endometrium | AEH | collagen fibril organization | 14/2100 | 61/18723 | 6.65e-03 | 3.91e-02 | 14 |
| GO:001081016 | Endometrium | EEC | regulation of cell-substrate adhesion | 63/2168 | 221/18723 | 5.17e-12 | 8.85e-10 | 63 |
| Page: 1 2 3 4 5 6 7 8 |
| Pathway ID | Tissue | Disease Stage | Description | Gene Ratio | Bg Ratio | pvalue | p.adjust | qvalue | Count |
| Page: 1 |
Top |
Cell-cell communication analysis |
| Identification of potential cell-cell interactions between two cell types and their ligand-receptor pairs for different disease states |
| Ligand | Receptor | LRpair | Pathway | Tissue | Disease Stage |
| Page: 1 |
Top |
Single-cell gene regulatory network inference analysis |
| Find out the significant the regulons (TFs) and the target genes of each regulon across cell types for different disease states |
| TF | Cell Type | Tissue | Disease Stage | Target Gene | RSS | Regulon Activity |
| ∗The dot plots of a searched regulon are shown for all cell subpopulations in each disease state of each tissue based on the regulon specific score inferred using pySCENIC and by calculating the average expression. |
| Page: 1 |
Top |
Somatic mutation of malignant transformation related genes |
| Annotation of somatic variants for genes involved in malignant transformation |
| Hugo Symbol | Variant Class | Variant Classification | dbSNP RS | HGVSc | HGVSp | HGVSp Short | SWISSPROT | BIOTYPE | SIFT | PolyPhen | Tumor Sample Barcode | Tissue | Histology | Sex | Age | Stage | Therapy Types | Drugs | Outcome |
| EFEMP2 | SNV | Missense_Mutation | novel | c.998N>T | p.Asn333Ile | p.N333I | O95967 | protein_coding | deleterious(0.01) | benign(0.372) | TCGA-AO-A03T-01 | Breast | breast invasive carcinoma | Female | <65 | I/II | Chemotherapy | cyclophosphamide | SD |
| EFEMP2 | SNV | Missense_Mutation | c.444N>C | p.Gln148His | p.Q148H | O95967 | protein_coding | tolerated(0.32) | benign(0) | TCGA-AR-A256-01 | Breast | breast invasive carcinoma | Female | <65 | I/II | Chemotherapy | doxorubicin | PD | |
| EFEMP2 | SNV | Missense_Mutation | c.1129N>G | p.Gln377Glu | p.Q377E | O95967 | protein_coding | deleterious(0.01) | benign(0.023) | TCGA-D8-A1JA-01 | Breast | breast invasive carcinoma | Female | <65 | III/IV | Chemotherapy | adriamycin | PD | |
| EFEMP2 | SNV | Missense_Mutation | novel | c.1139N>A | p.Ala380Asp | p.A380D | O95967 | protein_coding | deleterious(0.03) | benign(0.081) | TCGA-D8-A1XQ-01 | Breast | breast invasive carcinoma | Female | >=65 | I/II | Unknown | Unknown | SD |
| EFEMP2 | SNV | Missense_Mutation | rs775241517 | c.1102N>A | p.Val368Ile | p.V368I | O95967 | protein_coding | tolerated(0.95) | probably_damaging(0.959) | TCGA-PL-A8LY-01 | Breast | breast invasive carcinoma | Female | <65 | I/II | Unknown | Unknown | SD |
| EFEMP2 | insertion | Frame_Shift_Ins | novel | c.999_1000insATAGGCGGCCAGGAGGCTGGGGGGCAGGGGTTTGAGT | p.Pro334IlefsTer38 | p.P334Ifs*38 | O95967 | protein_coding | TCGA-AO-A03T-01 | Breast | breast invasive carcinoma | Female | <65 | I/II | Chemotherapy | cyclophosphamide | SD | ||
| EFEMP2 | insertion | Frame_Shift_Ins | novel | c.778_779insTAGATATTGGAATTAGTAG | p.Asn260IlefsTer32 | p.N260Ifs*32 | O95967 | protein_coding | TCGA-D8-A27N-01 | Breast | breast invasive carcinoma | Female | <65 | III/IV | Chemotherapy | taxol+adriamycin+cyclophosphamide+herceptin | SD | ||
| EFEMP2 | SNV | Missense_Mutation | c.530N>A | p.Cys177Tyr | p.C177Y | O95967 | protein_coding | deleterious(0) | possibly_damaging(0.691) | TCGA-DS-A0VK-01 | Cervix | cervical & endocervical cancer | Female | <65 | I/II | Chemotherapy | carboplatin | PD | |
| EFEMP2 | SNV | Missense_Mutation | novel | c.594C>A | p.Asn198Lys | p.N198K | O95967 | protein_coding | deleterious(0.02) | possibly_damaging(0.58) | TCGA-EK-A2GZ-01 | Cervix | cervical & endocervical cancer | Female | <65 | III/IV | Unknown | Unknown | SD |
| EFEMP2 | SNV | Missense_Mutation | novel | c.868N>A | p.Gly290Ser | p.G290S | O95967 | protein_coding | deleterious(0.01) | probably_damaging(0.995) | TCGA-5M-AAT6-01 | Colorectum | colon adenocarcinoma | Female | <65 | III/IV | Unknown | Unknown | PD |
| Page: 1 2 3 4 5 6 |
Top |
Related drugs of malignant transformation related genes |
| Identification of chemicals and drugs interact with genes involved in malignant transfromation |
| (DGIdb 4.0) |
| Entrez ID | Symbol | Category | Interaction Types | Drug Claim Name | Drug Name | PMIDs |
| Page: 1 |

Copyright 2023-Present -The University of Texas Health Science Center at Houston |