
|
|||||
|
 | |
| |
| |
| |
| |
| |
|
Gene: EFCAB13 |
Gene summary for EFCAB13 |
| Gene information | Species | Human | Gene symbol | EFCAB13 | Gene ID | 124989 |
| Gene name | EF-hand calcium binding domain 13 | |
| Gene Alias | C17orf57 | |
| Cytomap | 17q21.32 | |
| Gene Type | protein-coding | GO ID | NA | UniProtAcc | Q8IY85 |
Top |
Malignant transformation analysis |
| Identification of the aberrant gene expression in precancerous and cancerous lesions by comparing the gene expression of stem-like cells in diseased tissues with normal stem cells |
| Entrez ID | Symbol | Replicates | Species | Organ | Tissue | Adj P-value | Log2FC | Malignancy |
| 124989 | EFCAB13 | male-WTA | Human | Thyroid | PTC | 1.25e-05 | 1.11e-01 | 0.1037 |
| 124989 | EFCAB13 | PTC01 | Human | Thyroid | PTC | 1.13e-11 | 2.33e-01 | 0.1899 |
| 124989 | EFCAB13 | PTC04 | Human | Thyroid | PTC | 1.54e-20 | 3.87e-01 | 0.1927 |
| 124989 | EFCAB13 | PTC05 | Human | Thyroid | PTC | 2.27e-12 | 4.74e-01 | 0.2065 |
| 124989 | EFCAB13 | PTC06 | Human | Thyroid | PTC | 5.53e-29 | 6.13e-01 | 0.2057 |
| 124989 | EFCAB13 | PTC07 | Human | Thyroid | PTC | 2.80e-17 | 2.94e-01 | 0.2044 |
| Page: 1 |
| Tissue | Expression Dynamics | Abbreviation |
| Thyroid | 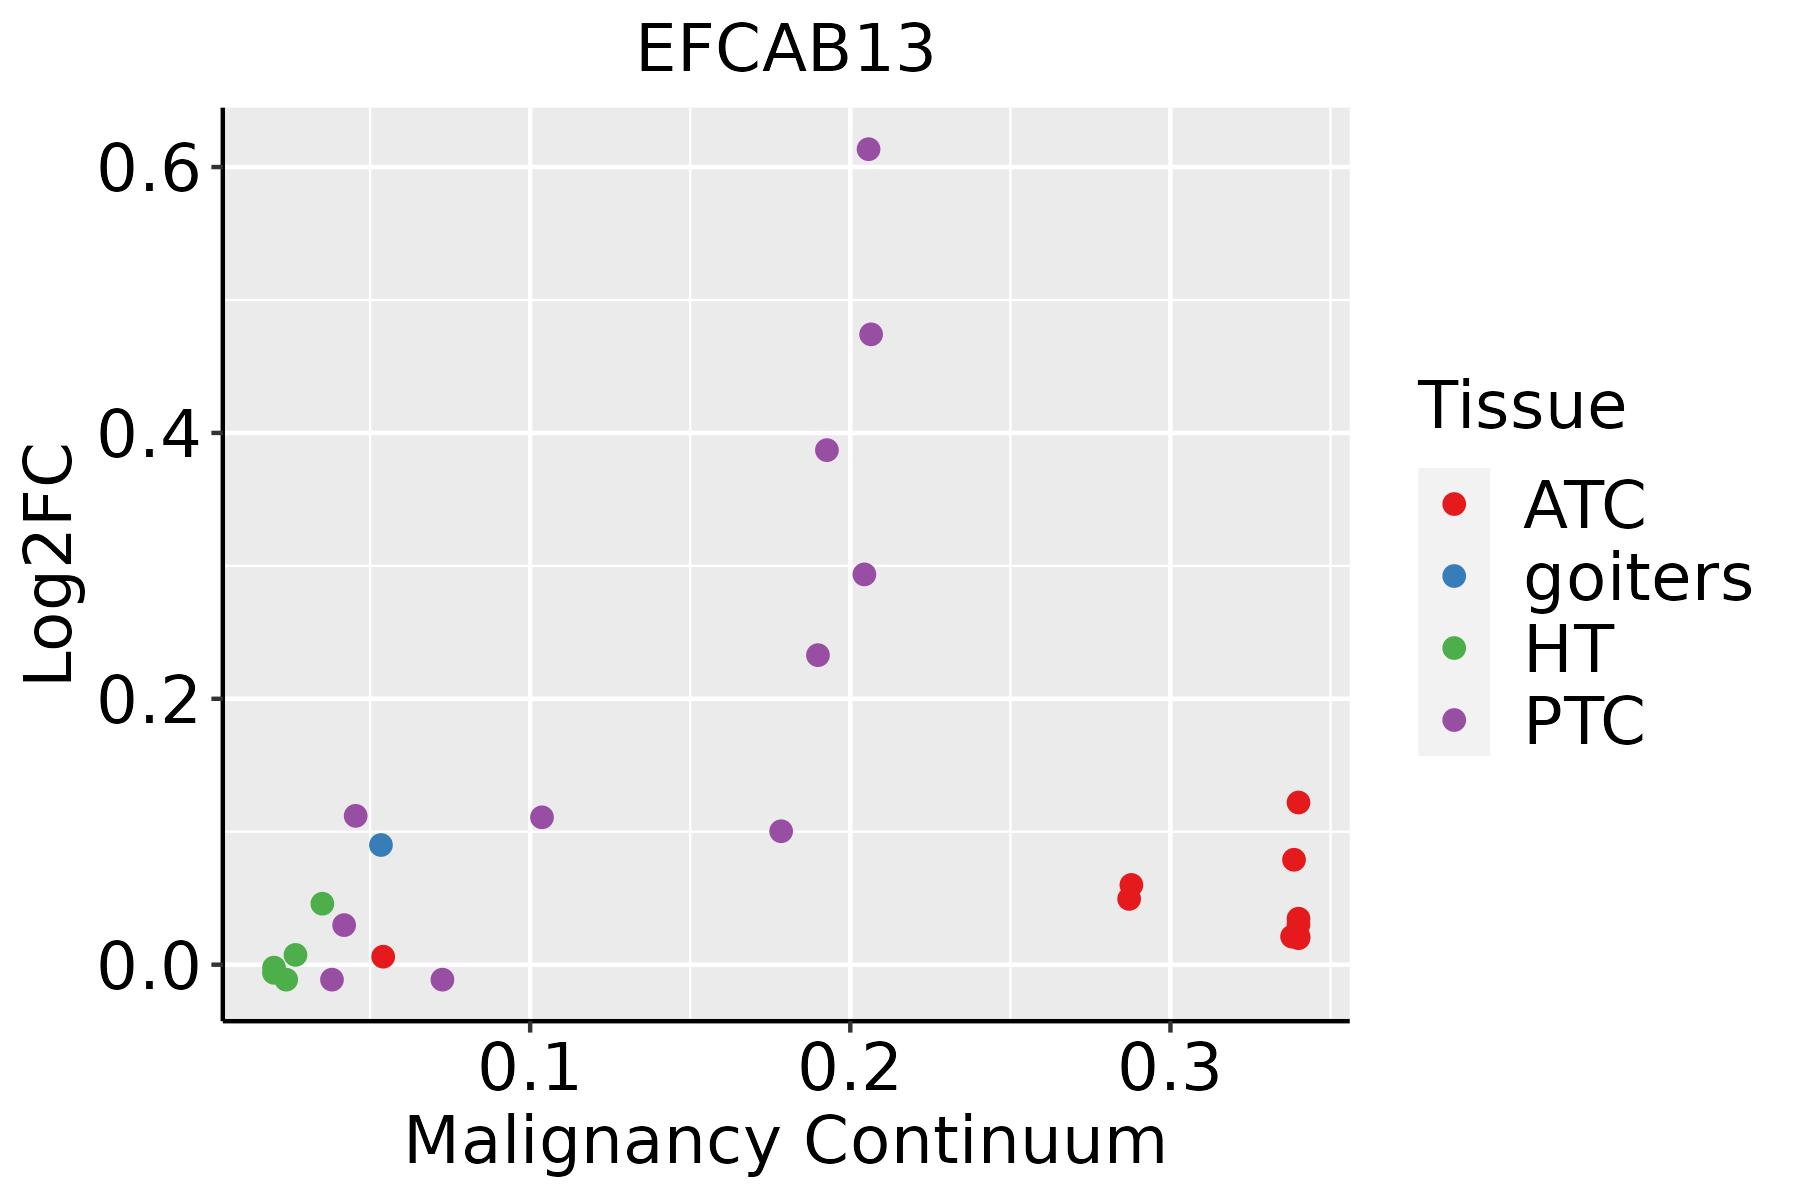 | ATC: Anaplastic thyroid cancer |
| HT: Hashimoto's thyroiditis | ||
| PTC: Papillary thyroid cancer |
| ∗log2FC in expression of this searched gene in stem-like cells from each diseased tissue sample relative to stem-like cells in normal samples in each tissue plotted against the malignancy continuum. Samples are colored based on if they are from different disease stage. |
Top |
Malignant transformation related pathway analysis |
| Find out the enriched GO biological processes and KEGG pathways involved in transition from healthy to precancer to cancer |
| Tissue | Disease Stage | Enriched GO biological Processes |
| Colorectum | AD |  |
| Colorectum | SER |  |
| Colorectum | MSS |  |
| Colorectum | MSI-H |  |
| Colorectum | FAP |  |
| ∗Top 15 enriched GO BP terms are showed in the bar plot of each disease state in each tissue. Each row represents a significant GO biological process which is colored according to the -log10(p.adjust). |
| Page: 1 2 3 4 5 6 7 8 9 |
| GO ID | Tissue | Disease Stage | Description | Gene Ratio | Bg Ratio | pvalue | p.adjust | Count |
| Page: 1 |
| Pathway ID | Tissue | Disease Stage | Description | Gene Ratio | Bg Ratio | pvalue | p.adjust | qvalue | Count |
| Page: 1 |
Top |
Cell-cell communication analysis |
| Identification of potential cell-cell interactions between two cell types and their ligand-receptor pairs for different disease states |
| Ligand | Receptor | LRpair | Pathway | Tissue | Disease Stage |
| Page: 1 |
Top |
Single-cell gene regulatory network inference analysis |
| Find out the significant the regulons (TFs) and the target genes of each regulon across cell types for different disease states |
| TF | Cell Type | Tissue | Disease Stage | Target Gene | RSS | Regulon Activity |
| ∗The dot plots of a searched regulon are shown for all cell subpopulations in each disease state of each tissue based on the regulon specific score inferred using pySCENIC and by calculating the average expression. |
| Page: 1 |
Top |
Somatic mutation of malignant transformation related genes |
| Annotation of somatic variants for genes involved in malignant transformation |
| Hugo Symbol | Variant Class | Variant Classification | dbSNP RS | HGVSc | HGVSp | HGVSp Short | SWISSPROT | BIOTYPE | SIFT | PolyPhen | Tumor Sample Barcode | Tissue | Histology | Sex | Age | Stage | Therapy Types | Drugs | Outcome |
| EFCAB13 | SNV | Missense_Mutation | rs369709542 | c.2792N>T | p.Ser931Leu | p.S931L | Q8IY85 | protein_coding | tolerated_low_confidence(0.32) | benign(0.024) | TCGA-A2-A0ET-01 | Breast | breast invasive carcinoma | Female | <65 | III/IV | Chemotherapy | cytoxan | SD |
| EFCAB13 | SNV | Missense_Mutation | c.1355N>G | p.Thr452Ser | p.T452S | Q8IY85 | protein_coding | tolerated(0.21) | benign(0.009) | TCGA-A8-A09M-01 | Breast | breast invasive carcinoma | Female | >=65 | III/IV | Chemotherapy | paclitaxel | CR | |
| EFCAB13 | SNV | Missense_Mutation | c.2571N>C | p.Leu857Phe | p.L857F | Q8IY85 | protein_coding | tolerated(0.05) | probably_damaging(0.998) | TCGA-AC-A23H-01 | Breast | breast invasive carcinoma | Female | >=65 | I/II | Unknown | Unknown | PD | |
| EFCAB13 | SNV | Missense_Mutation | novel | c.1957N>T | p.Val653Leu | p.V653L | Q8IY85 | protein_coding | tolerated(0.06) | benign(0.381) | TCGA-AN-A046-01 | Breast | breast invasive carcinoma | Female | >=65 | I/II | Unknown | Unknown | SD |
| EFCAB13 | SNV | Missense_Mutation | rs764705583 | c.2527N>A | p.Leu843Ile | p.L843I | Q8IY85 | protein_coding | tolerated(0.15) | possibly_damaging(0.513) | TCGA-AN-A046-01 | Breast | breast invasive carcinoma | Female | >=65 | I/II | Unknown | Unknown | SD |
| EFCAB13 | SNV | Missense_Mutation | novel | c.2536N>A | p.Asp846Asn | p.D846N | Q8IY85 | protein_coding | tolerated(0.1) | benign(0.402) | TCGA-BH-A0B6-01 | Breast | breast invasive carcinoma | Female | <65 | I/II | Unknown | Unknown | SD |
| EFCAB13 | SNV | Missense_Mutation | c.29A>T | p.Gln10Leu | p.Q10L | Q8IY85 | protein_coding | deleterious(0) | possibly_damaging(0.634) | TCGA-BH-A0BV-01 | Breast | breast invasive carcinoma | Female | >=65 | I/II | Chemotherapy | doxorubicin | SD | |
| EFCAB13 | SNV | Missense_Mutation | c.419N>G | p.Ser140Cys | p.S140C | Q8IY85 | protein_coding | deleterious(0.05) | probably_damaging(0.957) | TCGA-BH-A1FN-01 | Breast | breast invasive carcinoma | Female | <65 | I/II | Unknown | Unknown | PD | |
| EFCAB13 | SNV | Missense_Mutation | novel | c.2002G>T | p.Ala668Ser | p.A668S | Q8IY85 | protein_coding | tolerated(0.39) | benign(0.007) | TCGA-LL-A50Y-01 | Breast | breast invasive carcinoma | Female | >=65 | I/II | Hormone Therapy | arimidex | CR |
| EFCAB13 | SNV | Missense_Mutation | novel | c.755N>G | p.Pro252Arg | p.P252R | Q8IY85 | protein_coding | deleterious(0.03) | benign(0.277) | TCGA-OL-A5D7-01 | Breast | breast invasive carcinoma | Female | >=65 | I/II | Chemotherapy | cytoxan | CR |
| Page: 1 2 3 4 5 6 7 8 9 10 11 12 13 |
Top |
Related drugs of malignant transformation related genes |
| Identification of chemicals and drugs interact with genes involved in malignant transfromation |
| (DGIdb 4.0) |
| Entrez ID | Symbol | Category | Interaction Types | Drug Claim Name | Drug Name | PMIDs |
| Page: 1 |

Copyright 2023-Present -The University of Texas Health Science Center at Houston |