
|
|||||
|
 | |
| |
| |
| |
| |
| |
|
Gene: EEPD1 |
Gene summary for EEPD1 |
| Gene information | Species | Human | Gene symbol | EEPD1 | Gene ID | 80820 |
| Gene name | endonuclease/exonuclease/phosphatase family domain containing 1 | |
| Gene Alias | HSPC107 | |
| Cytomap | 7p14.2 | |
| Gene Type | protein-coding | GO ID | GO:0006139 | UniProtAcc | Q7L9B9 |
Top |
Malignant transformation analysis |
| Identification of the aberrant gene expression in precancerous and cancerous lesions by comparing the gene expression of stem-like cells in diseased tissues with normal stem cells |
| Entrez ID | Symbol | Replicates | Species | Organ | Tissue | Adj P-value | Log2FC | Malignancy |
| 80820 | EEPD1 | HTA11_3410_2000001011 | Human | Colorectum | AD | 3.88e-02 | -2.29e-01 | 0.0155 |
| 80820 | EEPD1 | HTA11_1938_2000001011 | Human | Colorectum | AD | 1.01e-06 | 5.35e-01 | -0.0811 |
| 80820 | EEPD1 | HTA11_1391_2000001011 | Human | Colorectum | AD | 1.76e-02 | 4.38e-01 | -0.059 |
| 80820 | EEPD1 | HTA11_7696_3000711011 | Human | Colorectum | AD | 8.51e-05 | 4.18e-01 | 0.0674 |
| 80820 | EEPD1 | HTA11_99999971662_82457 | Human | Colorectum | MSS | 3.97e-17 | 9.03e-01 | 0.3859 |
| 80820 | EEPD1 | A015-C-203 | Human | Colorectum | FAP | 3.80e-10 | 2.73e-03 | -0.1294 |
| 80820 | EEPD1 | A002-C-201 | Human | Colorectum | FAP | 7.08e-03 | -6.67e-02 | 0.0324 |
| 80820 | EEPD1 | A002-C-203 | Human | Colorectum | FAP | 1.71e-03 | 3.35e-01 | 0.2786 |
| 80820 | EEPD1 | A001-C-108 | Human | Colorectum | FAP | 1.34e-07 | 1.94e-01 | -0.0272 |
| 80820 | EEPD1 | A002-C-205 | Human | Colorectum | FAP | 3.81e-07 | -5.74e-02 | -0.1236 |
| 80820 | EEPD1 | A001-C-104 | Human | Colorectum | FAP | 3.07e-04 | 2.95e-01 | 0.0184 |
| 80820 | EEPD1 | A015-C-006 | Human | Colorectum | FAP | 1.35e-02 | -1.60e-01 | -0.0994 |
| 80820 | EEPD1 | A015-C-106 | Human | Colorectum | FAP | 8.10e-05 | 1.36e-01 | -0.0511 |
| 80820 | EEPD1 | A002-C-114 | Human | Colorectum | FAP | 1.99e-05 | -1.58e-01 | -0.1561 |
| 80820 | EEPD1 | A015-C-104 | Human | Colorectum | FAP | 1.27e-11 | -1.02e-01 | -0.1899 |
| 80820 | EEPD1 | A001-C-014 | Human | Colorectum | FAP | 2.49e-04 | 1.45e-01 | 0.0135 |
| 80820 | EEPD1 | A002-C-016 | Human | Colorectum | FAP | 7.95e-07 | -9.54e-02 | 0.0521 |
| 80820 | EEPD1 | A015-C-002 | Human | Colorectum | FAP | 1.35e-02 | -6.86e-02 | -0.0763 |
| 80820 | EEPD1 | A001-C-203 | Human | Colorectum | FAP | 1.26e-03 | 1.93e-01 | -0.0481 |
| 80820 | EEPD1 | A002-C-116 | Human | Colorectum | FAP | 3.08e-14 | -2.57e-01 | -0.0452 |
| Page: 1 2 |
| Tissue | Expression Dynamics | Abbreviation |
| Colorectum (GSE201348) |  | FAP: Familial adenomatous polyposis |
| CRC: Colorectal cancer | ||
| Colorectum (HTA11) |  | AD: Adenomas |
| SER: Sessile serrated lesions | ||
| MSI-H: Microsatellite-high colorectal cancer | ||
| MSS: Microsatellite stable colorectal cancer | ||
| Liver | 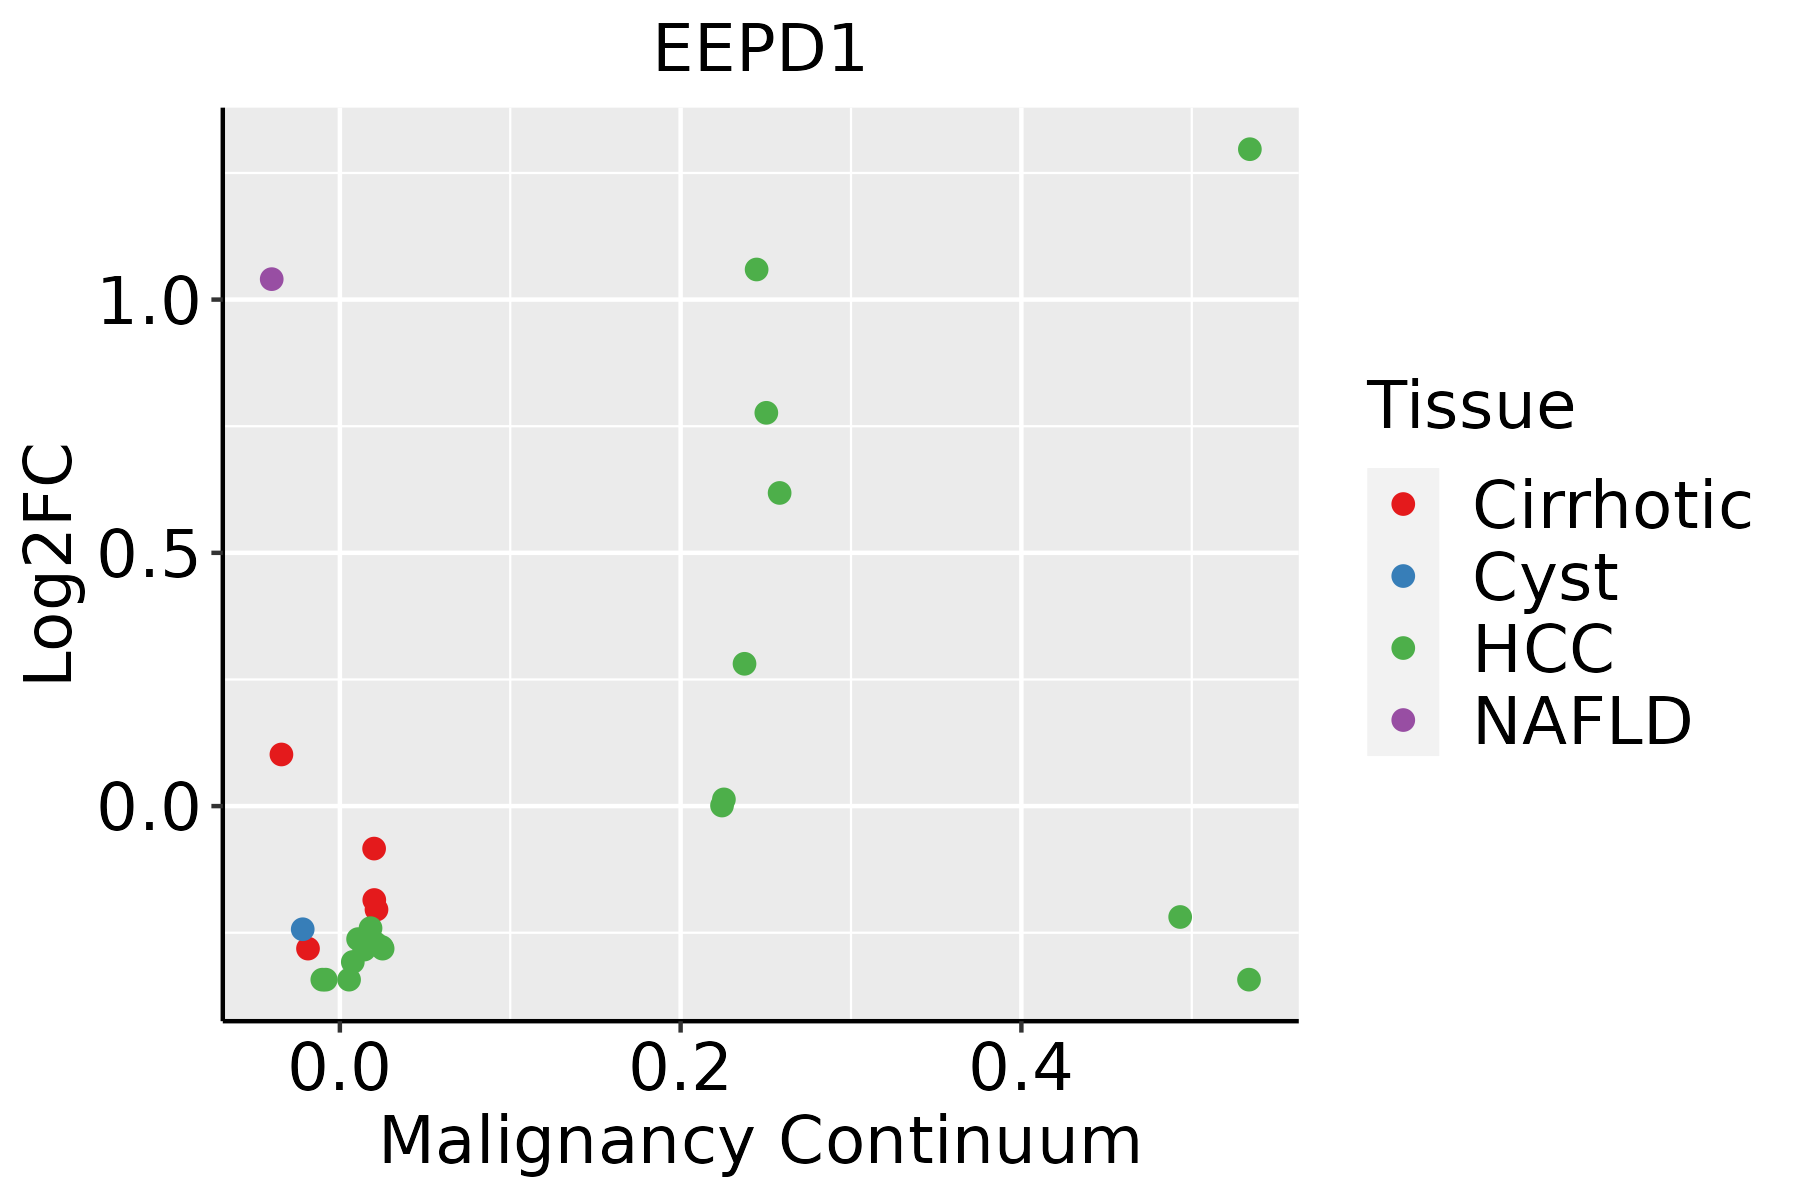 | HCC: Hepatocellular carcinoma |
| NAFLD: Non-alcoholic fatty liver disease |
| ∗log2FC in expression of this searched gene in stem-like cells from each diseased tissue sample relative to stem-like cells in normal samples in each tissue plotted against the malignancy continuum. Samples are colored based on if they are from different disease stage. |
Top |
Malignant transformation related pathway analysis |
| Find out the enriched GO biological processes and KEGG pathways involved in transition from healthy to precancer to cancer |
| Tissue | Disease Stage | Enriched GO biological Processes |
| Colorectum | AD |  |
| Colorectum | SER |  |
| Colorectum | MSS |  |
| Colorectum | MSI-H |  |
| Colorectum | FAP |  |
| ∗Top 15 enriched GO BP terms are showed in the bar plot of each disease state in each tissue. Each row represents a significant GO biological process which is colored according to the -log10(p.adjust). |
| Page: 1 2 3 4 5 6 7 8 9 |
| GO ID | Tissue | Disease Stage | Description | Gene Ratio | Bg Ratio | pvalue | p.adjust | Count |
| GO:0010876 | Colorectum | AD | lipid localization | 120/3918 | 448/18723 | 1.59e-03 | 1.33e-02 | 120 |
| GO:0006869 | Colorectum | AD | lipid transport | 108/3918 | 398/18723 | 1.67e-03 | 1.39e-02 | 108 |
| GO:00108761 | Colorectum | MSS | lipid localization | 104/3467 | 448/18723 | 6.76e-03 | 4.38e-02 | 104 |
| GO:00068691 | Colorectum | FAP | lipid transport | 81/2622 | 398/18723 | 2.84e-04 | 3.76e-03 | 81 |
| GO:00108762 | Colorectum | FAP | lipid localization | 85/2622 | 448/18723 | 1.92e-03 | 1.63e-02 | 85 |
| GO:00068692 | Colorectum | CRC | lipid transport | 63/2078 | 398/18723 | 2.36e-03 | 2.26e-02 | 63 |
| GO:00108763 | Colorectum | CRC | lipid localization | 68/2078 | 448/18723 | 4.60e-03 | 3.58e-02 | 68 |
| GO:00108765 | Liver | NAFLD | lipid localization | 79/1882 | 448/18723 | 4.75e-07 | 2.92e-05 | 79 |
| GO:00303013 | Liver | NAFLD | cholesterol transport | 30/1882 | 117/18723 | 1.08e-06 | 5.40e-05 | 30 |
| GO:00068694 | Liver | NAFLD | lipid transport | 71/1882 | 398/18723 | 1.16e-06 | 5.59e-05 | 71 |
| GO:00159183 | Liver | NAFLD | sterol transport | 32/1882 | 130/18723 | 1.27e-06 | 6.01e-05 | 32 |
| GO:0032373 | Liver | NAFLD | positive regulation of sterol transport | 15/1882 | 38/18723 | 1.68e-06 | 7.43e-05 | 15 |
| GO:0032376 | Liver | NAFLD | positive regulation of cholesterol transport | 15/1882 | 38/18723 | 1.68e-06 | 7.43e-05 | 15 |
| GO:0033344 | Liver | NAFLD | cholesterol efflux | 20/1882 | 69/18723 | 9.13e-06 | 2.98e-04 | 20 |
| GO:0015850 | Liver | NAFLD | organic hydroxy compound transport | 50/1882 | 284/18723 | 6.01e-05 | 1.32e-03 | 50 |
| GO:0032371 | Liver | NAFLD | regulation of sterol transport | 20/1882 | 78/18723 | 6.46e-05 | 1.39e-03 | 20 |
| GO:0032374 | Liver | NAFLD | regulation of cholesterol transport | 20/1882 | 78/18723 | 6.46e-05 | 1.39e-03 | 20 |
| GO:0010875 | Liver | NAFLD | positive regulation of cholesterol efflux | 10/1882 | 26/18723 | 1.20e-04 | 2.32e-03 | 10 |
| GO:1905952 | Liver | NAFLD | regulation of lipid localization | 34/1882 | 181/18723 | 2.51e-04 | 4.12e-03 | 34 |
| GO:1905954 | Liver | NAFLD | positive regulation of lipid localization | 23/1882 | 110/18723 | 5.16e-04 | 7.15e-03 | 23 |
| Page: 1 2 |
| Pathway ID | Tissue | Disease Stage | Description | Gene Ratio | Bg Ratio | pvalue | p.adjust | qvalue | Count |
| Page: 1 |
Top |
Cell-cell communication analysis |
| Identification of potential cell-cell interactions between two cell types and their ligand-receptor pairs for different disease states |
| Ligand | Receptor | LRpair | Pathway | Tissue | Disease Stage |
| Page: 1 |
Top |
Single-cell gene regulatory network inference analysis |
| Find out the significant the regulons (TFs) and the target genes of each regulon across cell types for different disease states |
| TF | Cell Type | Tissue | Disease Stage | Target Gene | RSS | Regulon Activity |
| ∗The dot plots of a searched regulon are shown for all cell subpopulations in each disease state of each tissue based on the regulon specific score inferred using pySCENIC and by calculating the average expression. |
| Page: 1 |
Top |
Somatic mutation of malignant transformation related genes |
| Annotation of somatic variants for genes involved in malignant transformation |
| Hugo Symbol | Variant Class | Variant Classification | dbSNP RS | HGVSc | HGVSp | HGVSp Short | SWISSPROT | BIOTYPE | SIFT | PolyPhen | Tumor Sample Barcode | Tissue | Histology | Sex | Age | Stage | Therapy Types | Drugs | Outcome |
| EEPD1 | SNV | Missense_Mutation | novel | c.305N>A | p.Ser102Asn | p.S102N | Q7L9B9 | protein_coding | tolerated(0.1) | possibly_damaging(0.69) | TCGA-3C-AALK-01 | Breast | breast invasive carcinoma | Female | <65 | I/II | Chemotherapy | docetaxel | SD |
| EEPD1 | SNV | Missense_Mutation | rs747268053 | c.1079N>G | p.Ala360Gly | p.A360G | Q7L9B9 | protein_coding | tolerated(0.19) | benign(0.13) | TCGA-A8-A096-01 | Breast | breast invasive carcinoma | Female | >=65 | I/II | Unknown | Unknown | SD |
| EEPD1 | SNV | Missense_Mutation | c.1695N>G | p.Ile565Met | p.I565M | Q7L9B9 | protein_coding | tolerated(0.22) | benign(0.021) | TCGA-AC-A23H-01 | Breast | breast invasive carcinoma | Female | >=65 | I/II | Unknown | Unknown | PD | |
| EEPD1 | SNV | Missense_Mutation | novel | c.448G>T | p.Val150Leu | p.V150L | Q7L9B9 | protein_coding | tolerated(0.19) | benign(0.007) | TCGA-AC-A5XU-01 | Breast | breast invasive carcinoma | Female | >=65 | I/II | Hormone Therapy | letrozole | SD |
| EEPD1 | SNV | Missense_Mutation | rs746320616 | c.1645G>A | p.Ala549Thr | p.A549T | Q7L9B9 | protein_coding | tolerated(0.41) | benign(0.006) | TCGA-AN-A046-01 | Breast | breast invasive carcinoma | Female | >=65 | I/II | Unknown | Unknown | SD |
| EEPD1 | SNV | Missense_Mutation | rs747268053 | c.1079C>G | p.Ala360Gly | p.A360G | Q7L9B9 | protein_coding | tolerated(0.19) | benign(0.13) | TCGA-BH-A0HL-01 | Breast | breast invasive carcinoma | Female | <65 | I/II | Chemotherapy | cyclophosphamide | SD |
| EEPD1 | SNV | Missense_Mutation | c.214N>A | p.Gly72Ser | p.G72S | Q7L9B9 | protein_coding | deleterious(0.01) | probably_damaging(0.931) | TCGA-GM-A2DD-01 | Breast | breast invasive carcinoma | Female | <65 | I/II | Chemotherapy | fluorouracil | CR | |
| EEPD1 | insertion | In_Frame_Ins | novel | c.1068_1069insGTTCAGCAGTGTCTGAATAAGGCTGAT | p.Trp356_Asp357insValGlnGlnCysLeuAsnLysAlaAsp | p.W356_D357insVQQCLNKAD | Q7L9B9 | protein_coding | TCGA-A2-A0CT-01 | Breast | breast invasive carcinoma | Female | >=65 | I/II | Chemotherapy | cytoxan | SD | ||
| EEPD1 | insertion | In_Frame_Ins | novel | c.355_356insCGGTGTTTGTCTATAGTAACCTCT | p.Leu118_Leu119insProValPheValTyrSerAsnLeu | p.L118_L119insPVFVYSNL | Q7L9B9 | protein_coding | TCGA-A8-A09C-01 | Breast | breast invasive carcinoma | Female | >=65 | I/II | Unknown | Unknown | SD | ||
| EEPD1 | insertion | Frame_Shift_Ins | novel | c.1534_1535insAATCTCTACAGGTGGAACTCCAATTTCTGAGAGT | p.Gly512GlufsTer21 | p.G512Efs*21 | Q7L9B9 | protein_coding | TCGA-BH-A0HX-01 | Breast | breast invasive carcinoma | Female | <65 | I/II | Chemotherapy | adrimycin | SD |
| Page: 1 2 3 4 5 6 7 |
Top |
Related drugs of malignant transformation related genes |
| Identification of chemicals and drugs interact with genes involved in malignant transfromation |
| (DGIdb 4.0) |
| Entrez ID | Symbol | Category | Interaction Types | Drug Claim Name | Drug Name | PMIDs |
| Page: 1 |

Copyright 2023-Present -The University of Texas Health Science Center at Houston |