
|
|||||
|
 | |
| |
| |
| |
| |
| |
|
Gene: EEFSEC |
Gene summary for EEFSEC |
| Gene information | Species | Human | Gene symbol | EEFSEC | Gene ID | 60678 |
| Gene name | eukaryotic elongation factor, selenocysteine-tRNA specific | |
| Gene Alias | EFSEC | |
| Cytomap | 3q21.3 | |
| Gene Type | protein-coding | GO ID | GO:0001514 | UniProtAcc | P57772 |
Top |
Malignant transformation analysis |
| Identification of the aberrant gene expression in precancerous and cancerous lesions by comparing the gene expression of stem-like cells in diseased tissues with normal stem cells |
| Entrez ID | Symbol | Replicates | Species | Organ | Tissue | Adj P-value | Log2FC | Malignancy |
| 60678 | EEFSEC | CCI_2 | Human | Cervix | CC | 6.00e-06 | 7.06e-01 | 0.5249 |
| 60678 | EEFSEC | CCI_3 | Human | Cervix | CC | 1.43e-14 | 9.32e-01 | 0.516 |
| 60678 | EEFSEC | LZE2T | Human | Esophagus | ESCC | 5.94e-04 | 4.82e-01 | 0.082 |
| 60678 | EEFSEC | LZE4T | Human | Esophagus | ESCC | 2.59e-11 | 2.84e-01 | 0.0811 |
| 60678 | EEFSEC | LZE7T | Human | Esophagus | ESCC | 5.45e-04 | 1.80e-01 | 0.0667 |
| 60678 | EEFSEC | LZE20T | Human | Esophagus | ESCC | 4.30e-03 | 8.64e-02 | 0.0662 |
| 60678 | EEFSEC | LZE22T | Human | Esophagus | ESCC | 2.46e-04 | 2.19e-01 | 0.068 |
| 60678 | EEFSEC | LZE24T | Human | Esophagus | ESCC | 6.53e-17 | 3.70e-01 | 0.0596 |
| 60678 | EEFSEC | P1T-E | Human | Esophagus | ESCC | 9.35e-07 | 3.15e-01 | 0.0875 |
| 60678 | EEFSEC | P2T-E | Human | Esophagus | ESCC | 1.04e-45 | 8.57e-01 | 0.1177 |
| 60678 | EEFSEC | P4T-E | Human | Esophagus | ESCC | 6.48e-24 | 5.06e-01 | 0.1323 |
| 60678 | EEFSEC | P5T-E | Human | Esophagus | ESCC | 1.49e-25 | 3.46e-01 | 0.1327 |
| 60678 | EEFSEC | P8T-E | Human | Esophagus | ESCC | 3.53e-25 | 4.68e-01 | 0.0889 |
| 60678 | EEFSEC | P9T-E | Human | Esophagus | ESCC | 8.35e-18 | 4.14e-01 | 0.1131 |
| 60678 | EEFSEC | P10T-E | Human | Esophagus | ESCC | 2.84e-34 | 5.63e-01 | 0.116 |
| 60678 | EEFSEC | P11T-E | Human | Esophagus | ESCC | 6.87e-10 | 2.47e-01 | 0.1426 |
| 60678 | EEFSEC | P12T-E | Human | Esophagus | ESCC | 1.95e-26 | 3.85e-01 | 0.1122 |
| 60678 | EEFSEC | P15T-E | Human | Esophagus | ESCC | 1.43e-24 | 4.98e-01 | 0.1149 |
| 60678 | EEFSEC | P16T-E | Human | Esophagus | ESCC | 1.09e-22 | 4.61e-01 | 0.1153 |
| 60678 | EEFSEC | P17T-E | Human | Esophagus | ESCC | 3.77e-13 | 5.02e-01 | 0.1278 |
| Page: 1 2 3 4 5 |
| Tissue | Expression Dynamics | Abbreviation |
| Cervix | 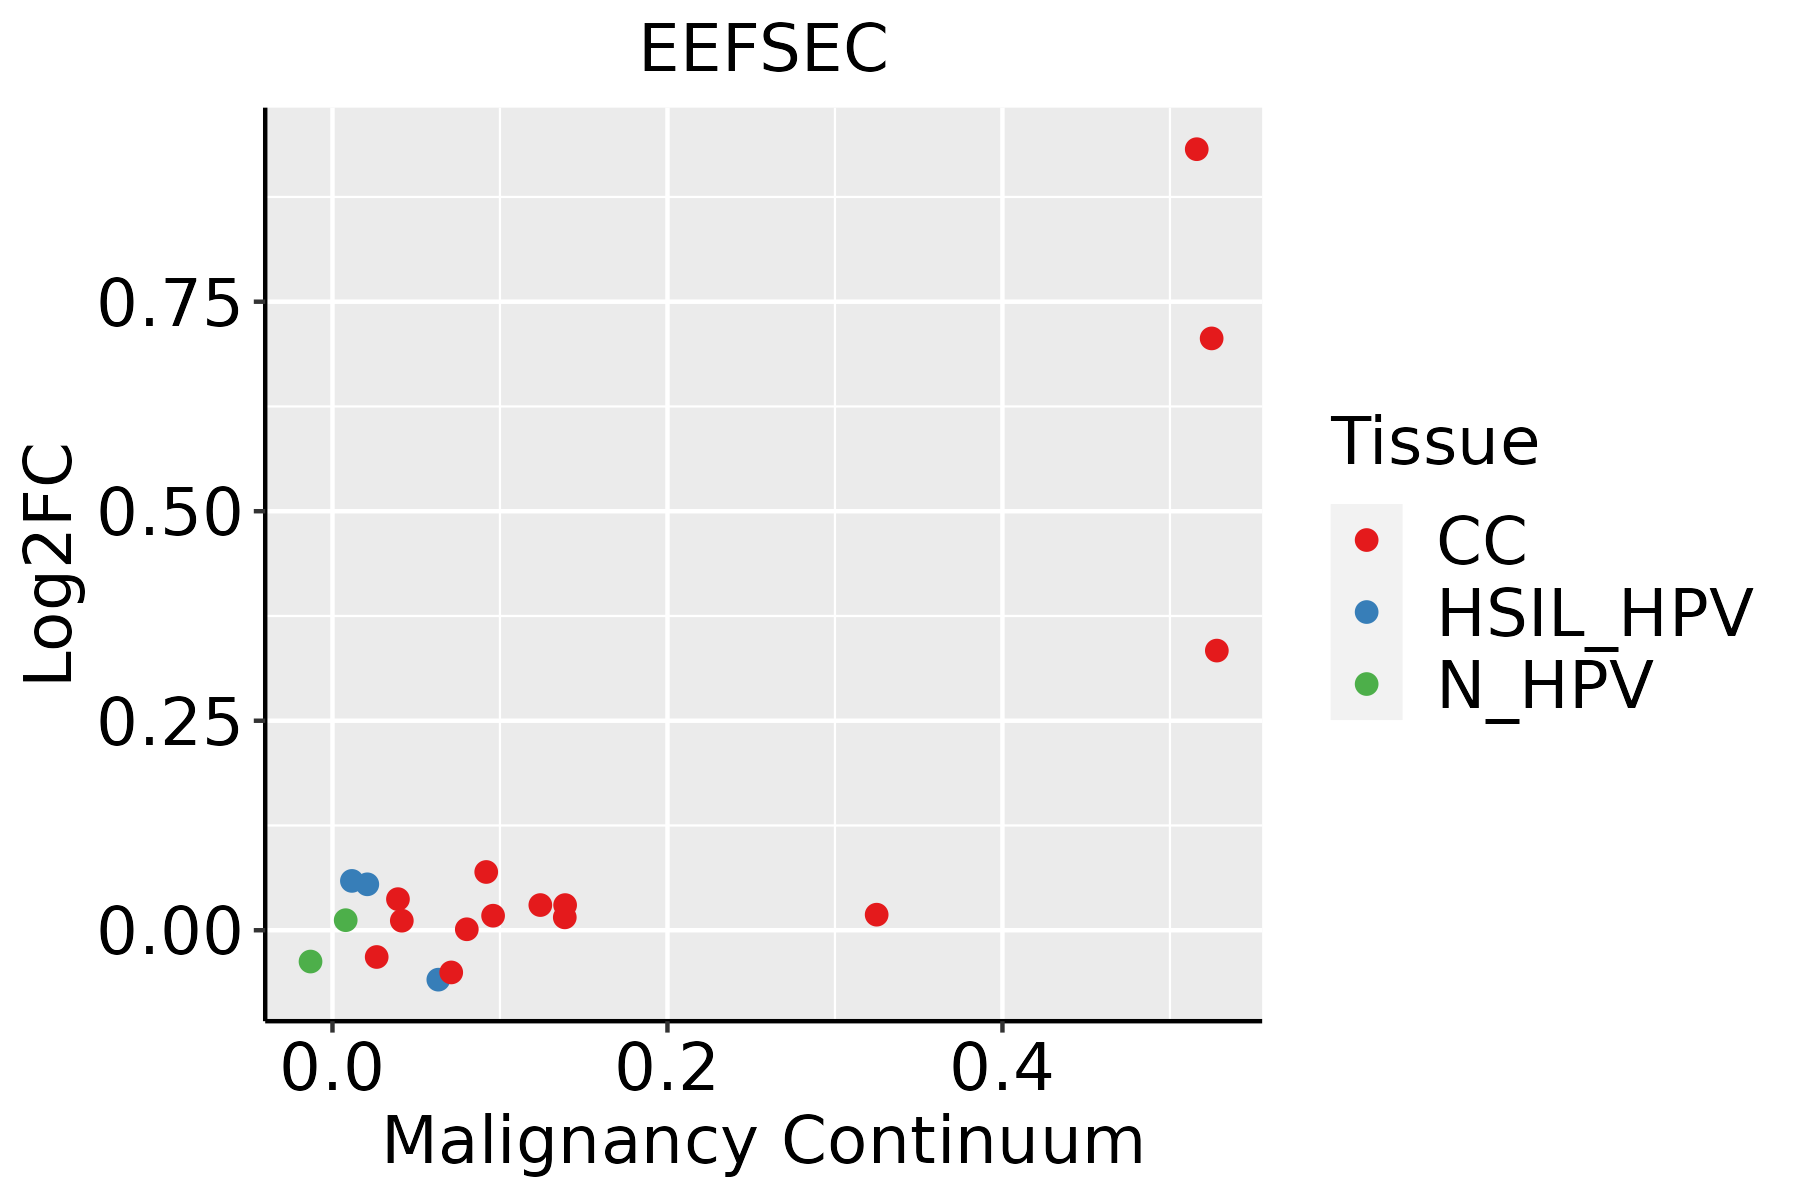 | CC: Cervix cancer |
| HSIL_HPV: HPV-infected high-grade squamous intraepithelial lesions | ||
| N_HPV: HPV-infected normal cervix | ||
| Esophagus |  | ESCC: Esophageal squamous cell carcinoma |
| HGIN: High-grade intraepithelial neoplasias | ||
| LGIN: Low-grade intraepithelial neoplasias | ||
| Liver | 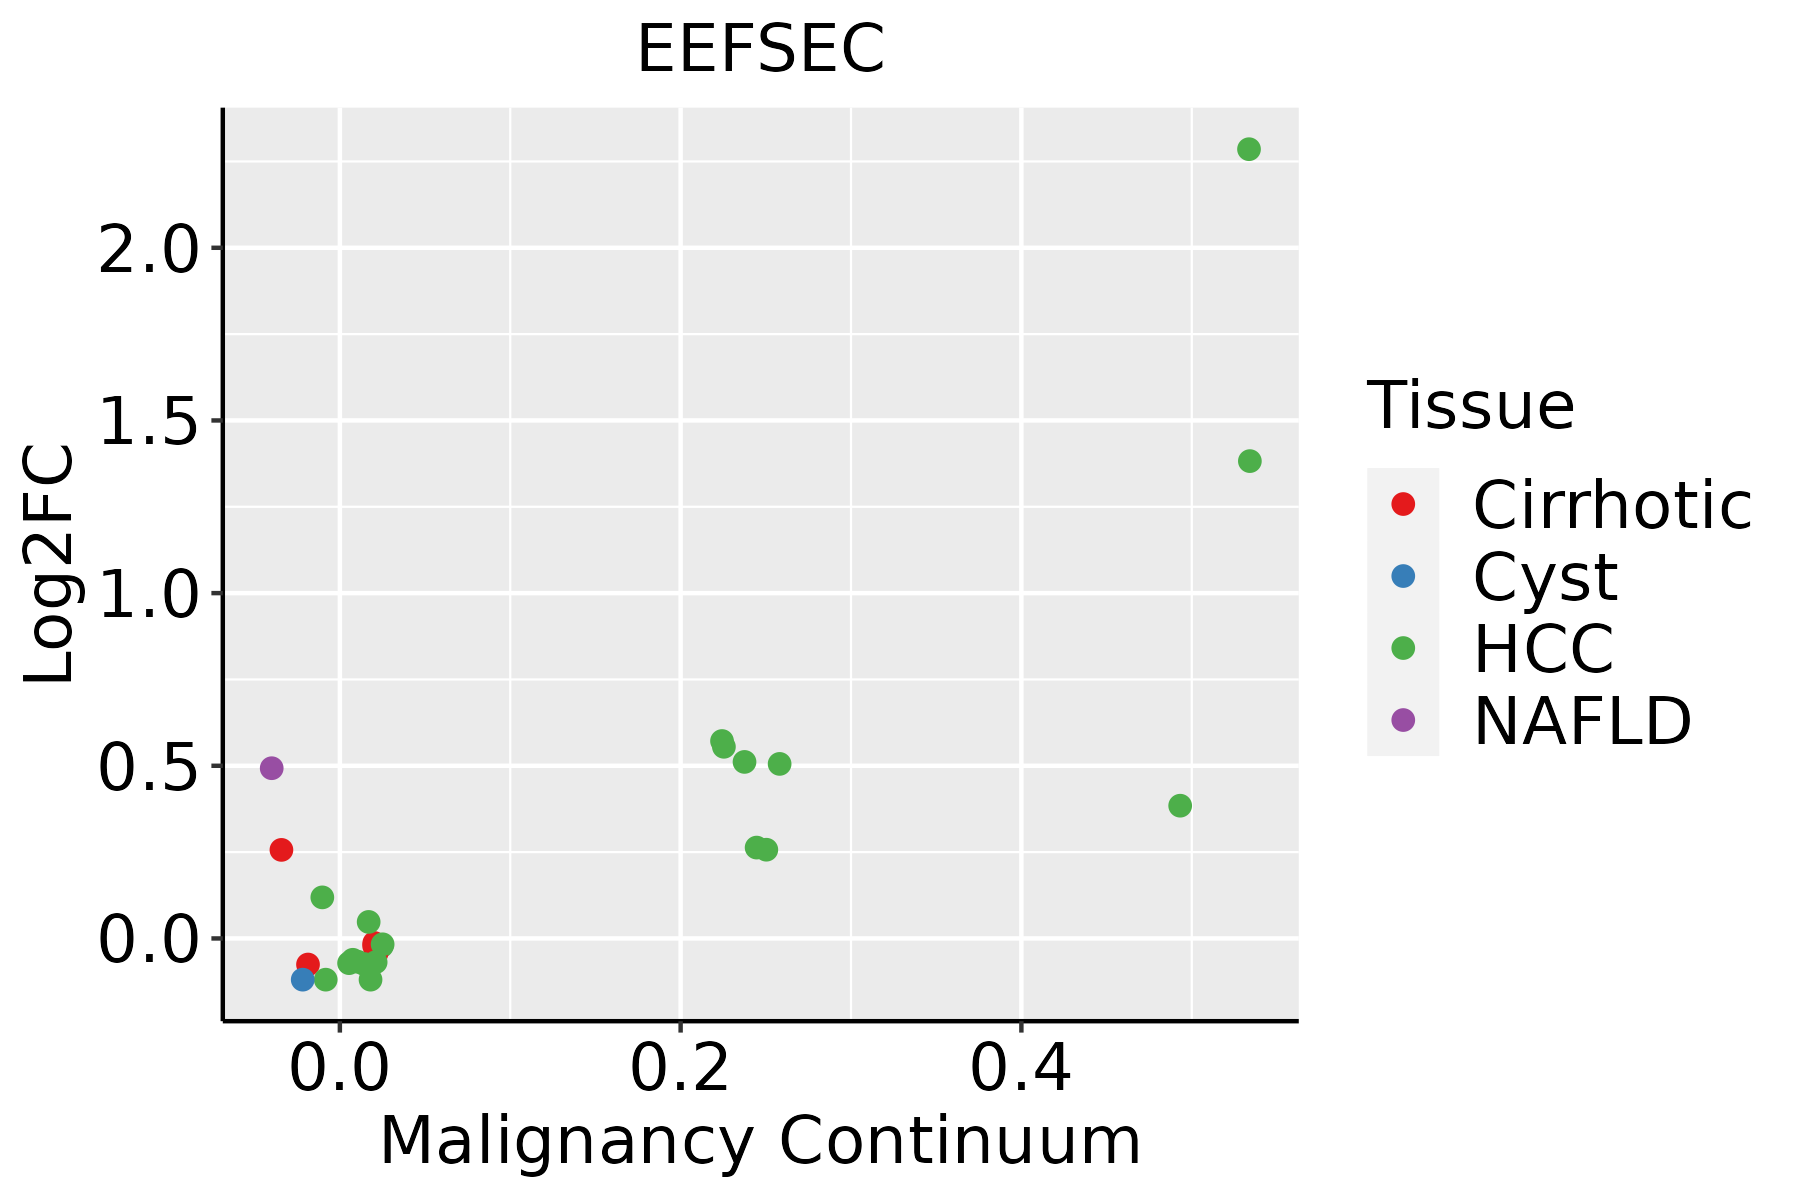 | HCC: Hepatocellular carcinoma |
| NAFLD: Non-alcoholic fatty liver disease | ||
| Oral Cavity |  | EOLP: Erosive Oral lichen planus |
| LP: leukoplakia | ||
| NEOLP: Non-erosive oral lichen planus | ||
| OSCC: Oral squamous cell carcinoma |
| ∗log2FC in expression of this searched gene in stem-like cells from each diseased tissue sample relative to stem-like cells in normal samples in each tissue plotted against the malignancy continuum. Samples are colored based on if they are from different disease stage. |
Top |
Malignant transformation related pathway analysis |
| Find out the enriched GO biological processes and KEGG pathways involved in transition from healthy to precancer to cancer |
| Tissue | Disease Stage | Enriched GO biological Processes |
| Colorectum | AD |  |
| Colorectum | SER |  |
| Colorectum | MSS |  |
| Colorectum | MSI-H |  |
| Colorectum | FAP |  |
| ∗Top 15 enriched GO BP terms are showed in the bar plot of each disease state in each tissue. Each row represents a significant GO biological process which is colored according to the -log10(p.adjust). |
| Page: 1 2 3 4 5 6 7 8 9 |
| GO ID | Tissue | Disease Stage | Description | Gene Ratio | Bg Ratio | pvalue | p.adjust | Count |
| GO:000641710 | Cervix | CC | regulation of translation | 89/2311 | 468/18723 | 1.86e-05 | 3.46e-04 | 89 |
| GO:0006417111 | Esophagus | ESCC | regulation of translation | 304/8552 | 468/18723 | 1.53e-17 | 1.33e-15 | 304 |
| GO:000641419 | Esophagus | ESCC | translational elongation | 41/8552 | 55/18723 | 1.26e-05 | 1.16e-04 | 41 |
| GO:00064177 | Liver | NAFLD | regulation of translation | 85/1882 | 468/18723 | 4.58e-08 | 4.54e-06 | 85 |
| GO:00064145 | Liver | NAFLD | translational elongation | 16/1882 | 55/18723 | 6.71e-05 | 1.44e-03 | 16 |
| GO:000641722 | Liver | HCC | regulation of translation | 287/7958 | 468/18723 | 8.79e-17 | 8.08e-15 | 287 |
| GO:000641412 | Liver | HCC | translational elongation | 36/7958 | 55/18723 | 4.94e-04 | 3.23e-03 | 36 |
| GO:000641720 | Oral cavity | OSCC | regulation of translation | 274/7305 | 468/18723 | 4.39e-18 | 4.63e-16 | 274 |
| GO:000641416 | Oral cavity | OSCC | translational elongation | 37/7305 | 55/18723 | 2.03e-05 | 1.94e-04 | 37 |
| GO:0006417110 | Oral cavity | LP | regulation of translation | 175/4623 | 468/18723 | 4.49e-10 | 2.22e-08 | 175 |
| GO:000641417 | Oral cavity | LP | translational elongation | 25/4623 | 55/18723 | 6.27e-04 | 5.71e-03 | 25 |
| Page: 1 |
| Pathway ID | Tissue | Disease Stage | Description | Gene Ratio | Bg Ratio | pvalue | p.adjust | qvalue | Count |
| Page: 1 |
Top |
Cell-cell communication analysis |
| Identification of potential cell-cell interactions between two cell types and their ligand-receptor pairs for different disease states |
| Ligand | Receptor | LRpair | Pathway | Tissue | Disease Stage |
| Page: 1 |
Top |
Single-cell gene regulatory network inference analysis |
| Find out the significant the regulons (TFs) and the target genes of each regulon across cell types for different disease states |
| TF | Cell Type | Tissue | Disease Stage | Target Gene | RSS | Regulon Activity |
| ∗The dot plots of a searched regulon are shown for all cell subpopulations in each disease state of each tissue based on the regulon specific score inferred using pySCENIC and by calculating the average expression. |
| Page: 1 |
Top |
Somatic mutation of malignant transformation related genes |
| Annotation of somatic variants for genes involved in malignant transformation |
| Hugo Symbol | Variant Class | Variant Classification | dbSNP RS | HGVSc | HGVSp | HGVSp Short | SWISSPROT | BIOTYPE | SIFT | PolyPhen | Tumor Sample Barcode | Tissue | Histology | Sex | Age | Stage | Therapy Types | Drugs | Outcome |
| EEFSEC | SNV | Missense_Mutation | c.686N>C | p.Asp229Ala | p.D229A | P57772 | protein_coding | deleterious(0) | probably_damaging(1) | TCGA-A8-A08H-01 | Breast | breast invasive carcinoma | Female | >=65 | I/II | Unknown | Unknown | SD | |
| EEFSEC | SNV | Missense_Mutation | rs528203343 | c.583N>A | p.Glu195Lys | p.E195K | P57772 | protein_coding | tolerated(0.27) | benign(0.281) | TCGA-AN-A046-01 | Breast | breast invasive carcinoma | Female | >=65 | I/II | Unknown | Unknown | SD |
| EEFSEC | SNV | Missense_Mutation | c.819C>A | p.Phe273Leu | p.F273L | P57772 | protein_coding | deleterious(0) | probably_damaging(1) | TCGA-AR-A1AY-01 | Breast | breast invasive carcinoma | Female | >=65 | I/II | Unspecific | Doxorubicin | SD | |
| EEFSEC | SNV | Missense_Mutation | novel | c.1169N>G | p.Asp390Gly | p.D390G | P57772 | protein_coding | tolerated(0.24) | benign(0) | TCGA-AA-3877-01 | Colorectum | colon adenocarcinoma | Female | >=65 | I/II | Unknown | Unknown | SD |
| EEFSEC | SNV | Missense_Mutation | c.779C>A | p.Ala260Asp | p.A260D | P57772 | protein_coding | tolerated(0.16) | possibly_damaging(0.716) | TCGA-AA-3952-01 | Colorectum | colon adenocarcinoma | Male | >=65 | III/IV | Unknown | Unknown | PD | |
| EEFSEC | SNV | Missense_Mutation | c.495N>T | p.Lys165Asn | p.K165N | P57772 | protein_coding | deleterious(0) | benign(0.363) | TCGA-AA-A00N-01 | Colorectum | colon adenocarcinoma | Male | >=65 | I/II | Unknown | Unknown | PD | |
| EEFSEC | SNV | Missense_Mutation | c.963N>T | p.Lys321Asn | p.K321N | P57772 | protein_coding | deleterious(0) | probably_damaging(0.989) | TCGA-AA-A00N-01 | Colorectum | colon adenocarcinoma | Male | >=65 | I/II | Unknown | Unknown | PD | |
| EEFSEC | SNV | Missense_Mutation | c.490A>G | p.Thr164Ala | p.T164A | P57772 | protein_coding | tolerated(0.1) | benign(0.159) | TCGA-AA-A010-01 | Colorectum | colon adenocarcinoma | Female | <65 | I/II | Chemotherapy | folinic | CR | |
| EEFSEC | SNV | Missense_Mutation | novel | c.1259N>G | p.Val420Gly | p.V420G | P57772 | protein_coding | deleterious(0) | probably_damaging(0.915) | TCGA-AZ-4315-01 | Colorectum | colon adenocarcinoma | Male | <65 | I/II | Unknown | Unknown | SD |
| EEFSEC | SNV | Missense_Mutation | c.966N>G | p.Ile322Met | p.I322M | P57772 | protein_coding | deleterious(0) | probably_damaging(0.981) | TCGA-CM-5861-01 | Colorectum | colon adenocarcinoma | Female | <65 | I/II | Unknown | Unknown | PD |
| Page: 1 2 3 4 5 6 |
Top |
Related drugs of malignant transformation related genes |
| Identification of chemicals and drugs interact with genes involved in malignant transfromation |
| (DGIdb 4.0) |
| Entrez ID | Symbol | Category | Interaction Types | Drug Claim Name | Drug Name | PMIDs |
| Page: 1 |

Copyright 2023-Present -The University of Texas Health Science Center at Houston |