
|
|||||
|
 | |
| |
| |
| |
| |
| |
|
Gene: EEF2K |
Gene summary for EEF2K |
| Gene information | Species | Human | Gene symbol | EEF2K | Gene ID | 29904 |
| Gene name | eukaryotic elongation factor 2 kinase | |
| Gene Alias | CaMKIII | |
| Cytomap | 16p12.2 | |
| Gene Type | protein-coding | GO ID | GO:0000902 | UniProtAcc | O00418 |
Top |
Malignant transformation analysis |
| Identification of the aberrant gene expression in precancerous and cancerous lesions by comparing the gene expression of stem-like cells in diseased tissues with normal stem cells |
| Entrez ID | Symbol | Replicates | Species | Organ | Tissue | Adj P-value | Log2FC | Malignancy |
| 29904 | EEF2K | HTA11_2487_2000001011 | Human | Colorectum | SER | 4.85e-03 | 3.51e-01 | -0.1808 |
| 29904 | EEF2K | HTA11_347_2000001011 | Human | Colorectum | AD | 1.47e-08 | 3.85e-01 | -0.1954 |
| 29904 | EEF2K | HTA11_3361_2000001011 | Human | Colorectum | AD | 1.46e-03 | 4.21e-01 | -0.1207 |
| 29904 | EEF2K | HTA11_1391_2000001011 | Human | Colorectum | AD | 4.10e-02 | 2.98e-01 | -0.059 |
| 29904 | EEF2K | A015-C-203 | Human | Colorectum | FAP | 9.23e-05 | -1.08e-01 | -0.1294 |
| 29904 | EEF2K | A002-C-201 | Human | Colorectum | FAP | 2.64e-02 | -2.10e-01 | 0.0324 |
| 29904 | EEF2K | A001-C-108 | Human | Colorectum | FAP | 1.66e-02 | -1.08e-01 | -0.0272 |
| 29904 | EEF2K | A002-C-205 | Human | Colorectum | FAP | 7.40e-03 | -1.97e-01 | -0.1236 |
| 29904 | EEF2K | A015-C-104 | Human | Colorectum | FAP | 4.54e-06 | -7.85e-02 | -0.1899 |
| 29904 | EEF2K | A002-C-016 | Human | Colorectum | FAP | 5.14e-03 | -1.64e-01 | 0.0521 |
| 29904 | EEF2K | A001-C-203 | Human | Colorectum | FAP | 1.46e-02 | -5.35e-02 | -0.0481 |
| 29904 | EEF2K | A002-C-116 | Human | Colorectum | FAP | 1.83e-06 | -1.42e-01 | -0.0452 |
| 29904 | EEF2K | F034 | Human | Colorectum | FAP | 2.69e-05 | -1.44e-01 | -0.0665 |
| 29904 | EEF2K | LZE24T | Human | Esophagus | ESCC | 1.33e-02 | 9.43e-02 | 0.0596 |
| 29904 | EEF2K | P1T-E | Human | Esophagus | ESCC | 7.71e-12 | 4.18e-01 | 0.0875 |
| 29904 | EEF2K | P2T-E | Human | Esophagus | ESCC | 1.65e-27 | 5.84e-01 | 0.1177 |
| 29904 | EEF2K | P4T-E | Human | Esophagus | ESCC | 3.89e-11 | 2.27e-01 | 0.1323 |
| 29904 | EEF2K | P5T-E | Human | Esophagus | ESCC | 5.48e-14 | 9.86e-02 | 0.1327 |
| 29904 | EEF2K | P8T-E | Human | Esophagus | ESCC | 2.38e-15 | 2.75e-01 | 0.0889 |
| 29904 | EEF2K | P9T-E | Human | Esophagus | ESCC | 1.30e-08 | 8.60e-02 | 0.1131 |
| Page: 1 2 3 4 5 6 |
| Tissue | Expression Dynamics | Abbreviation |
| Colorectum (GSE201348) |  | FAP: Familial adenomatous polyposis |
| CRC: Colorectal cancer | ||
| Colorectum (HTA11) |  | AD: Adenomas |
| SER: Sessile serrated lesions | ||
| MSI-H: Microsatellite-high colorectal cancer | ||
| MSS: Microsatellite stable colorectal cancer | ||
| Esophagus |  | ESCC: Esophageal squamous cell carcinoma |
| HGIN: High-grade intraepithelial neoplasias | ||
| LGIN: Low-grade intraepithelial neoplasias | ||
| Liver | 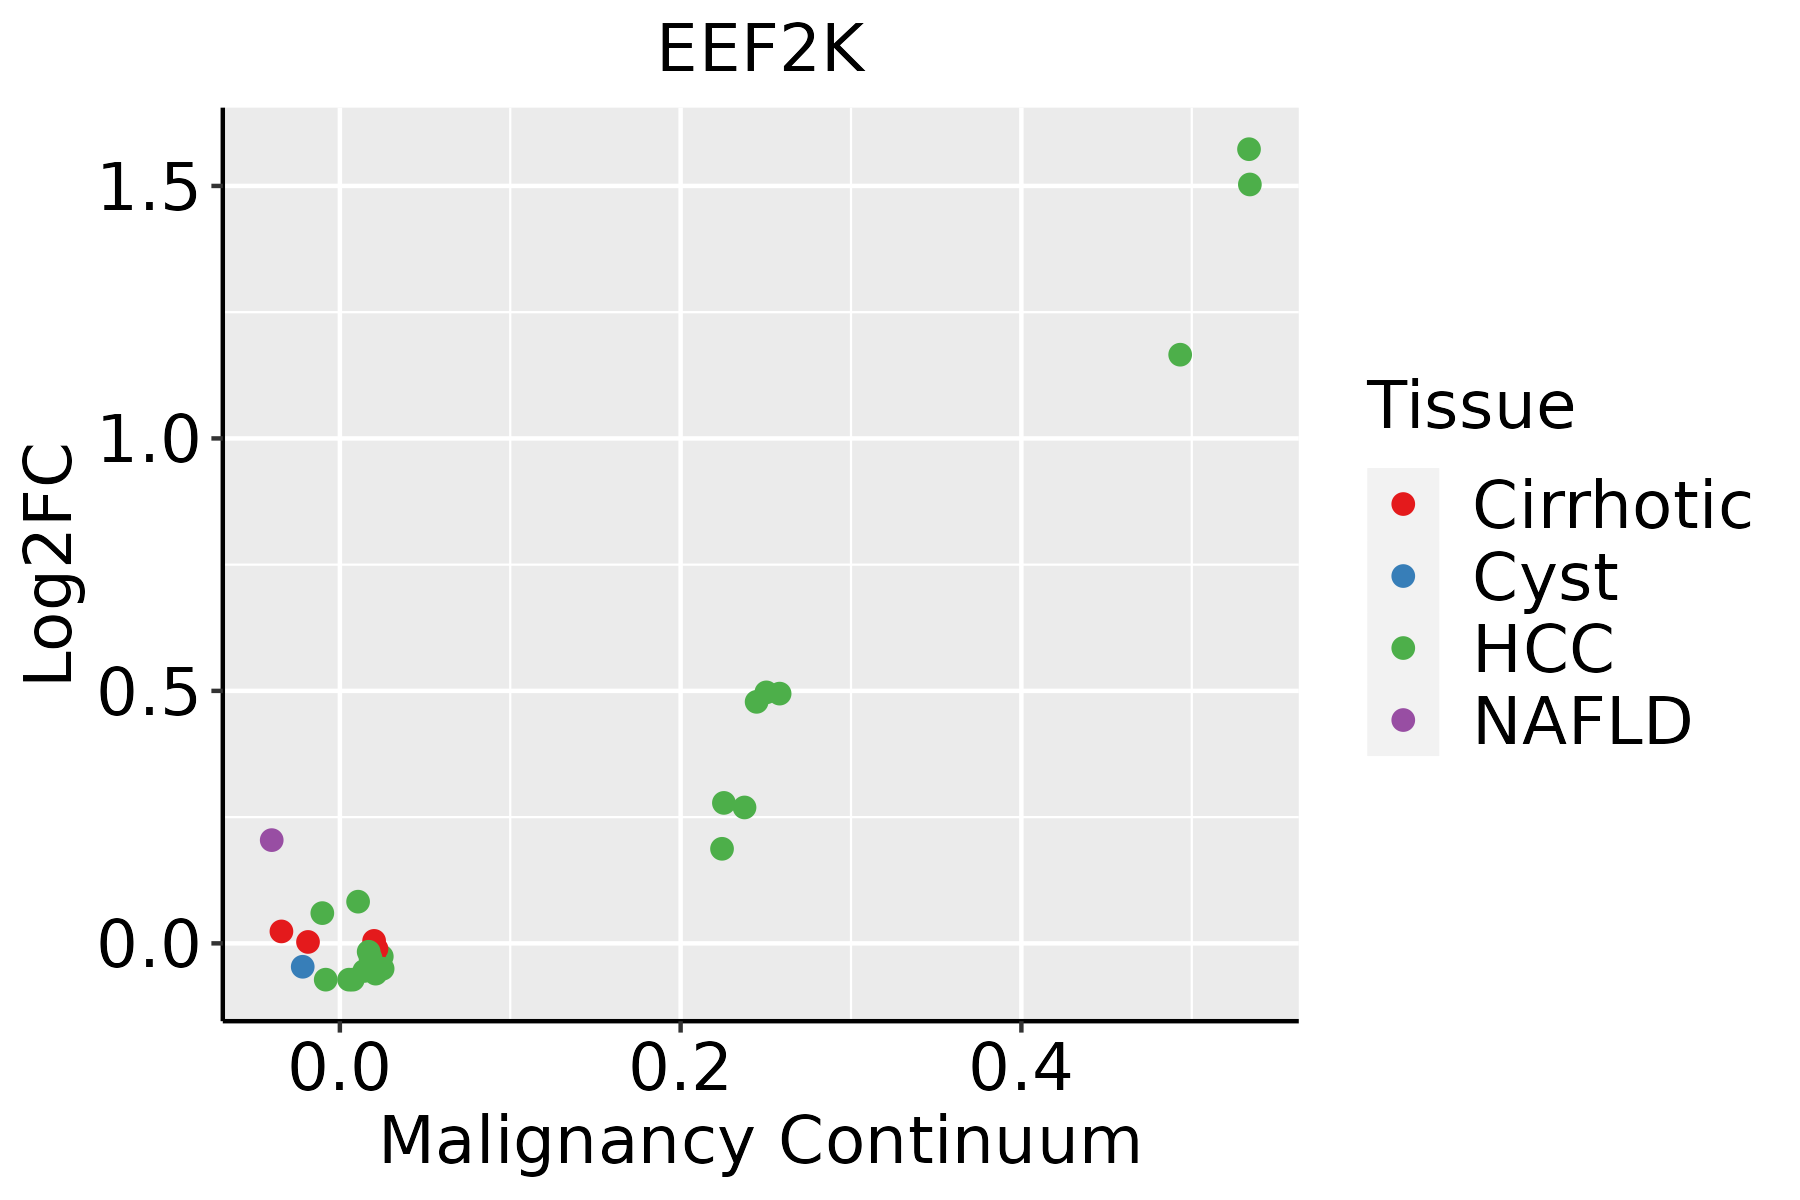 | HCC: Hepatocellular carcinoma |
| NAFLD: Non-alcoholic fatty liver disease | ||
| Prostate | 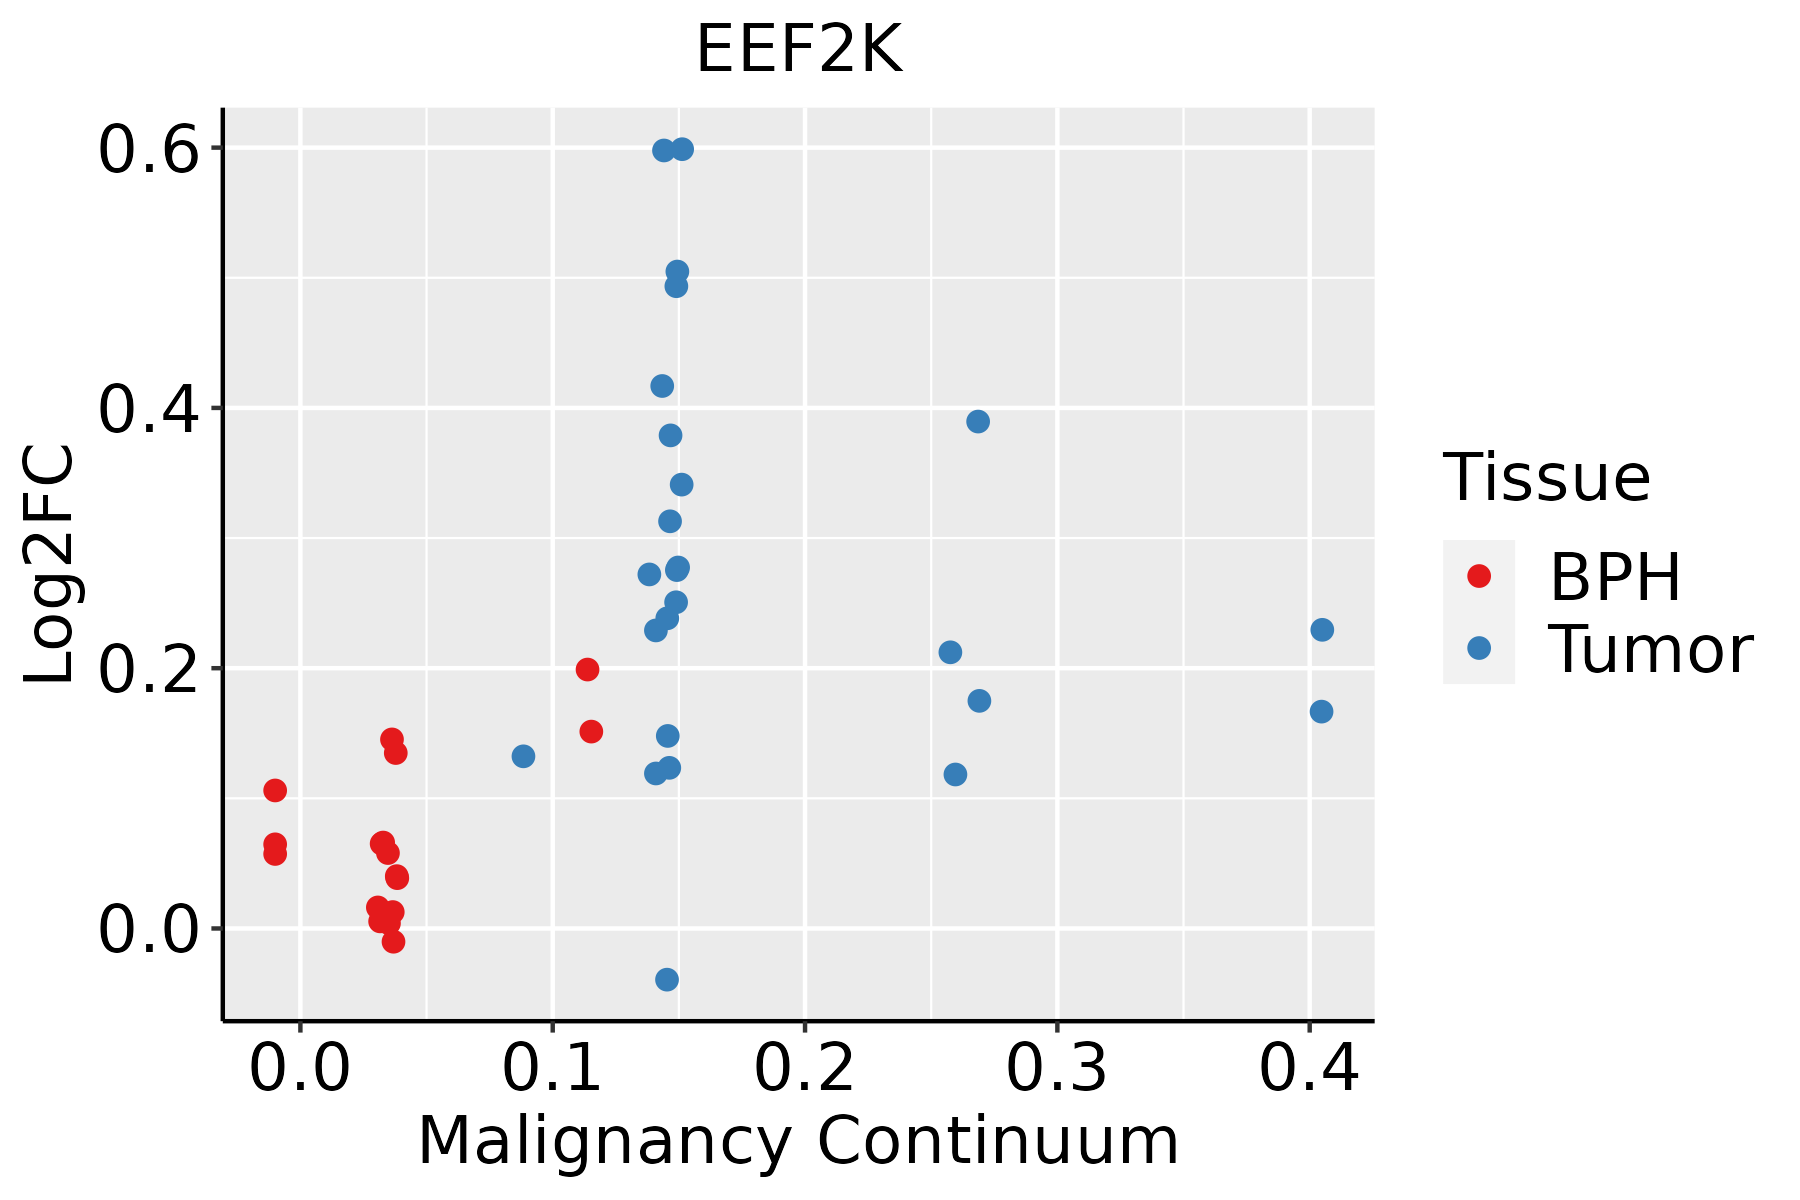 | BPH: Benign Prostatic Hyperplasia |
| Skin |  | AK: Actinic keratosis |
| cSCC: Cutaneous squamous cell carcinoma | ||
| SCCIS:squamous cell carcinoma in situ | ||
| Thyroid |  | ATC: Anaplastic thyroid cancer |
| HT: Hashimoto's thyroiditis | ||
| PTC: Papillary thyroid cancer |
| ∗log2FC in expression of this searched gene in stem-like cells from each diseased tissue sample relative to stem-like cells in normal samples in each tissue plotted against the malignancy continuum. Samples are colored based on if they are from different disease stage. |
Top |
Malignant transformation related pathway analysis |
| Find out the enriched GO biological processes and KEGG pathways involved in transition from healthy to precancer to cancer |
| Tissue | Disease Stage | Enriched GO biological Processes |
| Colorectum | AD |  |
| Colorectum | SER |  |
| Colorectum | MSS |  |
| Colorectum | MSI-H |  |
| Colorectum | FAP |  |
| ∗Top 15 enriched GO BP terms are showed in the bar plot of each disease state in each tissue. Each row represents a significant GO biological process which is colored according to the -log10(p.adjust). |
| Page: 1 2 3 4 5 6 7 8 9 |
| GO ID | Tissue | Disease Stage | Description | Gene Ratio | Bg Ratio | pvalue | p.adjust | Count |
| GO:0022604 | Colorectum | AD | regulation of cell morphogenesis | 109/3918 | 309/18723 | 3.08e-09 | 2.07e-07 | 109 |
| GO:0034329 | Colorectum | AD | cell junction assembly | 136/3918 | 420/18723 | 2.02e-08 | 1.15e-06 | 136 |
| GO:0032868 | Colorectum | AD | response to insulin | 91/3918 | 264/18723 | 2.02e-07 | 8.48e-06 | 91 |
| GO:1901653 | Colorectum | AD | cellular response to peptide | 114/3918 | 359/18723 | 8.32e-07 | 2.88e-05 | 114 |
| GO:0032869 | Colorectum | AD | cellular response to insulin stimulus | 72/3918 | 203/18723 | 1.10e-06 | 3.68e-05 | 72 |
| GO:0071375 | Colorectum | AD | cellular response to peptide hormone stimulus | 95/3918 | 290/18723 | 1.50e-06 | 4.66e-05 | 95 |
| GO:0043434 | Colorectum | AD | response to peptide hormone | 126/3918 | 414/18723 | 2.70e-06 | 7.86e-05 | 126 |
| GO:1990090 | Colorectum | AD | cellular response to nerve growth factor stimulus | 26/3918 | 53/18723 | 4.87e-06 | 1.28e-04 | 26 |
| GO:1990089 | Colorectum | AD | response to nerve growth factor | 26/3918 | 56/18723 | 1.71e-05 | 3.59e-04 | 26 |
| GO:0046777 | Colorectum | AD | protein autophosphorylation | 74/3918 | 227/18723 | 2.48e-05 | 4.76e-04 | 74 |
| GO:0010975 | Colorectum | AD | regulation of neuron projection development | 129/3918 | 445/18723 | 2.88e-05 | 5.37e-04 | 129 |
| GO:0106027 | Colorectum | AD | neuron projection organization | 36/3918 | 93/18723 | 6.58e-05 | 1.07e-03 | 36 |
| GO:0031346 | Colorectum | AD | positive regulation of cell projection organization | 104/3918 | 353/18723 | 8.26e-05 | 1.30e-03 | 104 |
| GO:0030100 | Colorectum | AD | regulation of endocytosis | 67/3918 | 211/18723 | 1.42e-04 | 2.01e-03 | 67 |
| GO:0010038 | Colorectum | AD | response to metal ion | 106/3918 | 373/18723 | 3.22e-04 | 3.83e-03 | 106 |
| GO:0010769 | Colorectum | AD | regulation of cell morphogenesis involved in differentiation | 35/3918 | 96/18723 | 3.26e-04 | 3.85e-03 | 35 |
| GO:0010770 | Colorectum | AD | positive regulation of cell morphogenesis involved in differentiation | 30/3918 | 79/18723 | 3.81e-04 | 4.38e-03 | 30 |
| GO:0010720 | Colorectum | AD | positive regulation of cell development | 87/3918 | 298/18723 | 4.17e-04 | 4.71e-03 | 87 |
| GO:0070482 | Colorectum | AD | response to oxygen levels | 99/3918 | 347/18723 | 4.29e-04 | 4.82e-03 | 99 |
| GO:0097061 | Colorectum | AD | dendritic spine organization | 31/3918 | 84/18723 | 5.48e-04 | 5.83e-03 | 31 |
| Page: 1 2 3 4 5 6 7 8 9 10 11 12 13 14 15 16 17 18 19 20 21 22 23 24 25 |
| Pathway ID | Tissue | Disease Stage | Description | Gene Ratio | Bg Ratio | pvalue | p.adjust | qvalue | Count |
| hsa04152 | Colorectum | AD | AMPK signaling pathway | 47/2092 | 121/8465 | 3.74e-04 | 2.82e-03 | 1.80e-03 | 47 |
| hsa041521 | Colorectum | AD | AMPK signaling pathway | 47/2092 | 121/8465 | 3.74e-04 | 2.82e-03 | 1.80e-03 | 47 |
| hsa041524 | Colorectum | FAP | AMPK signaling pathway | 37/1404 | 121/8465 | 8.97e-05 | 8.56e-04 | 5.21e-04 | 37 |
| hsa041525 | Colorectum | FAP | AMPK signaling pathway | 37/1404 | 121/8465 | 8.97e-05 | 8.56e-04 | 5.21e-04 | 37 |
| hsa0415210 | Esophagus | ESCC | AMPK signaling pathway | 80/4205 | 121/8465 | 1.73e-04 | 6.67e-04 | 3.42e-04 | 80 |
| hsa0415213 | Esophagus | ESCC | AMPK signaling pathway | 80/4205 | 121/8465 | 1.73e-04 | 6.67e-04 | 3.42e-04 | 80 |
| hsa0415241 | Liver | HCC | AMPK signaling pathway | 77/4020 | 121/8465 | 2.32e-04 | 1.11e-03 | 6.18e-04 | 77 |
| hsa0415251 | Liver | HCC | AMPK signaling pathway | 77/4020 | 121/8465 | 2.32e-04 | 1.11e-03 | 6.18e-04 | 77 |
| Page: 1 |
Top |
Cell-cell communication analysis |
| Identification of potential cell-cell interactions between two cell types and their ligand-receptor pairs for different disease states |
| Ligand | Receptor | LRpair | Pathway | Tissue | Disease Stage |
| Page: 1 |
Top |
Single-cell gene regulatory network inference analysis |
| Find out the significant the regulons (TFs) and the target genes of each regulon across cell types for different disease states |
| TF | Cell Type | Tissue | Disease Stage | Target Gene | RSS | Regulon Activity |
| ∗The dot plots of a searched regulon are shown for all cell subpopulations in each disease state of each tissue based on the regulon specific score inferred using pySCENIC and by calculating the average expression. |
| Page: 1 |
Top |
Somatic mutation of malignant transformation related genes |
| Annotation of somatic variants for genes involved in malignant transformation |
| Hugo Symbol | Variant Class | Variant Classification | dbSNP RS | HGVSc | HGVSp | HGVSp Short | SWISSPROT | BIOTYPE | SIFT | PolyPhen | Tumor Sample Barcode | Tissue | Histology | Sex | Age | Stage | Therapy Types | Drugs | Outcome |
| EEF2K | SNV | Missense_Mutation | novel | c.1897G>T | p.Asp633Tyr | p.D633Y | O00418 | protein_coding | deleterious(0) | possibly_damaging(0.56) | TCGA-AN-A046-01 | Breast | breast invasive carcinoma | Female | >=65 | I/II | Unknown | Unknown | SD |
| EEF2K | SNV | Missense_Mutation | novel | c.394N>C | p.Lys132Gln | p.K132Q | O00418 | protein_coding | deleterious(0) | possibly_damaging(0.868) | TCGA-BH-A0BZ-01 | Breast | breast invasive carcinoma | Female | <65 | III/IV | Chemotherapy | doxorubicin | CR |
| EEF2K | SNV | Missense_Mutation | novel | c.1139N>G | p.Ser380Cys | p.S380C | O00418 | protein_coding | deleterious(0) | probably_damaging(0.922) | TCGA-BH-A0HF-01 | Breast | breast invasive carcinoma | Female | >=65 | I/II | Hormone Therapy | arimidex | SD |
| EEF2K | SNV | Missense_Mutation | rs555655059 | c.443N>A | p.Arg148Gln | p.R148Q | O00418 | protein_coding | deleterious(0) | probably_damaging(0.973) | TCGA-BH-A1F6-01 | Breast | breast invasive carcinoma | Female | <65 | III/IV | Unknown | Unknown | SD |
| EEF2K | SNV | Missense_Mutation | novel | c.1898A>G | p.Asp633Gly | p.D633G | O00418 | protein_coding | deleterious(0.02) | benign(0.062) | TCGA-S3-AA0Z-01 | Breast | breast invasive carcinoma | Female | <65 | I/II | Ancillary | neulasta | CR |
| EEF2K | insertion | Frame_Shift_Ins | novel | c.520_521insGGTCA | p.Glu174GlyfsTer5 | p.E174Gfs*5 | O00418 | protein_coding | TCGA-A8-A079-01 | Breast | breast invasive carcinoma | Female | >=65 | III/IV | Chemotherapy | 5-fluorouracil | SD | ||
| EEF2K | insertion | Nonsense_Mutation | novel | c.522_523insGGAAATGGGATAGGAGACCTTTAACAGTGACCTTTAAT | p.Pro175GlyfsTer8 | p.P175Gfs*8 | O00418 | protein_coding | TCGA-A8-A079-01 | Breast | breast invasive carcinoma | Female | >=65 | III/IV | Chemotherapy | 5-fluorouracil | SD | ||
| EEF2K | insertion | Frame_Shift_Ins | novel | c.52_53insC | p.Arg20ProfsTer5 | p.R20Pfs*5 | O00418 | protein_coding | TCGA-BH-A0E7-01 | Breast | breast invasive carcinoma | Female | >=65 | I/II | Hormone Therapy | arimidex | SD | ||
| EEF2K | SNV | Missense_Mutation | novel | c.181A>G | p.Ser61Gly | p.S61G | O00418 | protein_coding | tolerated_low_confidence(0.14) | benign(0.024) | TCGA-2W-A8YY-01 | Cervix | cervical & endocervical cancer | Female | <65 | I/II | Chemotherapy | cisplatin | CR |
| EEF2K | SNV | Missense_Mutation | novel | c.92N>A | p.Ser31Asn | p.S31N | O00418 | protein_coding | tolerated_low_confidence(0.14) | probably_damaging(0.968) | TCGA-C5-A7X8-01 | Cervix | cervical & endocervical cancer | Female | <65 | I/II | Chemotherapy | cisplatin | SD |
| Page: 1 2 3 4 5 6 7 |
Top |
Related drugs of malignant transformation related genes |
| Identification of chemicals and drugs interact with genes involved in malignant transfromation |
| (DGIdb 4.0) |
| Entrez ID | Symbol | Category | Interaction Types | Drug Claim Name | Drug Name | PMIDs |
| 29904 | EEF2K | KINASE, SERINE THREONINE KINASE, ENZYME, DRUGGABLE GENOME | Lapatinib | LAPATINIB | ||
| 29904 | EEF2K | KINASE, SERINE THREONINE KINASE, ENZYME, DRUGGABLE GENOME | inhibitor | 252827401 |
| Page: 1 |

Copyright 2023-Present -The University of Texas Health Science Center at Houston |