
|
|||||
|
 | |
| |
| |
| |
| |
| |
|
Gene: EEF1G |
Gene summary for EEF1G |
| Gene information | Species | Human | Gene symbol | EEF1G | Gene ID | 1937 |
| Gene name | eukaryotic translation elongation factor 1 gamma | |
| Gene Alias | EF1G | |
| Cytomap | 11q12.3 | |
| Gene Type | protein-coding | GO ID | GO:0006412 | UniProtAcc | P26641 |
Top |
Malignant transformation analysis |
| Identification of the aberrant gene expression in precancerous and cancerous lesions by comparing the gene expression of stem-like cells in diseased tissues with normal stem cells |
| Entrez ID | Symbol | Replicates | Species | Organ | Tissue | Adj P-value | Log2FC | Malignancy |
| 1937 | EEF1G | sample1 | Human | Cervix | CC | 3.40e-21 | 8.87e-01 | 0.0959 |
| 1937 | EEF1G | sample3 | Human | Cervix | CC | 5.03e-91 | 1.17e+00 | 0.1387 |
| 1937 | EEF1G | H2 | Human | Cervix | HSIL_HPV | 9.91e-61 | 1.06e+00 | 0.0632 |
| 1937 | EEF1G | L1 | Human | Cervix | CC | 7.52e-36 | 1.18e+00 | 0.0802 |
| 1937 | EEF1G | T1 | Human | Cervix | CC | 2.96e-23 | 6.68e-01 | 0.0918 |
| 1937 | EEF1G | T2 | Human | Cervix | CC | 1.68e-39 | 1.42e+00 | 0.0709 |
| 1937 | EEF1G | T3 | Human | Cervix | CC | 2.25e-94 | 1.17e+00 | 0.1389 |
| 1937 | EEF1G | AEH-subject1 | Human | Endometrium | AEH | 1.73e-38 | 8.64e-01 | -0.3059 |
| 1937 | EEF1G | AEH-subject2 | Human | Endometrium | AEH | 3.95e-43 | 1.01e+00 | -0.2525 |
| 1937 | EEF1G | AEH-subject3 | Human | Endometrium | AEH | 1.50e-62 | 1.18e+00 | -0.2576 |
| 1937 | EEF1G | AEH-subject4 | Human | Endometrium | AEH | 1.09e-40 | 9.92e-01 | -0.2657 |
| 1937 | EEF1G | AEH-subject5 | Human | Endometrium | AEH | 1.38e-39 | 8.62e-01 | -0.2953 |
| 1937 | EEF1G | EEC-subject1 | Human | Endometrium | EEC | 5.68e-62 | 1.22e+00 | -0.2682 |
| 1937 | EEF1G | EEC-subject2 | Human | Endometrium | EEC | 1.64e-55 | 1.04e+00 | -0.2607 |
| 1937 | EEF1G | EEC-subject3 | Human | Endometrium | EEC | 2.97e-42 | 1.18e+00 | -0.2525 |
| 1937 | EEF1G | EEC-subject4 | Human | Endometrium | EEC | 2.32e-63 | 1.15e+00 | -0.2571 |
| 1937 | EEF1G | EEC-subject5 | Human | Endometrium | EEC | 6.01e-65 | 1.26e+00 | -0.249 |
| 1937 | EEF1G | LZE11D | Human | Esophagus | HGIN | 8.80e-08 | 7.37e-01 | -0.005 |
| 1937 | EEF1G | LZE2D | Human | Esophagus | HGIN | 2.17e-18 | 2.51e+00 | 0.0642 |
| 1937 | EEF1G | LZE2T | Human | Esophagus | ESCC | 2.21e-25 | 3.06e+00 | 0.082 |
| Page: 1 2 3 4 5 6 7 8 9 10 11 12 13 |
| Tissue | Expression Dynamics | Abbreviation |
| Cervix | 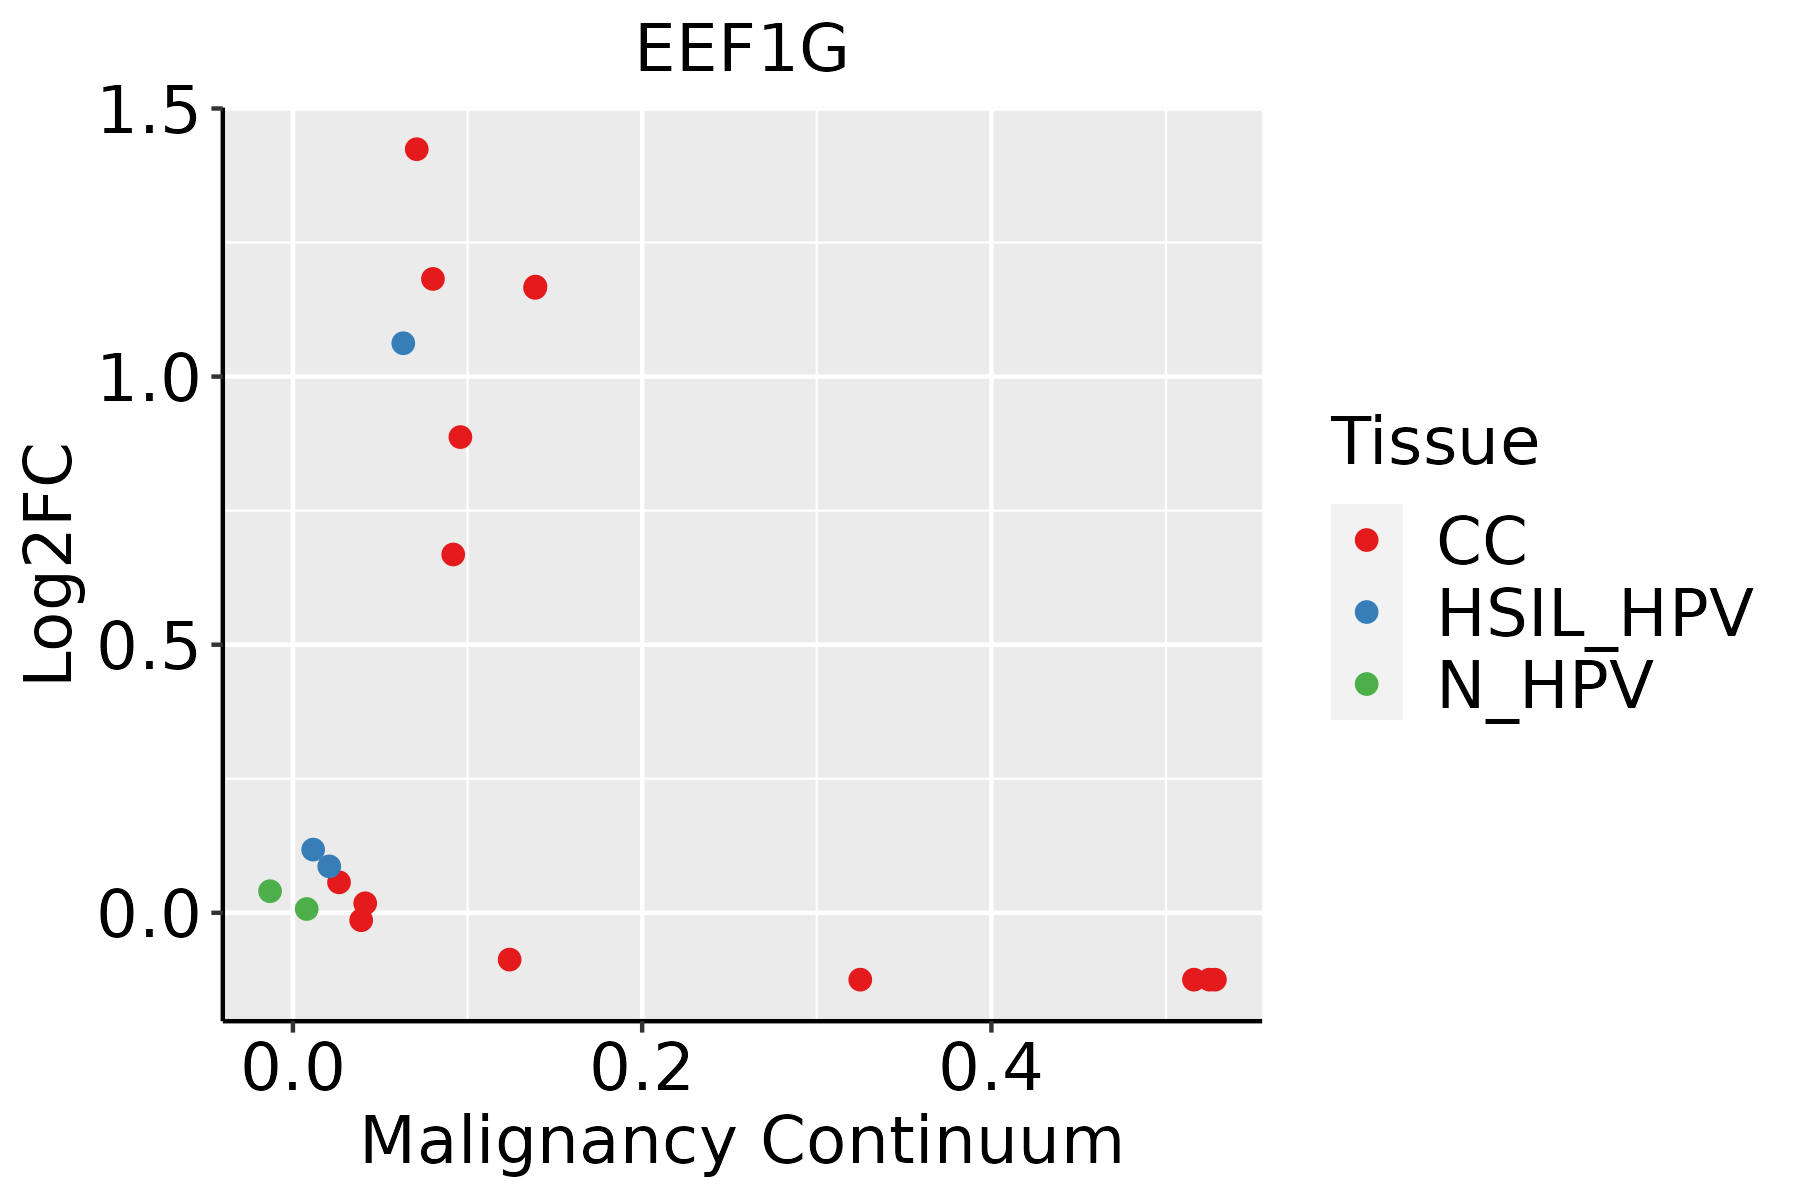 | CC: Cervix cancer |
| HSIL_HPV: HPV-infected high-grade squamous intraepithelial lesions | ||
| N_HPV: HPV-infected normal cervix | ||
| Endometrium |  | AEH: Atypical endometrial hyperplasia |
| EEC: Endometrioid Cancer | ||
| Esophagus | 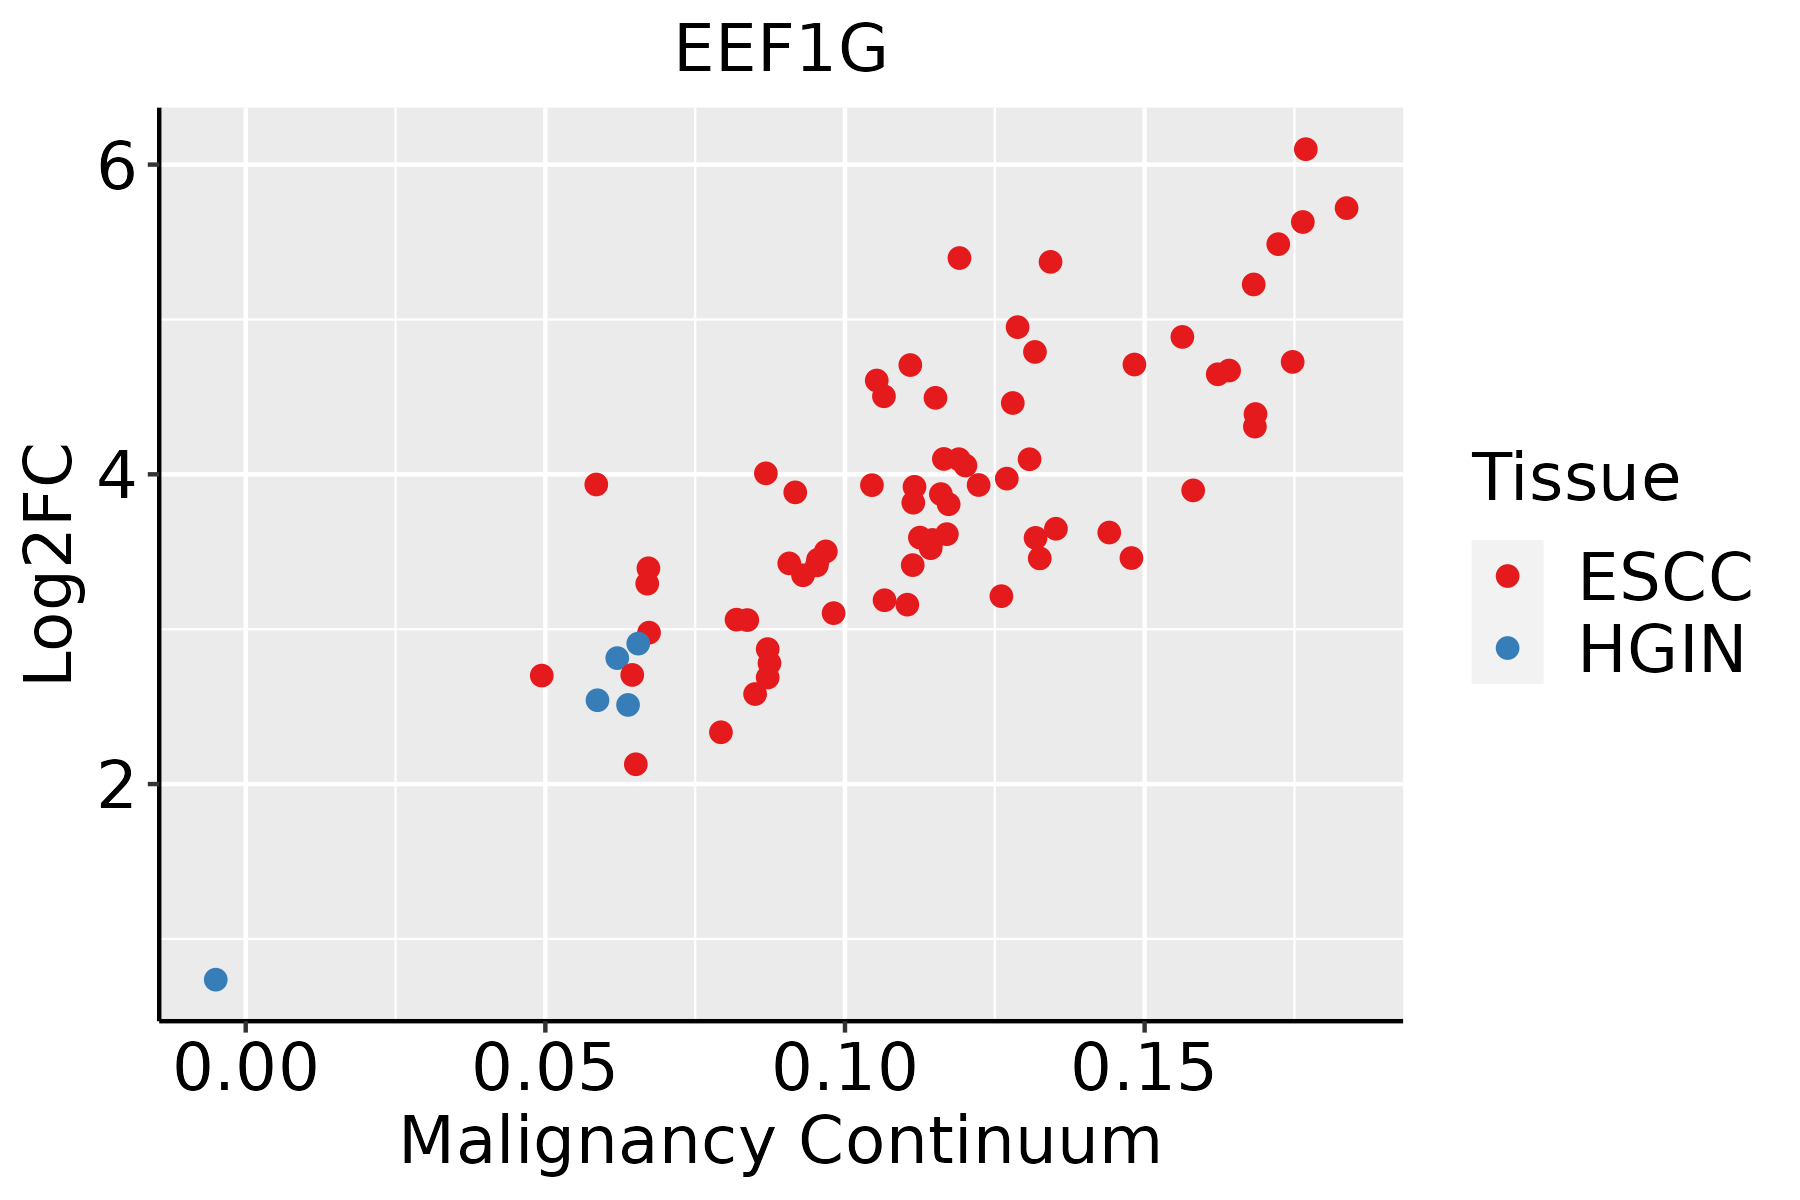 | ESCC: Esophageal squamous cell carcinoma |
| HGIN: High-grade intraepithelial neoplasias | ||
| LGIN: Low-grade intraepithelial neoplasias | ||
| GC |  | CAG: Chronic atrophic gastritis |
| CAG with IM: Chronic atrophic gastritis with intestinal metaplasia | ||
| CSG: Chronic superficial gastritis | ||
| GC: Gastric cancer | ||
| SIM: Severe intestinal metaplasia | ||
| WIM: Wild intestinal metaplasia | ||
| Liver | 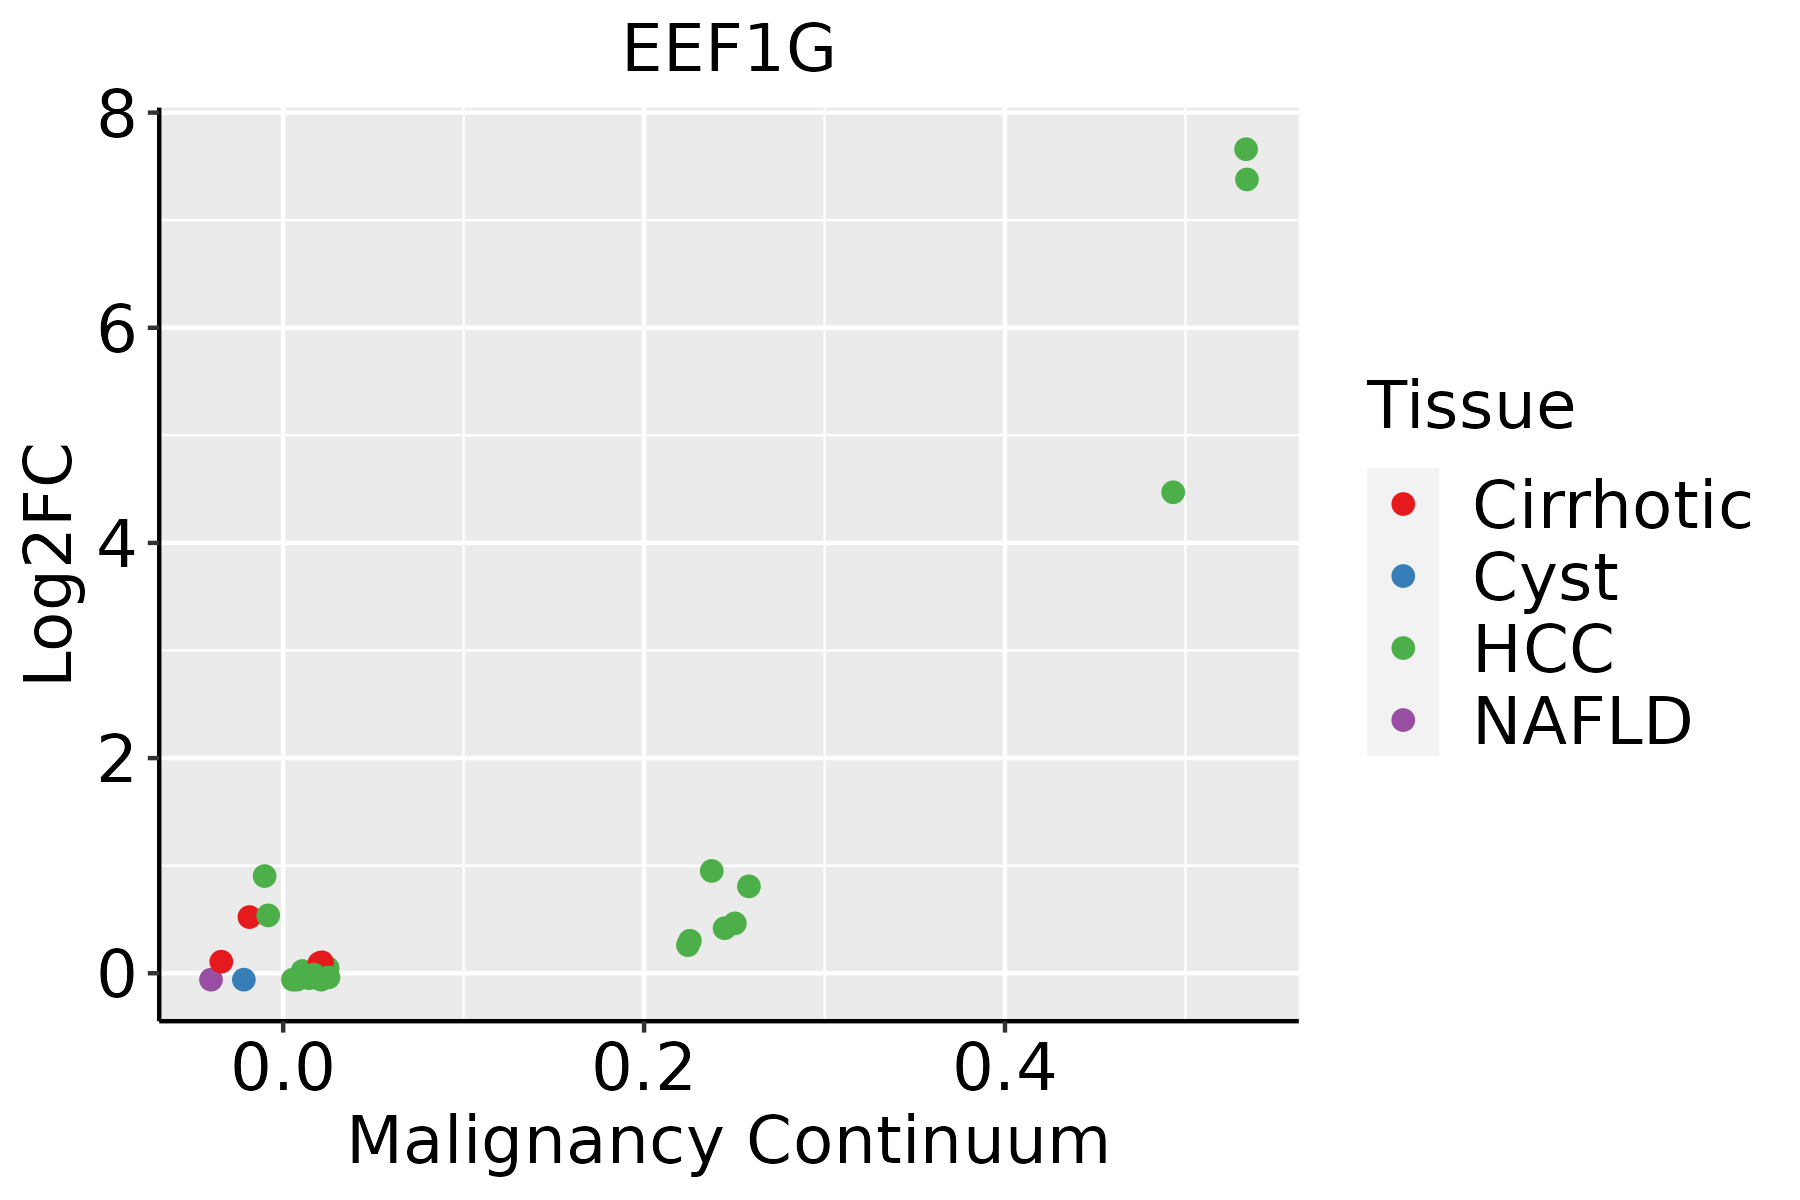 | HCC: Hepatocellular carcinoma |
| NAFLD: Non-alcoholic fatty liver disease | ||
| Lung | 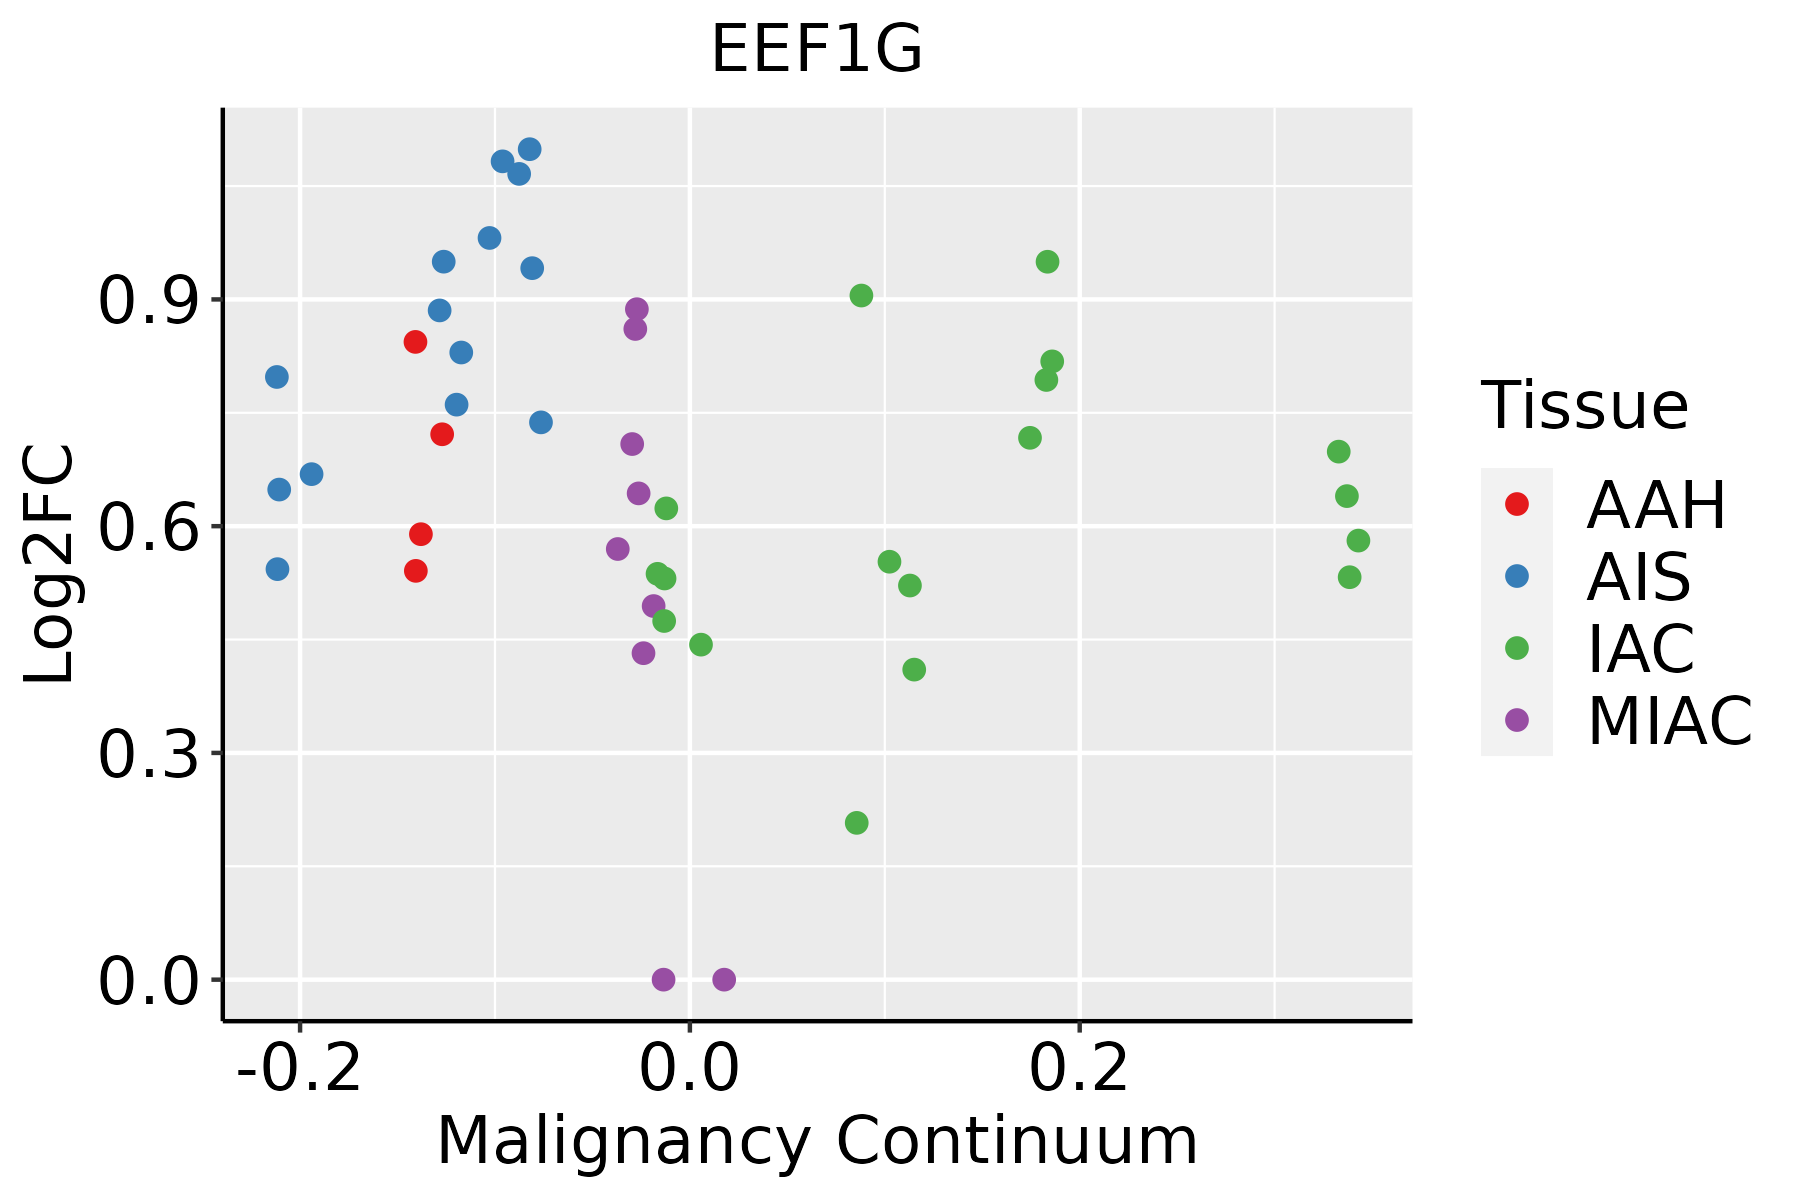 | AAH: Atypical adenomatous hyperplasia |
| AIS: Adenocarcinoma in situ | ||
| IAC: Invasive lung adenocarcinoma | ||
| MIA: Minimally invasive adenocarcinoma | ||
| Oral Cavity | 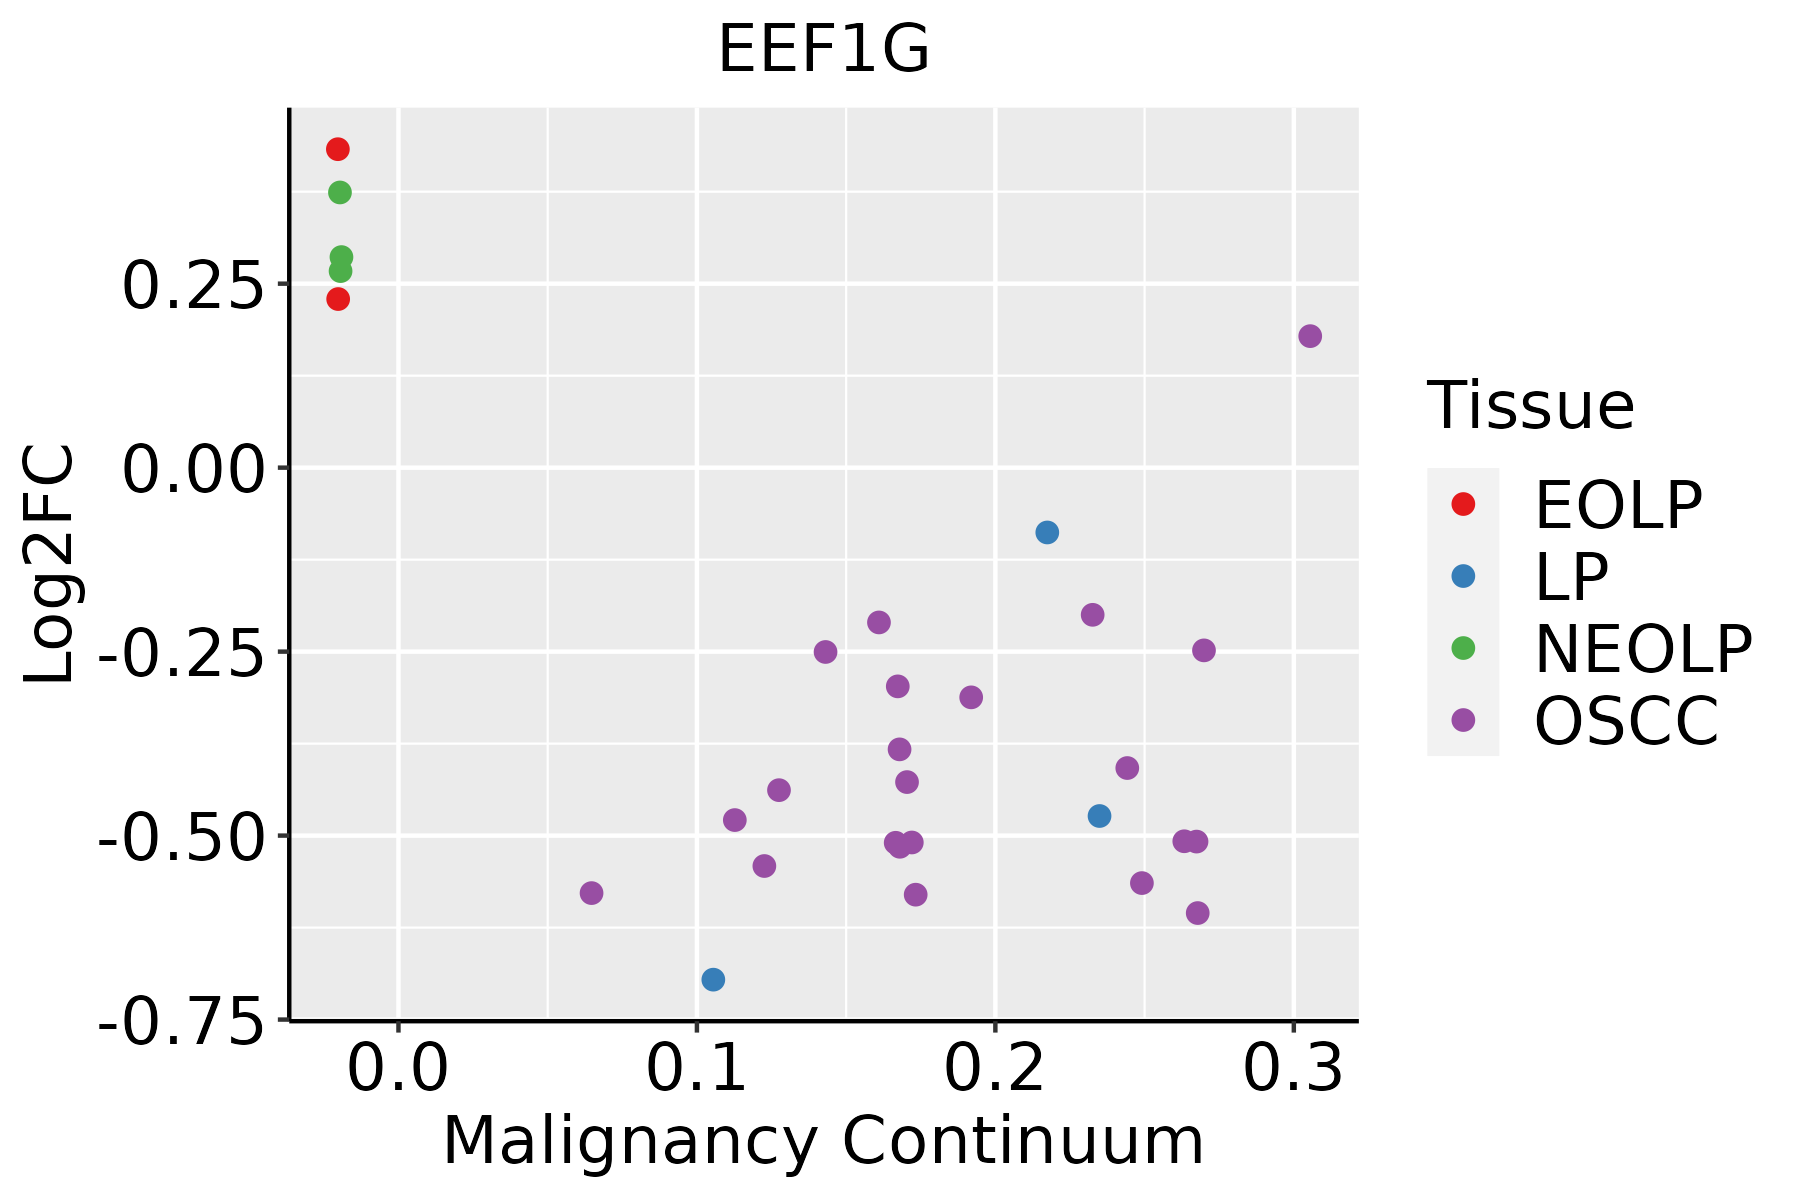 | EOLP: Erosive Oral lichen planus |
| LP: leukoplakia | ||
| NEOLP: Non-erosive oral lichen planus | ||
| OSCC: Oral squamous cell carcinoma | ||
| Prostate | 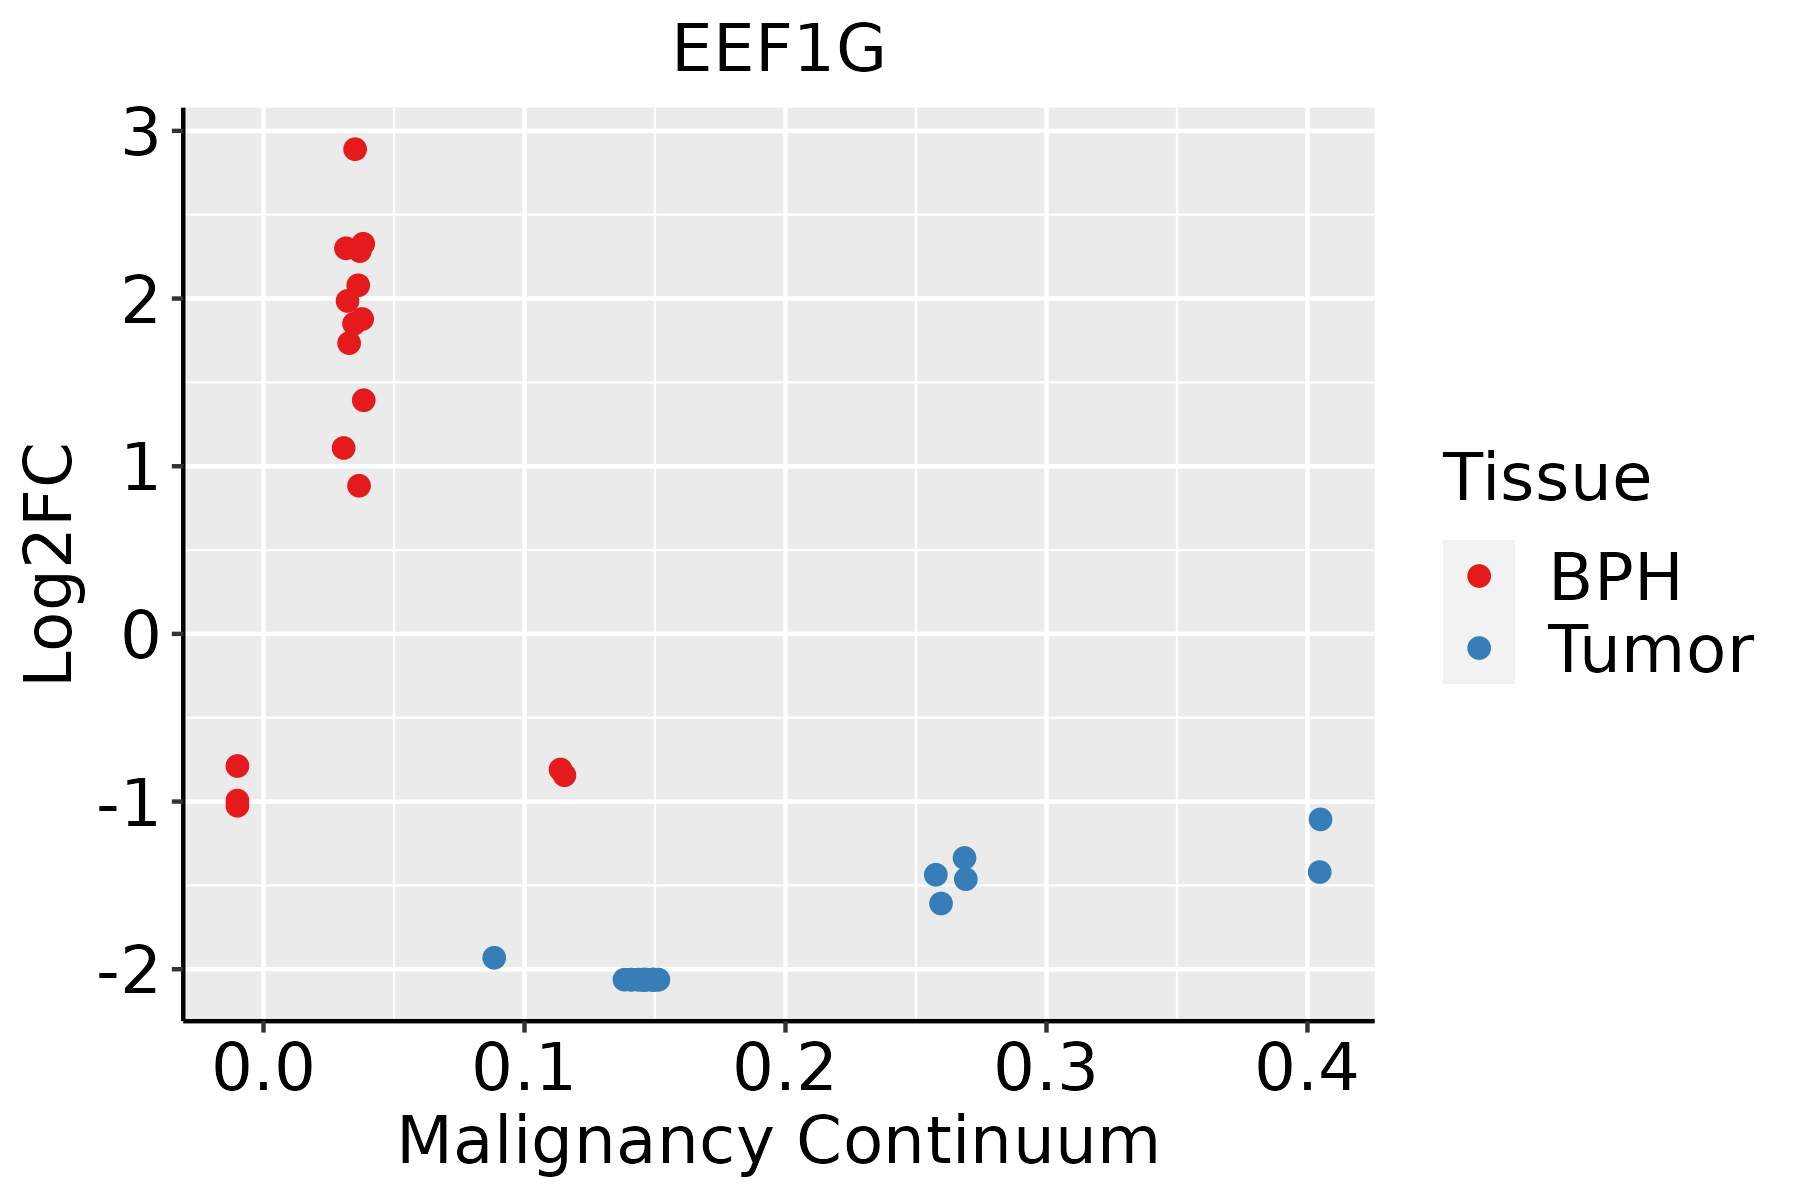 | BPH: Benign Prostatic Hyperplasia |
| Skin | 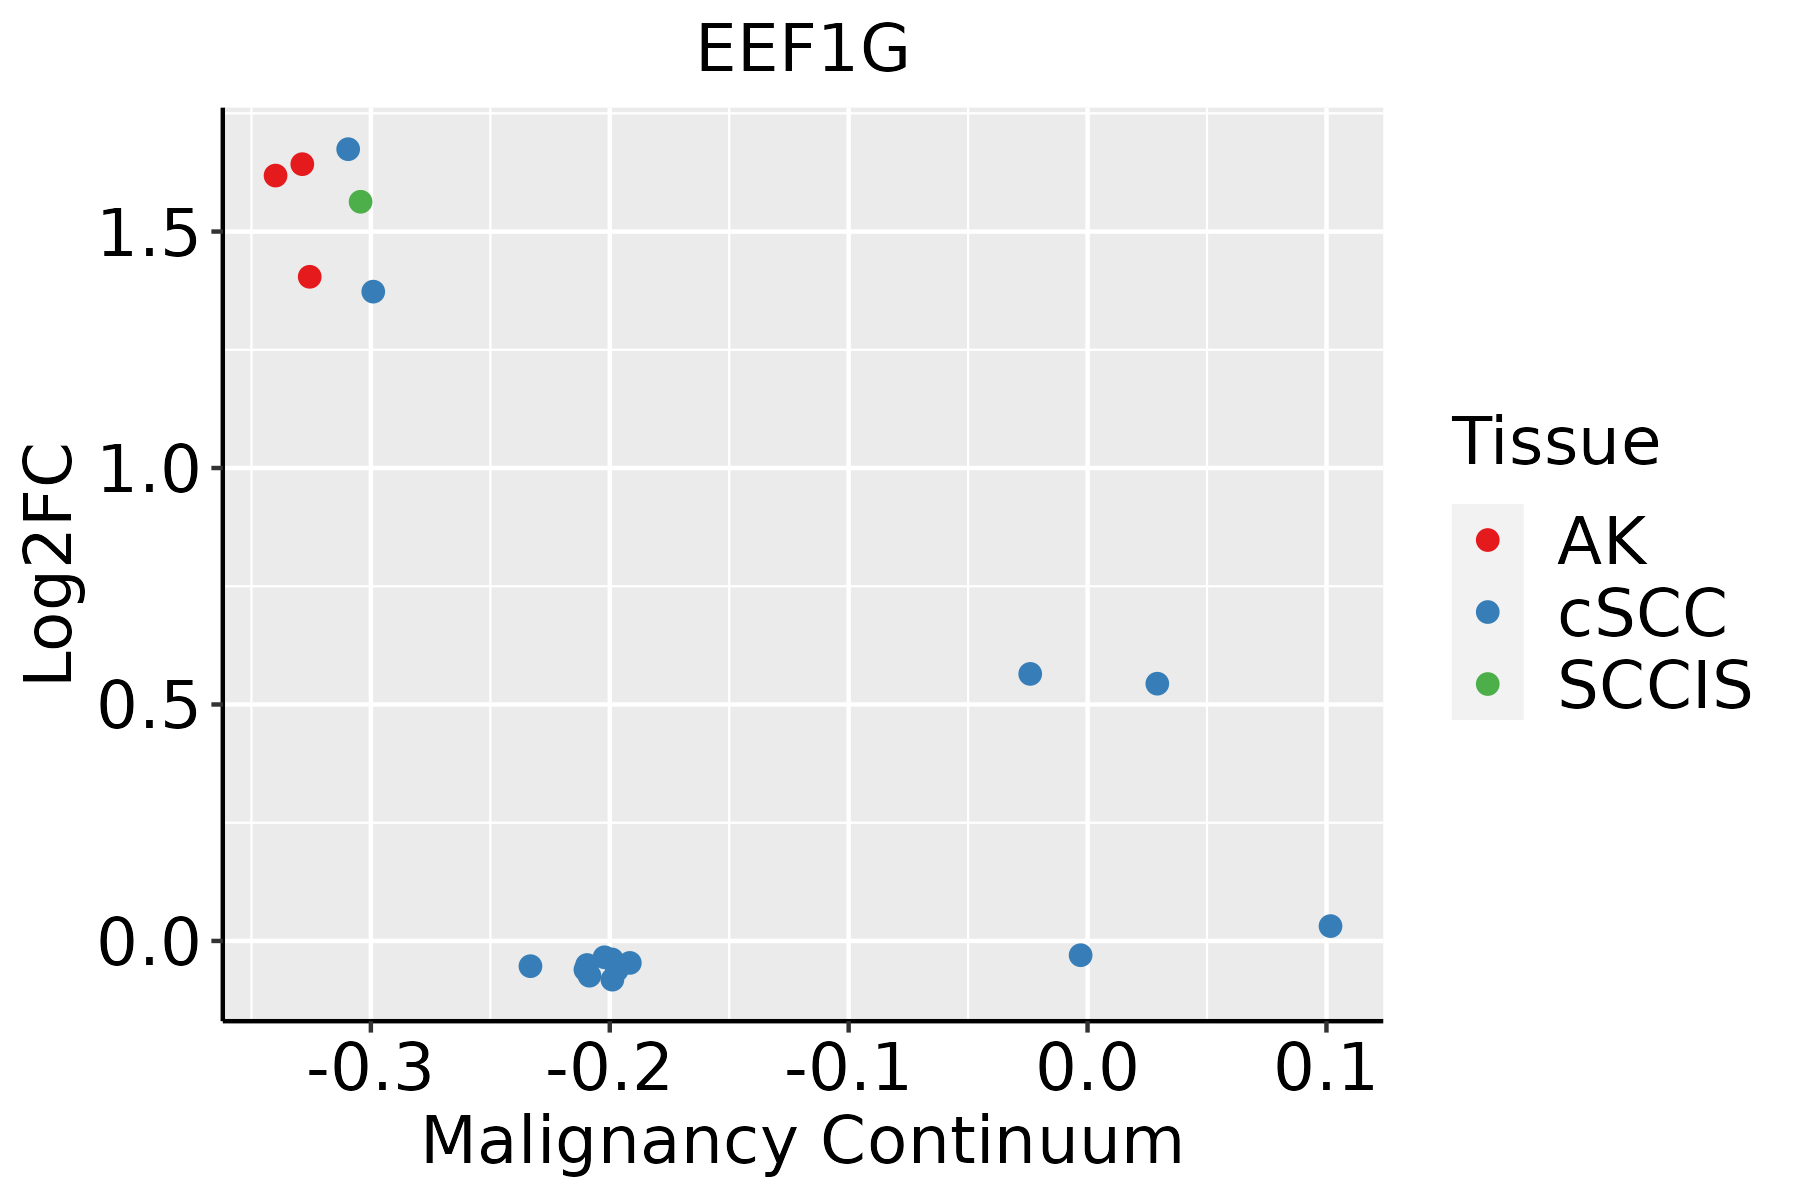 | AK: Actinic keratosis |
| cSCC: Cutaneous squamous cell carcinoma | ||
| SCCIS:squamous cell carcinoma in situ |
| ∗log2FC in expression of this searched gene in stem-like cells from each diseased tissue sample relative to stem-like cells in normal samples in each tissue plotted against the malignancy continuum. Samples are colored based on if they are from different disease stage. |
Top |
Malignant transformation related pathway analysis |
| Find out the enriched GO biological processes and KEGG pathways involved in transition from healthy to precancer to cancer |
| Tissue | Disease Stage | Enriched GO biological Processes |
| Colorectum | AD |  |
| Colorectum | SER |  |
| Colorectum | MSS |  |
| Colorectum | MSI-H |  |
| Colorectum | FAP |  |
| ∗Top 15 enriched GO BP terms are showed in the bar plot of each disease state in each tissue. Each row represents a significant GO biological process which is colored according to the -log10(p.adjust). |
| Page: 1 2 3 4 5 6 7 8 9 |
| GO ID | Tissue | Disease Stage | Description | Gene Ratio | Bg Ratio | pvalue | p.adjust | Count |
| GO:00096158 | Cervix | CC | response to virus | 73/2311 | 367/18723 | 2.22e-05 | 3.95e-04 | 73 |
| GO:00065755 | Cervix | HSIL_HPV | cellular modified amino acid metabolic process | 16/737 | 188/18723 | 3.18e-03 | 2.89e-02 | 16 |
| GO:00067495 | Cervix | HSIL_HPV | glutathione metabolic process | 8/737 | 64/18723 | 3.51e-03 | 3.15e-02 | 8 |
| GO:00064148 | Cervix | HSIL_HPV | translational elongation | 7/737 | 55/18723 | 5.59e-03 | 4.47e-02 | 7 |
| GO:00096159 | Endometrium | AEH | response to virus | 63/2100 | 367/18723 | 3.81e-04 | 4.10e-03 | 63 |
| GO:00064149 | Endometrium | AEH | translational elongation | 13/2100 | 55/18723 | 6.76e-03 | 3.94e-02 | 13 |
| GO:000961513 | Endometrium | EEC | response to virus | 66/2168 | 367/18723 | 1.78e-04 | 2.20e-03 | 66 |
| GO:000641414 | Endometrium | EEC | translational elongation | 13/2168 | 55/18723 | 8.79e-03 | 4.74e-02 | 13 |
| GO:000641418 | Esophagus | HGIN | translational elongation | 22/2587 | 55/18723 | 1.46e-06 | 5.56e-05 | 22 |
| GO:00067497 | Esophagus | HGIN | glutathione metabolic process | 20/2587 | 64/18723 | 2.63e-04 | 4.58e-03 | 20 |
| GO:000961517 | Esophagus | HGIN | response to virus | 69/2587 | 367/18723 | 4.39e-03 | 3.86e-02 | 69 |
| GO:000961518 | Esophagus | ESCC | response to virus | 238/8552 | 367/18723 | 6.65e-14 | 3.32e-12 | 238 |
| GO:00067906 | Esophagus | ESCC | sulfur compound metabolic process | 201/8552 | 339/18723 | 2.64e-07 | 3.94e-06 | 201 |
| GO:000641419 | Esophagus | ESCC | translational elongation | 41/8552 | 55/18723 | 1.26e-05 | 1.16e-04 | 41 |
| GO:00065757 | Esophagus | ESCC | cellular modified amino acid metabolic process | 112/8552 | 188/18723 | 8.31e-05 | 6.06e-04 | 112 |
| GO:000674912 | Esophagus | ESCC | glutathione metabolic process | 42/8552 | 64/18723 | 1.01e-03 | 5.12e-03 | 42 |
| GO:000679011 | Liver | Cirrhotic | sulfur compound metabolic process | 129/4634 | 339/18723 | 3.06e-08 | 1.04e-06 | 129 |
| GO:00096155 | Liver | Cirrhotic | response to virus | 126/4634 | 367/18723 | 2.10e-05 | 2.77e-04 | 126 |
| GO:000657511 | Liver | Cirrhotic | cellular modified amino acid metabolic process | 70/4634 | 188/18723 | 9.04e-05 | 9.69e-04 | 70 |
| GO:00067494 | Liver | Cirrhotic | glutathione metabolic process | 27/4634 | 64/18723 | 1.63e-03 | 1.05e-02 | 27 |
| Page: 1 2 3 |
| Pathway ID | Tissue | Disease Stage | Description | Gene Ratio | Bg Ratio | pvalue | p.adjust | qvalue | Count |
| hsa0513416 | Cervix | CC | Legionellosis | 20/1267 | 57/8465 | 1.29e-04 | 8.19e-04 | 4.85e-04 | 20 |
| hsa0513417 | Cervix | CC | Legionellosis | 20/1267 | 57/8465 | 1.29e-04 | 8.19e-04 | 4.85e-04 | 20 |
| hsa0513423 | Cervix | HSIL_HPV | Legionellosis | 12/459 | 57/8465 | 4.24e-05 | 6.21e-04 | 5.02e-04 | 12 |
| hsa0513433 | Cervix | HSIL_HPV | Legionellosis | 12/459 | 57/8465 | 4.24e-05 | 6.21e-04 | 5.02e-04 | 12 |
| hsa0513418 | Endometrium | EEC | Legionellosis | 17/1237 | 57/8465 | 2.42e-03 | 1.47e-02 | 1.10e-02 | 17 |
| hsa0513419 | Endometrium | EEC | Legionellosis | 17/1237 | 57/8465 | 2.42e-03 | 1.47e-02 | 1.10e-02 | 17 |
| hsa0513427 | Esophagus | HGIN | Legionellosis | 18/1383 | 57/8465 | 3.20e-03 | 2.54e-02 | 2.02e-02 | 18 |
| hsa05134112 | Esophagus | HGIN | Legionellosis | 18/1383 | 57/8465 | 3.20e-03 | 2.54e-02 | 2.02e-02 | 18 |
| hsa0513428 | Esophagus | ESCC | Legionellosis | 42/4205 | 57/8465 | 1.83e-04 | 6.90e-04 | 3.53e-04 | 42 |
| hsa0513436 | Esophagus | ESCC | Legionellosis | 42/4205 | 57/8465 | 1.83e-04 | 6.90e-04 | 3.53e-04 | 42 |
| hsa0513412 | Liver | Cirrhotic | Legionellosis | 28/2530 | 57/8465 | 1.71e-03 | 8.01e-03 | 4.94e-03 | 28 |
| hsa0513413 | Liver | Cirrhotic | Legionellosis | 28/2530 | 57/8465 | 1.71e-03 | 8.01e-03 | 4.94e-03 | 28 |
| hsa0513425 | Oral cavity | OSCC | Legionellosis | 42/3704 | 57/8465 | 4.18e-06 | 2.15e-05 | 1.10e-05 | 42 |
| hsa05134111 | Oral cavity | OSCC | Legionellosis | 42/3704 | 57/8465 | 4.18e-06 | 2.15e-05 | 1.10e-05 | 42 |
| hsa0513443 | Oral cavity | EOLP | Legionellosis | 18/1218 | 57/8465 | 7.27e-04 | 2.73e-03 | 1.61e-03 | 18 |
| hsa0513453 | Oral cavity | EOLP | Legionellosis | 18/1218 | 57/8465 | 7.27e-04 | 2.73e-03 | 1.61e-03 | 18 |
| hsa0513461 | Oral cavity | NEOLP | Legionellosis | 15/1112 | 57/8465 | 5.58e-03 | 2.17e-02 | 1.36e-02 | 15 |
| hsa0513471 | Oral cavity | NEOLP | Legionellosis | 15/1112 | 57/8465 | 5.58e-03 | 2.17e-02 | 1.36e-02 | 15 |
| hsa0513420 | Prostate | BPH | Legionellosis | 22/1718 | 57/8465 | 1.10e-03 | 4.99e-03 | 3.09e-03 | 22 |
| hsa05134110 | Prostate | BPH | Legionellosis | 22/1718 | 57/8465 | 1.10e-03 | 4.99e-03 | 3.09e-03 | 22 |
| Page: 1 2 |
Top |
Cell-cell communication analysis |
| Identification of potential cell-cell interactions between two cell types and their ligand-receptor pairs for different disease states |
| Ligand | Receptor | LRpair | Pathway | Tissue | Disease Stage |
| Page: 1 |
Top |
Single-cell gene regulatory network inference analysis |
| Find out the significant the regulons (TFs) and the target genes of each regulon across cell types for different disease states |
| TF | Cell Type | Tissue | Disease Stage | Target Gene | RSS | Regulon Activity |
| ∗The dot plots of a searched regulon are shown for all cell subpopulations in each disease state of each tissue based on the regulon specific score inferred using pySCENIC and by calculating the average expression. |
| Page: 1 |
Top |
Somatic mutation of malignant transformation related genes |
| Annotation of somatic variants for genes involved in malignant transformation |
| Hugo Symbol | Variant Class | Variant Classification | dbSNP RS | HGVSc | HGVSp | HGVSp Short | SWISSPROT | BIOTYPE | SIFT | PolyPhen | Tumor Sample Barcode | Tissue | Histology | Sex | Age | Stage | Therapy Types | Drugs | Outcome |
| EEF1G | SNV | Missense_Mutation | novel | c.1021N>G | p.Leu341Val | p.L341V | P26641 | protein_coding | deleterious(0) | probably_damaging(0.999) | TCGA-BH-A2L8-01 | Breast | breast invasive carcinoma | Female | <65 | I/II | Chemotherapy | cytoxan | CR |
| EEF1G | SNV | Missense_Mutation | c.77N>A | p.Gly26Glu | p.G26E | P26641 | protein_coding | deleterious(0) | probably_damaging(0.934) | TCGA-C8-A3M8-01 | Breast | breast invasive carcinoma | Female | >=65 | I/II | Hormone Therapy | tamoxiphen | CR | |
| EEF1G | SNV | Missense_Mutation | c.201C>A | p.Phe67Leu | p.F67L | P26641 | protein_coding | tolerated(0.41) | benign(0.035) | TCGA-AA-3977-01 | Colorectum | colon adenocarcinoma | Male | >=65 | I/II | Unknown | Unknown | SD | |
| EEF1G | SNV | Missense_Mutation | c.151N>T | p.Arg51Cys | p.R51C | P26641 | protein_coding | tolerated(0.06) | benign(0.013) | TCGA-AZ-6601-01 | Colorectum | colon adenocarcinoma | Male | >=65 | I/II | Unknown | Unknown | PD | |
| EEF1G | SNV | Missense_Mutation | novel | c.1246N>C | p.Tyr416His | p.Y416H | P26641 | protein_coding | deleterious(0) | possibly_damaging(0.506) | TCGA-A5-A1OF-01 | Endometrium | uterine corpus endometrioid carcinoma | Female | <65 | I/II | Unknown | Unknown | SD |
| EEF1G | SNV | Missense_Mutation | novel | c.548N>T | p.Ala183Val | p.A183V | P26641 | protein_coding | deleterious(0.01) | benign(0.098) | TCGA-A5-A1OF-01 | Endometrium | uterine corpus endometrioid carcinoma | Female | <65 | I/II | Unknown | Unknown | SD |
| EEF1G | SNV | Missense_Mutation | novel | c.720N>T | p.Glu240Asp | p.E240D | P26641 | protein_coding | tolerated(0.28) | benign(0.005) | TCGA-A5-A2K5-01 | Endometrium | uterine corpus endometrioid carcinoma | Female | >=65 | I/II | Unknown | Unknown | SD |
| EEF1G | SNV | Missense_Mutation | novel | c.286N>A | p.Val96Met | p.V96M | P26641 | protein_coding | tolerated(0.09) | benign(0.017) | TCGA-AJ-A3EK-01 | Endometrium | uterine corpus endometrioid carcinoma | Female | <65 | I/II | Chemotherapy | carboplatin | CR |
| EEF1G | SNV | Missense_Mutation | c.197G>A | p.Gly66Glu | p.G66E | P26641 | protein_coding | deleterious(0) | probably_damaging(0.982) | TCGA-AP-A0LM-01 | Endometrium | uterine corpus endometrioid carcinoma | Female | <65 | III/IV | Chemotherapy | cisplatin | SD | |
| EEF1G | SNV | Missense_Mutation | rs377344394 | c.548N>A | p.Ala183Asp | p.A183D | P26641 | protein_coding | deleterious(0.03) | benign(0.048) | TCGA-AP-A1DK-01 | Endometrium | uterine corpus endometrioid carcinoma | Female | <65 | I/II | Unknown | Unknown | SD |
| Page: 1 2 3 4 |
Top |
Related drugs of malignant transformation related genes |
| Identification of chemicals and drugs interact with genes involved in malignant transfromation |
| (DGIdb 4.0) |
| Entrez ID | Symbol | Category | Interaction Types | Drug Claim Name | Drug Name | PMIDs |
| Page: 1 |

Copyright 2023-Present -The University of Texas Health Science Center at Houston |