
|
|||||
|
 | |
| |
| |
| |
| |
| |
|
Gene: EEF1D |
Gene summary for EEF1D |
| Gene information | Species | Human | Gene symbol | EEF1D | Gene ID | 1936 |
| Gene name | eukaryotic translation elongation factor 1 delta | |
| Gene Alias | EF-1D | |
| Cytomap | 8q24.3 | |
| Gene Type | protein-coding | GO ID | GO:0006412 | UniProtAcc | B2RAR6 |
Top |
Malignant transformation analysis |
| Identification of the aberrant gene expression in precancerous and cancerous lesions by comparing the gene expression of stem-like cells in diseased tissues with normal stem cells |
| Entrez ID | Symbol | Replicates | Species | Organ | Tissue | Adj P-value | Log2FC | Malignancy |
| 1936 | EEF1D | GSM4909277 | Human | Breast | Precancer | 7.82e-05 | -8.65e-01 | 0.0177 |
| 1936 | EEF1D | GSM4909280 | Human | Breast | Precancer | 2.09e-07 | -7.64e-01 | 0.0305 |
| 1936 | EEF1D | GSM4909281 | Human | Breast | IDC | 1.18e-06 | 1.92e-01 | 0.21 |
| 1936 | EEF1D | GSM4909282 | Human | Breast | IDC | 2.80e-02 | -1.05e-01 | -0.0288 |
| 1936 | EEF1D | GSM4909293 | Human | Breast | IDC | 2.83e-26 | -2.39e-01 | 0.1581 |
| 1936 | EEF1D | GSM4909294 | Human | Breast | IDC | 4.34e-18 | 1.11e-01 | 0.2022 |
| 1936 | EEF1D | GSM4909296 | Human | Breast | IDC | 2.82e-19 | 1.79e-01 | 0.1524 |
| 1936 | EEF1D | GSM4909297 | Human | Breast | IDC | 3.35e-34 | 1.12e-01 | 0.1517 |
| 1936 | EEF1D | GSM4909298 | Human | Breast | IDC | 4.57e-03 | -8.56e-02 | 0.1551 |
| 1936 | EEF1D | GSM4909302 | Human | Breast | IDC | 1.31e-24 | 2.21e-01 | 0.1545 |
| 1936 | EEF1D | GSM4909304 | Human | Breast | IDC | 4.40e-09 | 2.25e-01 | 0.1636 |
| 1936 | EEF1D | GSM4909305 | Human | Breast | IDC | 2.35e-15 | 2.65e-01 | 0.0436 |
| 1936 | EEF1D | GSM4909306 | Human | Breast | IDC | 2.96e-37 | 3.43e-01 | 0.1564 |
| 1936 | EEF1D | GSM4909307 | Human | Breast | IDC | 4.89e-12 | 1.99e-01 | 0.1569 |
| 1936 | EEF1D | GSM4909308 | Human | Breast | IDC | 9.76e-20 | 2.59e-01 | 0.158 |
| 1936 | EEF1D | GSM4909309 | Human | Breast | IDC | 5.92e-27 | 2.18e-01 | 0.0483 |
| 1936 | EEF1D | GSM4909311 | Human | Breast | IDC | 5.79e-79 | 4.08e-01 | 0.1534 |
| 1936 | EEF1D | GSM4909312 | Human | Breast | IDC | 2.01e-94 | 5.35e-01 | 0.1552 |
| 1936 | EEF1D | GSM4909313 | Human | Breast | IDC | 2.17e-11 | 7.08e-02 | 0.0391 |
| 1936 | EEF1D | GSM4909315 | Human | Breast | IDC | 3.53e-22 | -5.07e-01 | 0.21 |
| Page: 1 2 3 4 5 6 7 8 9 10 11 12 13 14 15 16 |
| Tissue | Expression Dynamics | Abbreviation |
| Breast | 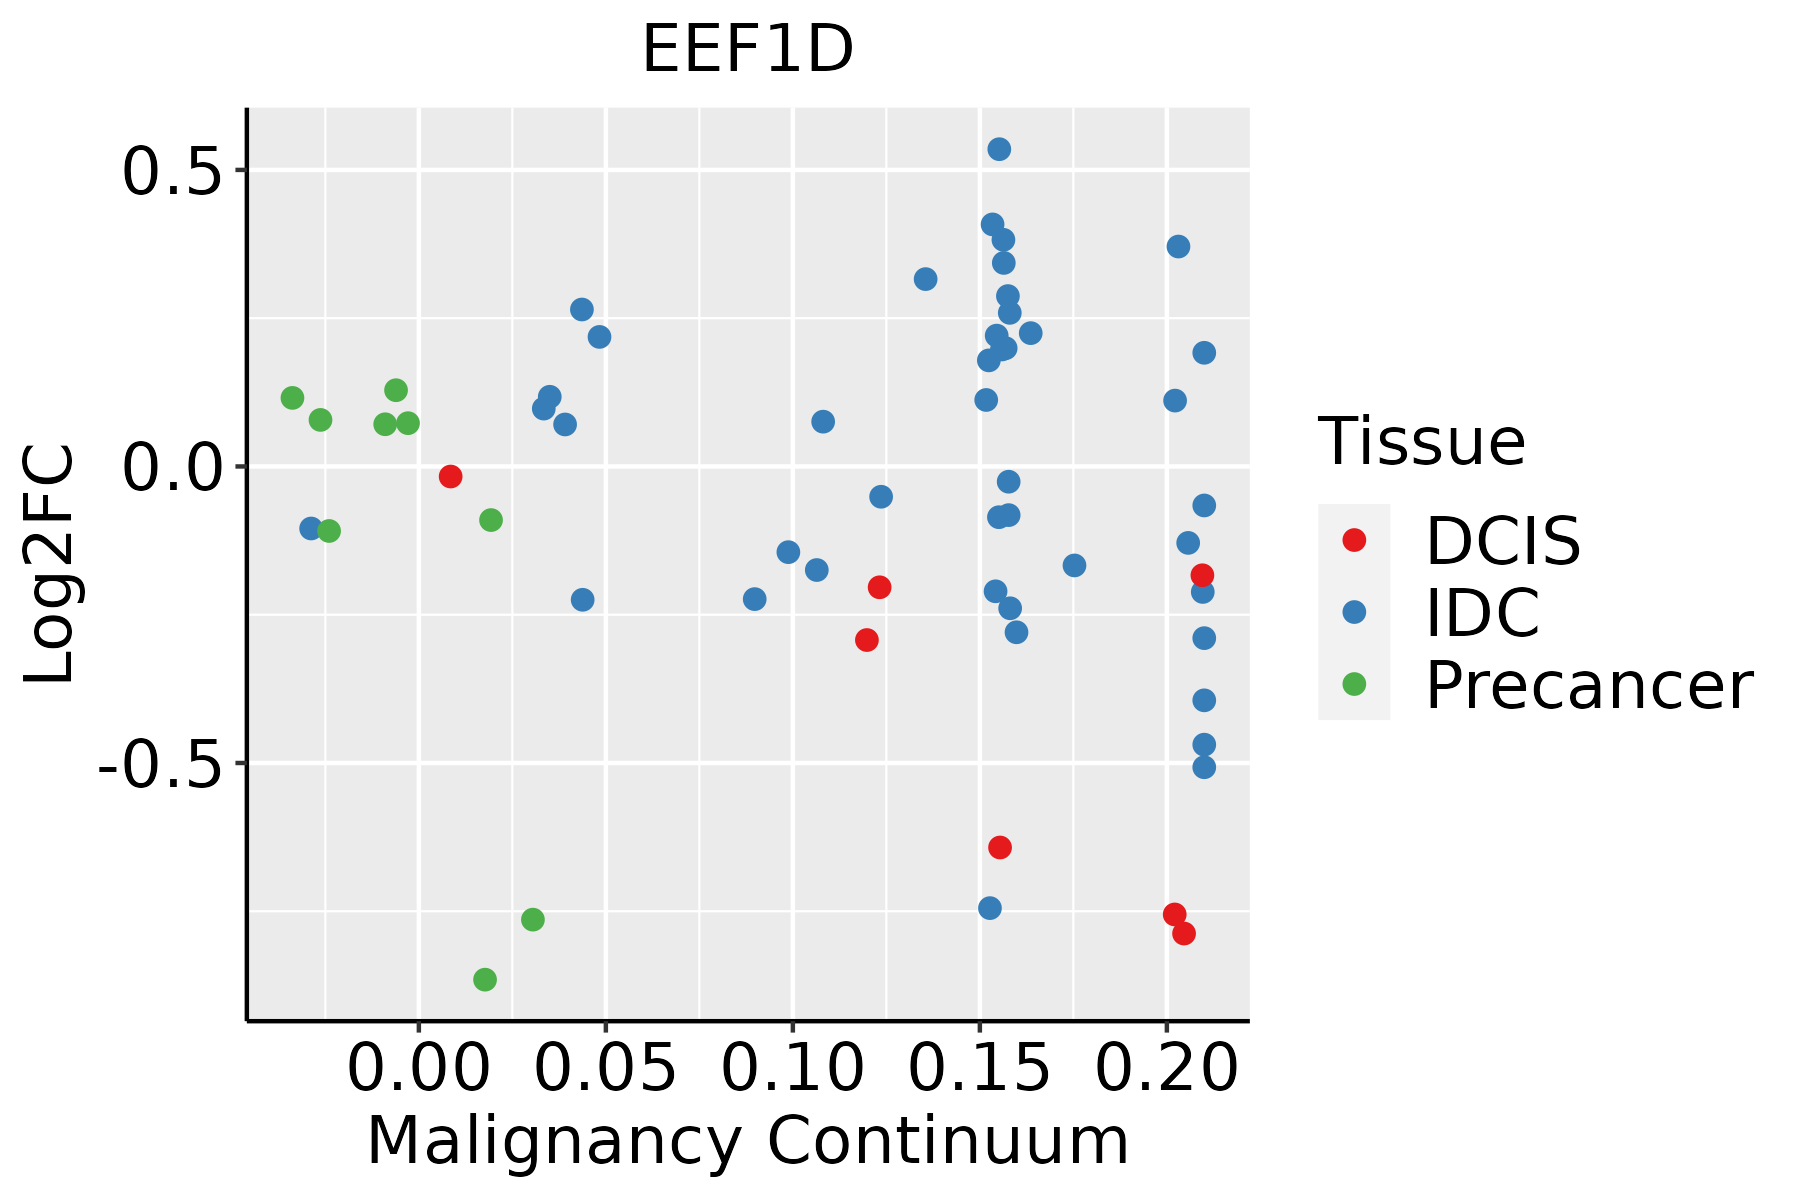 | IDC: Invasive ductal carcinoma |
| DCIS: Ductal carcinoma in situ | ||
| Precancer(BRCA1-mut): Precancerous lesion from BRCA1 mutation carriers | ||
| Cervix | 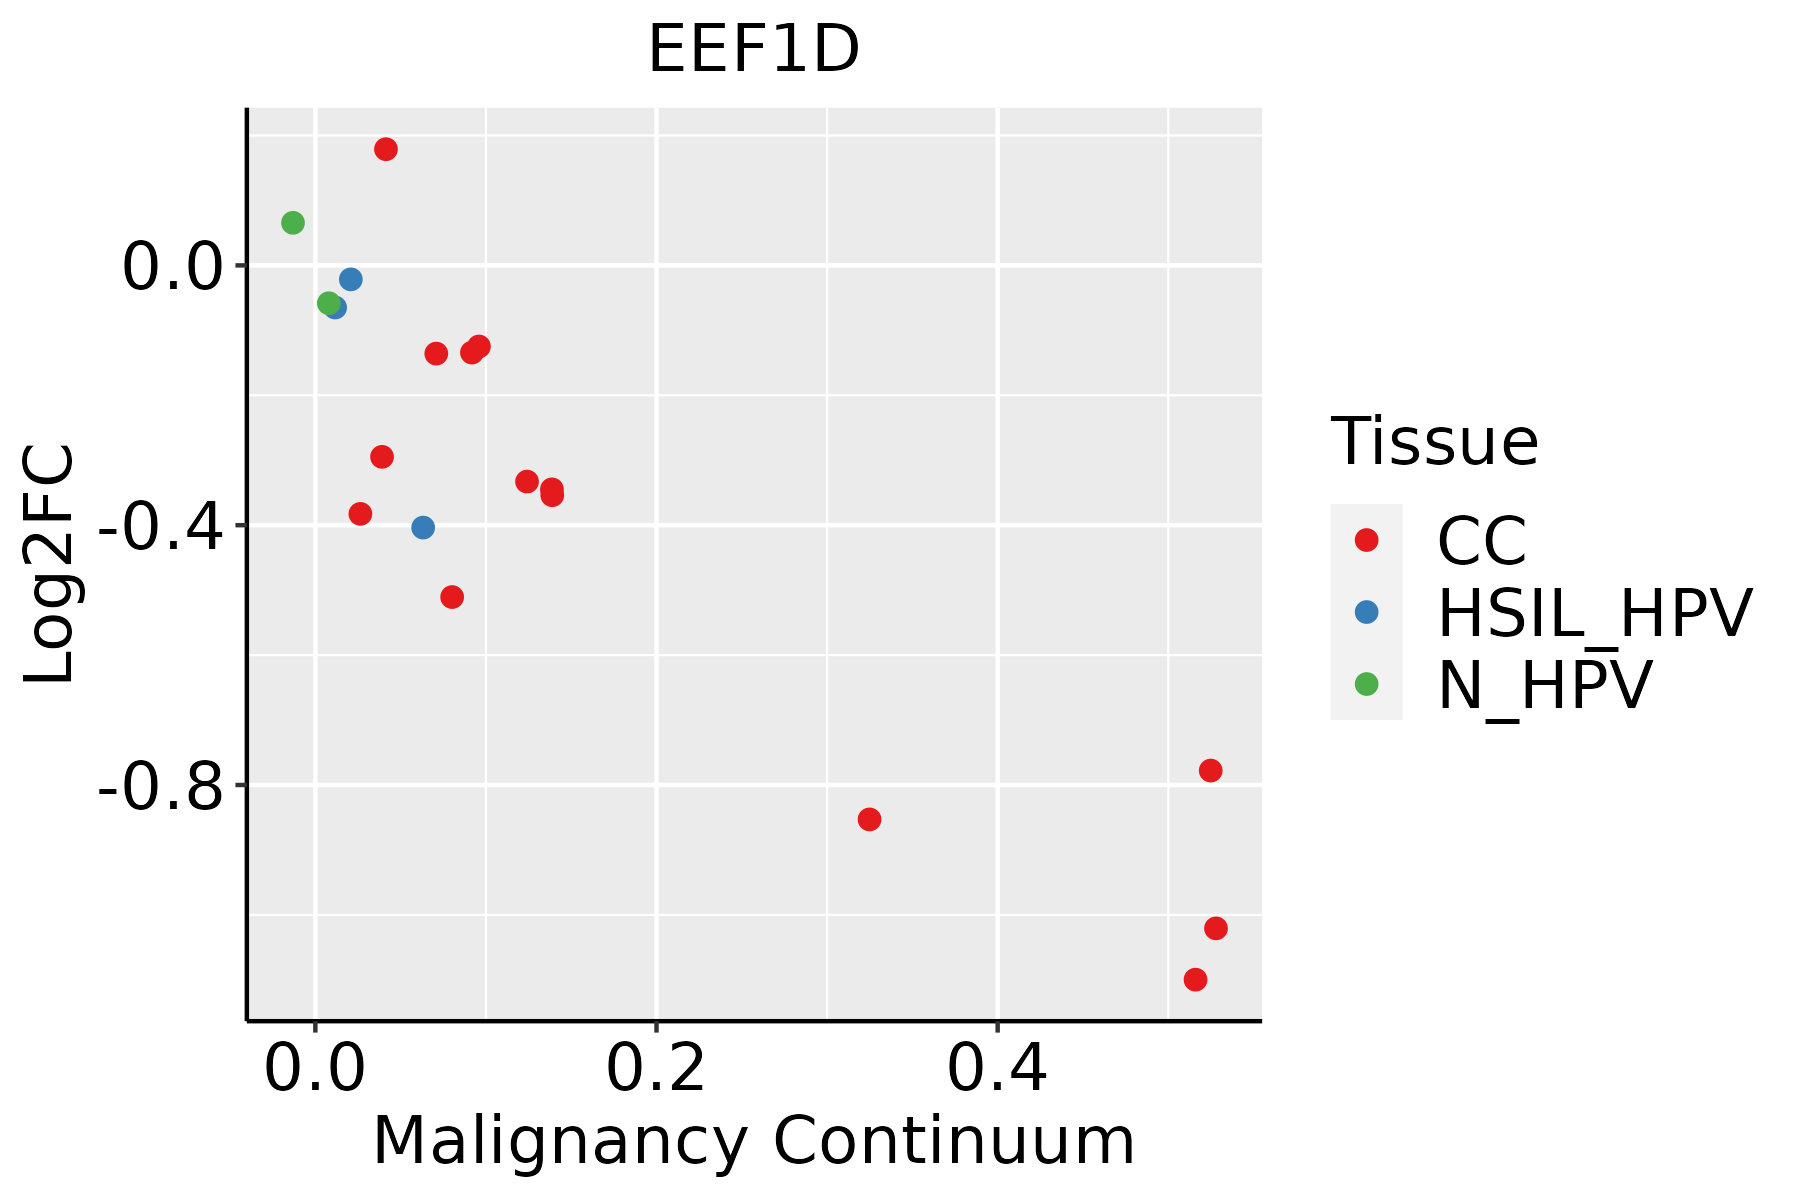 | CC: Cervix cancer |
| HSIL_HPV: HPV-infected high-grade squamous intraepithelial lesions | ||
| N_HPV: HPV-infected normal cervix | ||
| Endometrium |  | AEH: Atypical endometrial hyperplasia |
| EEC: Endometrioid Cancer | ||
| Esophagus |  | ESCC: Esophageal squamous cell carcinoma |
| HGIN: High-grade intraepithelial neoplasias | ||
| LGIN: Low-grade intraepithelial neoplasias | ||
| GC | 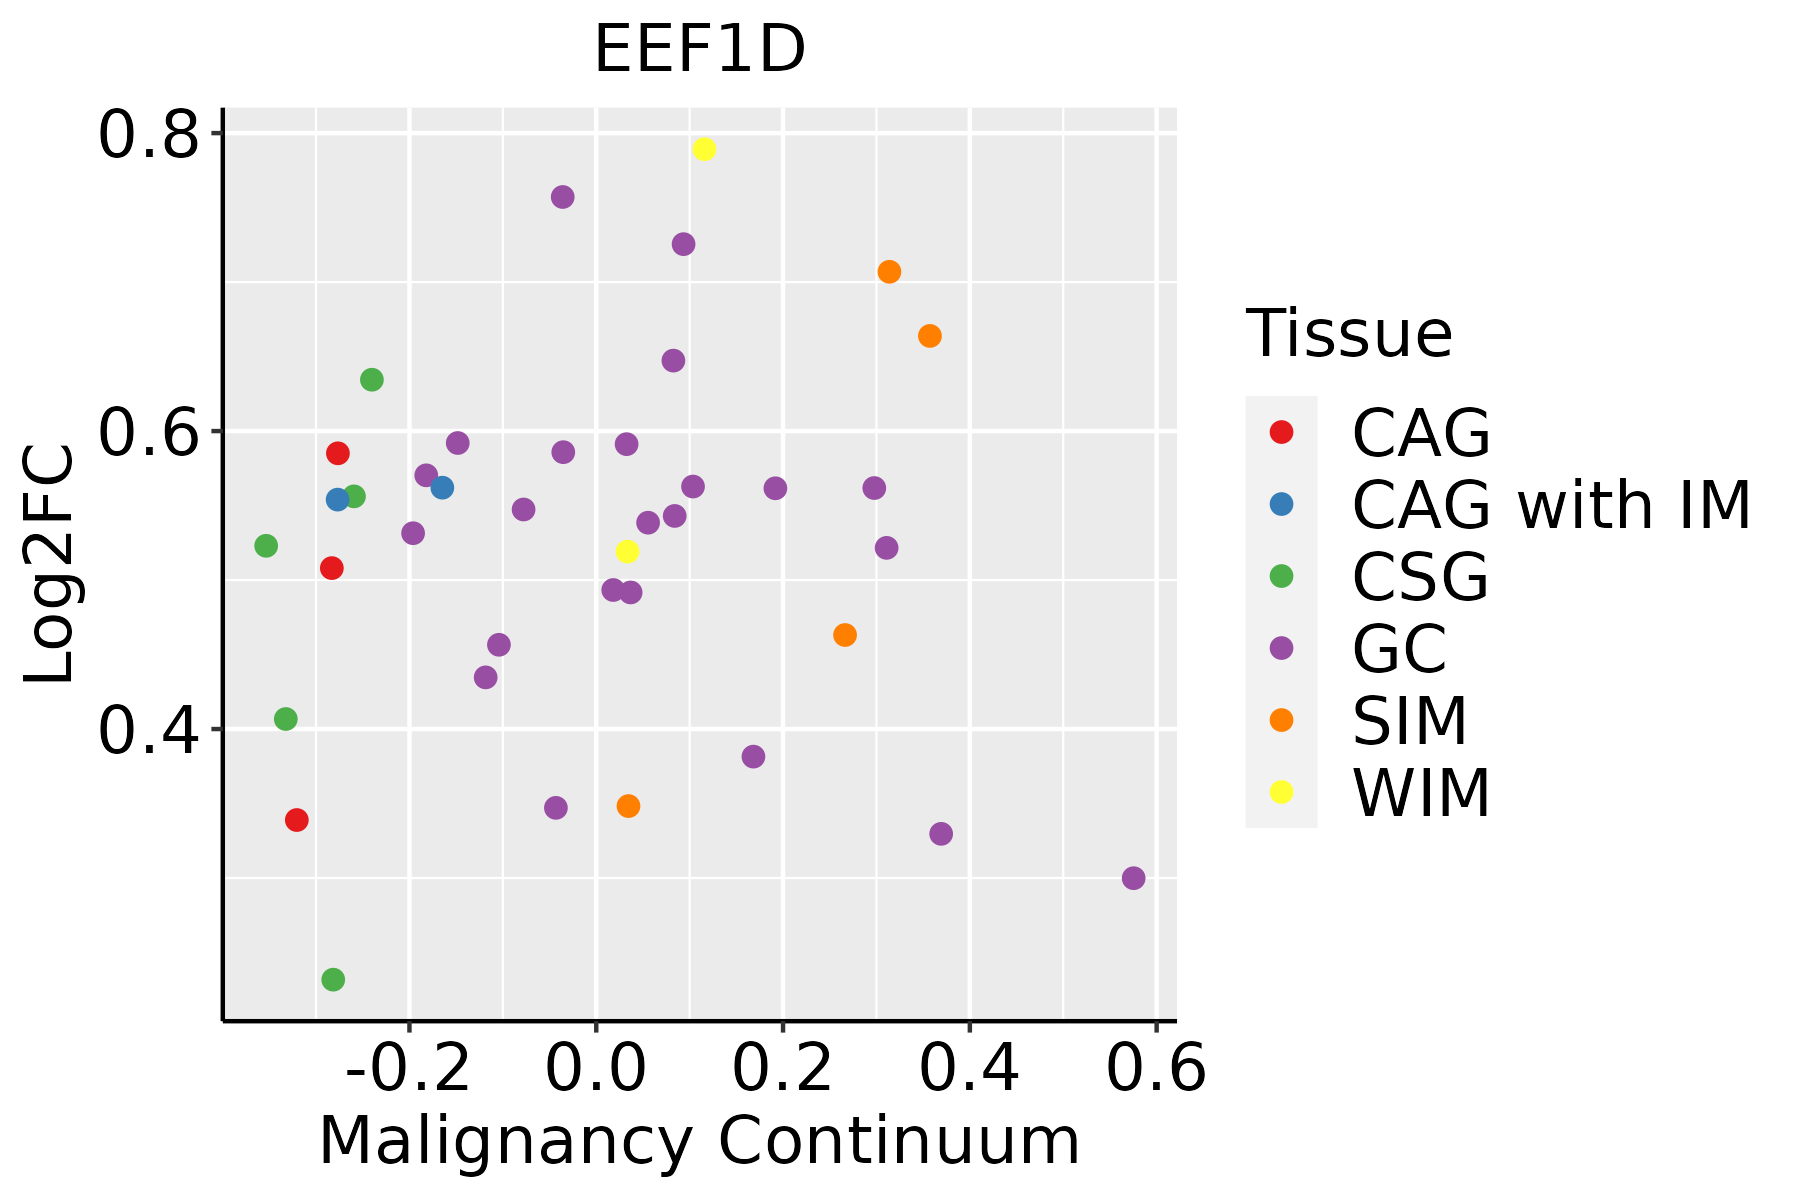 | CAG: Chronic atrophic gastritis |
| CAG with IM: Chronic atrophic gastritis with intestinal metaplasia | ||
| CSG: Chronic superficial gastritis | ||
| GC: Gastric cancer | ||
| SIM: Severe intestinal metaplasia | ||
| WIM: Wild intestinal metaplasia | ||
| Liver | 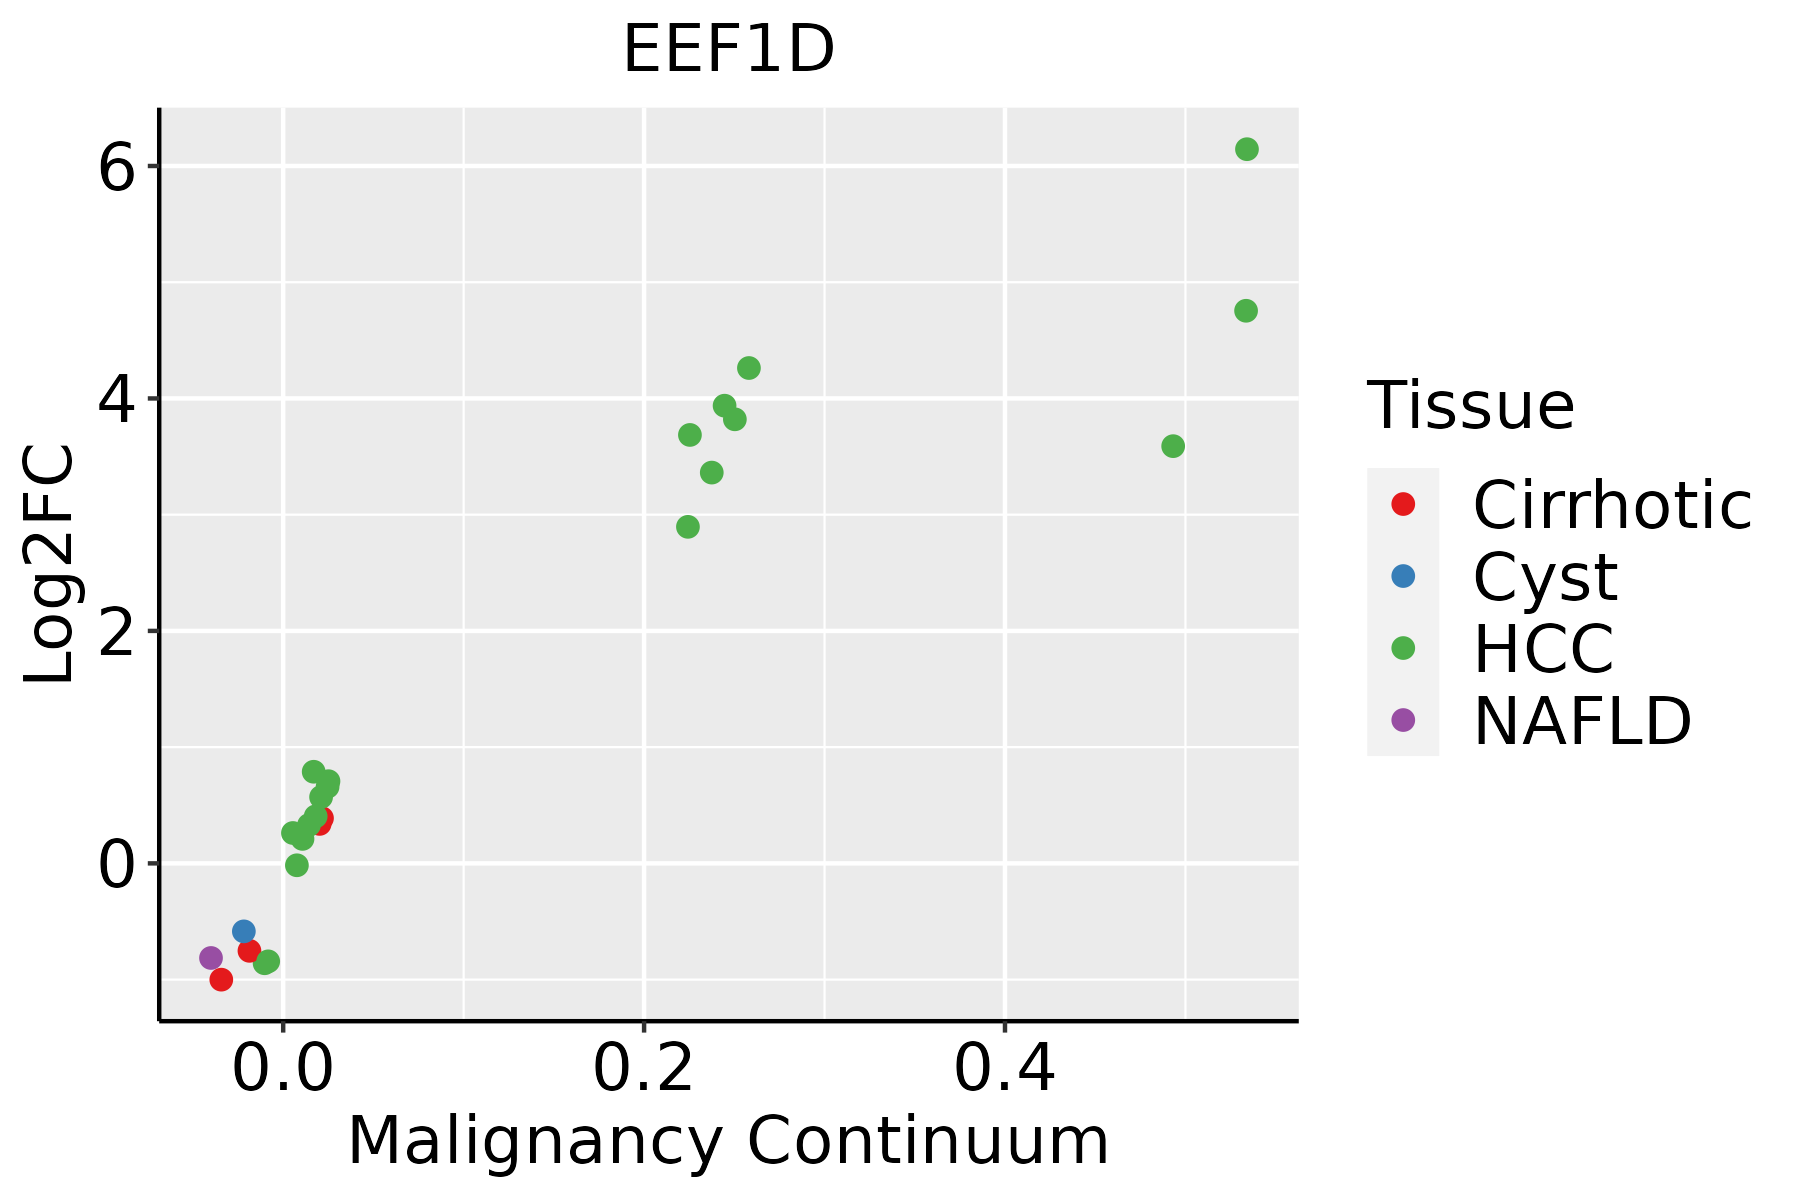 | HCC: Hepatocellular carcinoma |
| NAFLD: Non-alcoholic fatty liver disease | ||
| Oral Cavity |  | EOLP: Erosive Oral lichen planus |
| LP: leukoplakia | ||
| NEOLP: Non-erosive oral lichen planus | ||
| OSCC: Oral squamous cell carcinoma | ||
| Prostate | 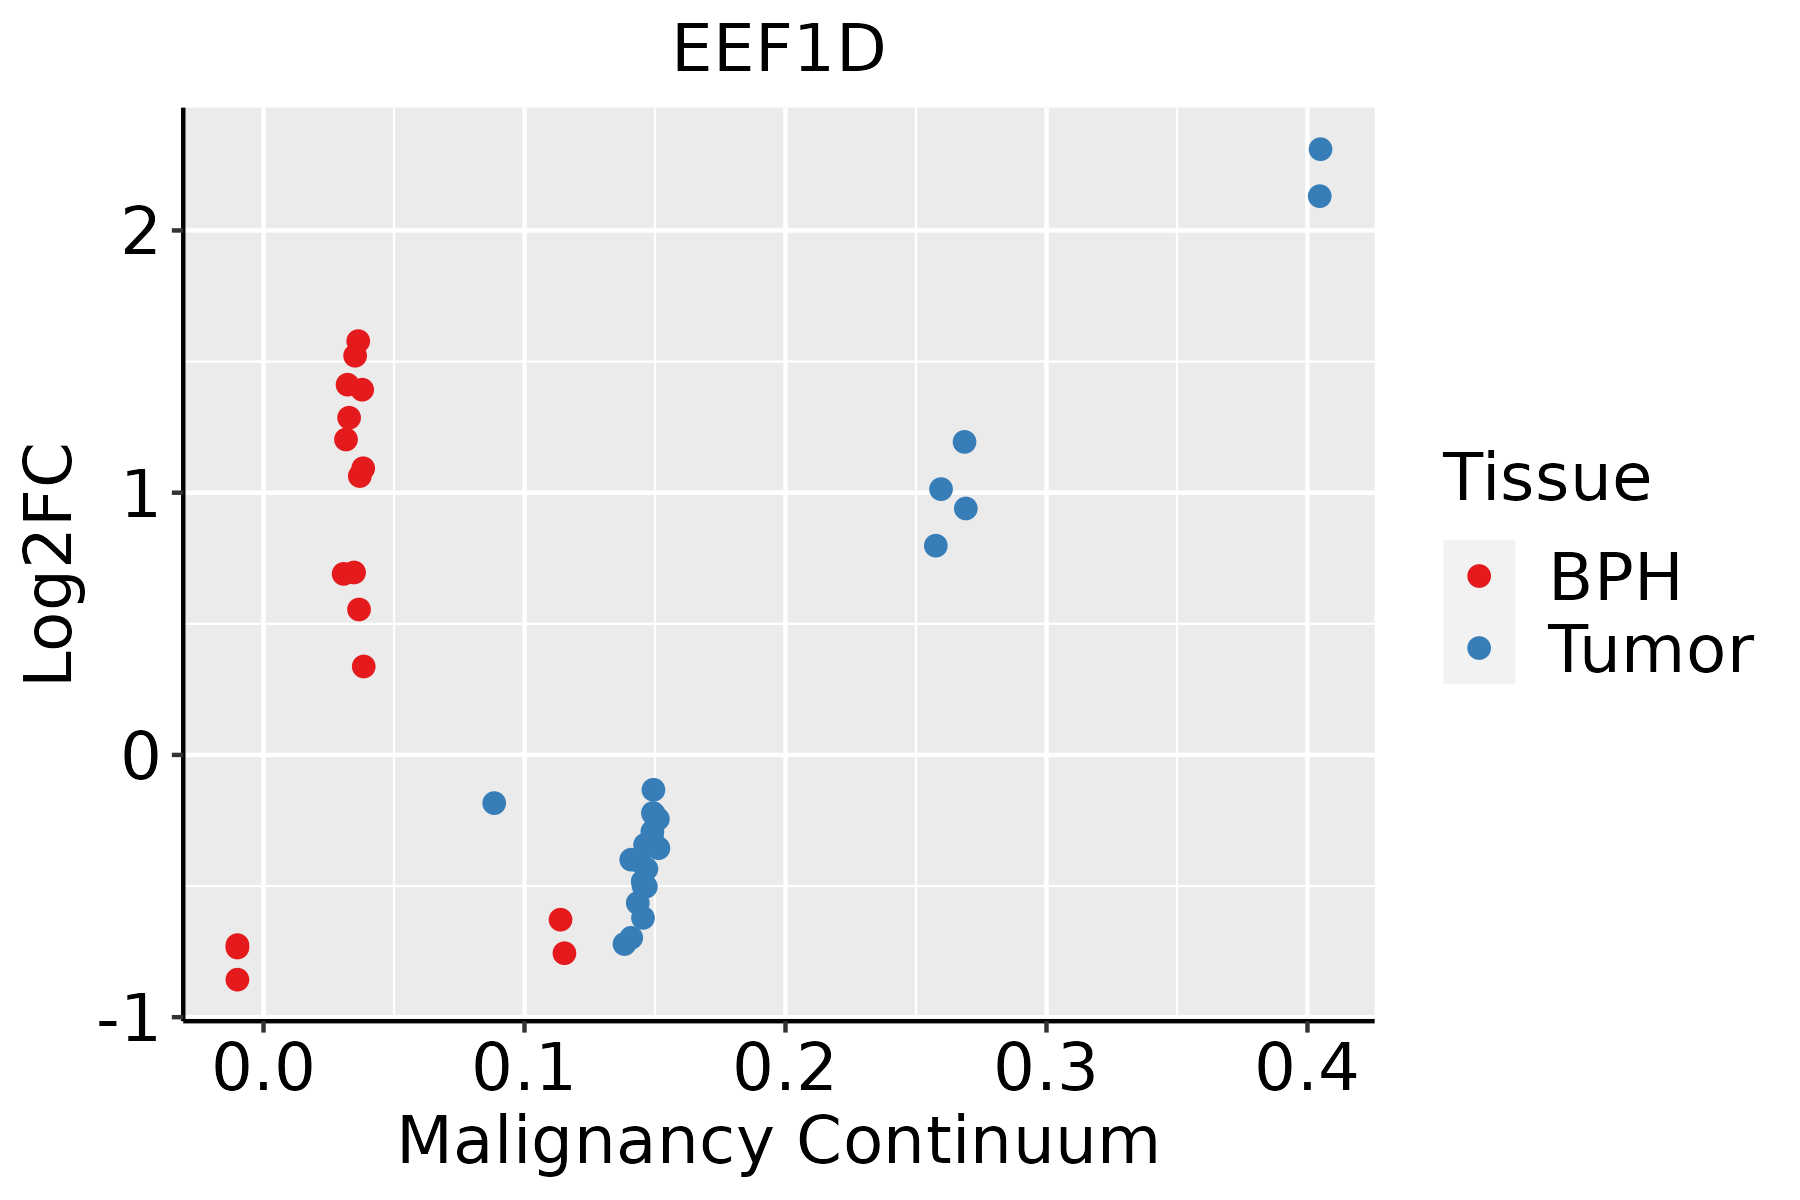 | BPH: Benign Prostatic Hyperplasia |
| Skin |  | AK: Actinic keratosis |
| cSCC: Cutaneous squamous cell carcinoma | ||
| SCCIS:squamous cell carcinoma in situ | ||
| Thyroid | 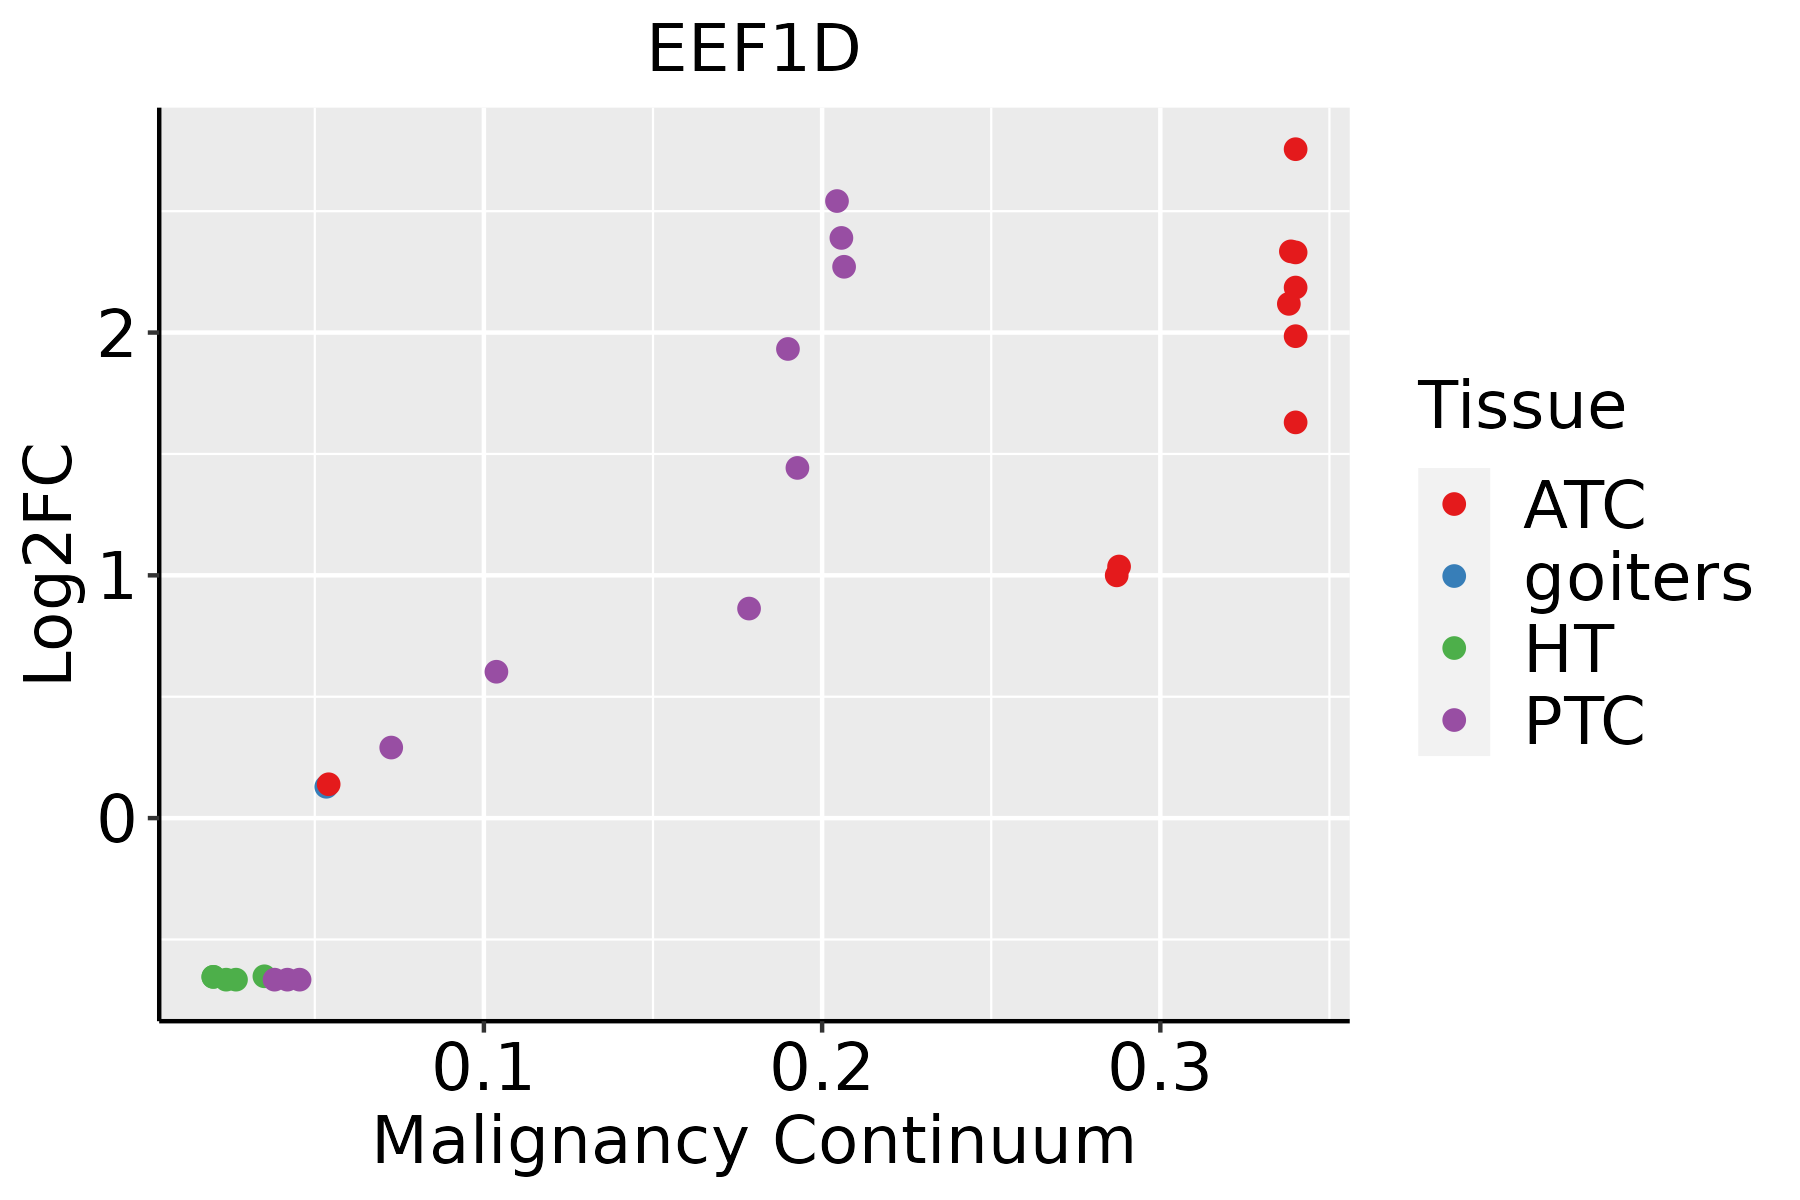 | ATC: Anaplastic thyroid cancer |
| HT: Hashimoto's thyroiditis | ||
| PTC: Papillary thyroid cancer |
| ∗log2FC in expression of this searched gene in stem-like cells from each diseased tissue sample relative to stem-like cells in normal samples in each tissue plotted against the malignancy continuum. Samples are colored based on if they are from different disease stage. |
Top |
Malignant transformation related pathway analysis |
| Find out the enriched GO biological processes and KEGG pathways involved in transition from healthy to precancer to cancer |
| Tissue | Disease Stage | Enriched GO biological Processes |
| Colorectum | AD |  |
| Colorectum | SER |  |
| Colorectum | MSS |  |
| Colorectum | MSI-H |  |
| Colorectum | FAP |  |
| ∗Top 15 enriched GO BP terms are showed in the bar plot of each disease state in each tissue. Each row represents a significant GO biological process which is colored according to the -log10(p.adjust). |
| Page: 1 2 3 4 5 6 7 8 9 |
| GO ID | Tissue | Disease Stage | Description | Gene Ratio | Bg Ratio | pvalue | p.adjust | Count |
| GO:00093148 | Breast | Precancer | response to radiation | 47/1080 | 456/18723 | 8.39e-05 | 1.62e-03 | 47 |
| GO:00712147 | Breast | Precancer | cellular response to abiotic stimulus | 37/1080 | 331/18723 | 9.12e-05 | 1.73e-03 | 37 |
| GO:01040047 | Breast | Precancer | cellular response to environmental stimulus | 37/1080 | 331/18723 | 9.12e-05 | 1.73e-03 | 37 |
| GO:00102125 | Breast | Precancer | response to ionizing radiation | 21/1080 | 148/18723 | 1.19e-04 | 2.13e-03 | 21 |
| GO:00714785 | Breast | Precancer | cellular response to radiation | 24/1080 | 186/18723 | 1.83e-04 | 2.96e-03 | 24 |
| GO:00714797 | Breast | Precancer | cellular response to ionizing radiation | 13/1080 | 72/18723 | 2.15e-04 | 3.33e-03 | 13 |
| GO:00064147 | Breast | Precancer | translational elongation | 10/1080 | 55/18723 | 1.06e-03 | 1.18e-02 | 10 |
| GO:00072496 | Breast | Precancer | I-kappaB kinase/NF-kappaB signaling | 27/1080 | 281/18723 | 6.58e-03 | 4.53e-02 | 27 |
| GO:007147913 | Breast | IDC | cellular response to ionizing radiation | 18/1434 | 72/18723 | 5.67e-06 | 1.85e-04 | 18 |
| GO:001021213 | Breast | IDC | response to ionizing radiation | 28/1434 | 148/18723 | 6.85e-06 | 2.09e-04 | 28 |
| GO:000931412 | Breast | IDC | response to radiation | 62/1434 | 456/18723 | 6.91e-06 | 2.10e-04 | 62 |
| GO:007121413 | Breast | IDC | cellular response to abiotic stimulus | 48/1434 | 331/18723 | 1.37e-05 | 3.53e-04 | 48 |
| GO:010400413 | Breast | IDC | cellular response to environmental stimulus | 48/1434 | 331/18723 | 1.37e-05 | 3.53e-04 | 48 |
| GO:007147813 | Breast | IDC | cellular response to radiation | 29/1434 | 186/18723 | 1.91e-04 | 3.15e-03 | 29 |
| GO:00431227 | Breast | IDC | regulation of I-kappaB kinase/NF-kappaB signaling | 34/1434 | 249/18723 | 7.18e-04 | 8.77e-03 | 34 |
| GO:000724914 | Breast | IDC | I-kappaB kinase/NF-kappaB signaling | 37/1434 | 281/18723 | 8.58e-04 | 9.98e-03 | 37 |
| GO:00431236 | Breast | IDC | positive regulation of I-kappaB kinase/NF-kappaB signaling | 26/1434 | 186/18723 | 2.06e-03 | 1.95e-02 | 26 |
| GO:000931422 | Breast | DCIS | response to radiation | 62/1390 | 456/18723 | 2.56e-06 | 8.87e-05 | 62 |
| GO:007147923 | Breast | DCIS | cellular response to ionizing radiation | 18/1390 | 72/18723 | 3.66e-06 | 1.16e-04 | 18 |
| GO:001021223 | Breast | DCIS | response to ionizing radiation | 28/1390 | 148/18723 | 3.79e-06 | 1.16e-04 | 28 |
| Page: 1 2 3 4 5 6 7 8 9 10 11 12 13 |
| Pathway ID | Tissue | Disease Stage | Description | Gene Ratio | Bg Ratio | pvalue | p.adjust | qvalue | Count |
| Page: 1 |
Top |
Cell-cell communication analysis |
| Identification of potential cell-cell interactions between two cell types and their ligand-receptor pairs for different disease states |
| Ligand | Receptor | LRpair | Pathway | Tissue | Disease Stage |
| Page: 1 |
Top |
Single-cell gene regulatory network inference analysis |
| Find out the significant the regulons (TFs) and the target genes of each regulon across cell types for different disease states |
| TF | Cell Type | Tissue | Disease Stage | Target Gene | RSS | Regulon Activity |
| ∗The dot plots of a searched regulon are shown for all cell subpopulations in each disease state of each tissue based on the regulon specific score inferred using pySCENIC and by calculating the average expression. |
| Page: 1 |
Top |
Somatic mutation of malignant transformation related genes |
| Annotation of somatic variants for genes involved in malignant transformation |
| Hugo Symbol | Variant Class | Variant Classification | dbSNP RS | HGVSc | HGVSp | HGVSp Short | SWISSPROT | BIOTYPE | SIFT | PolyPhen | Tumor Sample Barcode | Tissue | Histology | Sex | Age | Stage | Therapy Types | Drugs | Outcome |
| EEF1D | SNV | Missense_Mutation | c.1591G>A | p.Glu531Lys | p.E531K | P29692 | protein_coding | deleterious(0.03) | probably_damaging(0.954) | TCGA-BH-A0C1-01 | Breast | breast invasive carcinoma | Female | <65 | III/IV | Chemotherapy | adriamycin | PD | |
| EEF1D | SNV | Missense_Mutation | novel | c.73N>T | p.Arg25Trp | p.R25W | P29692 | protein_coding | deleterious(0) | probably_damaging(0.952) | TCGA-2W-A8YY-01 | Cervix | cervical & endocervical cancer | Female | <65 | I/II | Chemotherapy | cisplatin | CR |
| EEF1D | SNV | Missense_Mutation | rs200146410 | c.1637G>A | p.Arg546Gln | p.R546Q | P29692 | protein_coding | tolerated(0.07) | benign(0.305) | TCGA-A6-6653-01 | Colorectum | colon adenocarcinoma | Male | >=65 | I/II | Unknown | Unknown | SD |
| EEF1D | SNV | Missense_Mutation | c.1520N>A | p.Pro507Gln | p.P507Q | P29692 | protein_coding | deleterious(0.03) | benign(0.017) | TCGA-AZ-6601-01 | Colorectum | colon adenocarcinoma | Male | >=65 | I/II | Unknown | Unknown | PD | |
| EEF1D | SNV | Missense_Mutation | rs751524072 | c.688C>T | p.Arg230Trp | p.R230W | P29692 | protein_coding | deleterious(0.01) | possibly_damaging(0.446) | TCGA-CA-5256-01 | Colorectum | colon adenocarcinoma | Female | <65 | I/II | Chemotherapy | oxaliplatin | CR |
| EEF1D | SNV | Missense_Mutation | c.1282G>A | p.Ala428Thr | p.A428T | P29692 | protein_coding | deleterious(0.02) | probably_damaging(0.974) | TCGA-F4-6856-01 | Colorectum | colon adenocarcinoma | Male | <65 | I/II | Ancillary | leucovorin | CR | |
| EEF1D | deletion | In_Frame_Del | rs532050197 | c.827_844delNNNNNNNNNNNNNNNNNN | p.Arg276_Arg281del | p.R276_R281del | P29692 | protein_coding | TCGA-A6-4105-01 | Colorectum | colon adenocarcinoma | Male | >=65 | I/II | Unknown | Unknown | PD | ||
| EEF1D | deletion | Frame_Shift_Del | c.260delA | p.Lys87ArgfsTer73 | p.K87Rfs*73 | P29692 | protein_coding | TCGA-CM-5861-01 | Colorectum | colon adenocarcinoma | Female | <65 | I/II | Unknown | Unknown | PD | |||
| EEF1D | deletion | In_Frame_Del | c.1873_1875delCTG | p.Leu625del | p.L625del | P29692 | protein_coding | TCGA-G4-6628-01 | Colorectum | colon adenocarcinoma | Male | >=65 | I/II | Unknown | Unknown | SD | |||
| EEF1D | SNV | Missense_Mutation | novel | c.1159N>A | p.Ala387Thr | p.A387T | P29692 | protein_coding | deleterious(0.01) | probably_damaging(0.969) | TCGA-A5-A0G1-01 | Endometrium | uterine corpus endometrioid carcinoma | Female | >=65 | I/II | Unknown | Unknown | SD |
| Page: 1 2 3 4 5 6 |
Top |
Related drugs of malignant transformation related genes |
| Identification of chemicals and drugs interact with genes involved in malignant transfromation |
| (DGIdb 4.0) |
| Entrez ID | Symbol | Category | Interaction Types | Drug Claim Name | Drug Name | PMIDs |
| Page: 1 |

Copyright 2023-Present -The University of Texas Health Science Center at Houston |