
|
|||||
|
 | |
| |
| |
| |
| |
| |
|
Gene: EEF1B2 |
Gene summary for EEF1B2 |
| Gene information | Species | Human | Gene symbol | EEF1B2 | Gene ID | 1933 |
| Gene name | eukaryotic translation elongation factor 1 beta 2 | |
| Gene Alias | EEF1B | |
| Cytomap | 2q33.3 | |
| Gene Type | protein-coding | GO ID | GO:0006412 | UniProtAcc | A0A024R3W7 |
Top |
Malignant transformation analysis |
| Identification of the aberrant gene expression in precancerous and cancerous lesions by comparing the gene expression of stem-like cells in diseased tissues with normal stem cells |
| Entrez ID | Symbol | Replicates | Species | Organ | Tissue | Adj P-value | Log2FC | Malignancy |
| 1933 | EEF1B2 | GSM4909281 | Human | Breast | IDC | 4.43e-02 | -1.06e-01 | 0.21 |
| 1933 | EEF1B2 | GSM4909282 | Human | Breast | IDC | 9.23e-34 | -5.17e-01 | -0.0288 |
| 1933 | EEF1B2 | GSM4909287 | Human | Breast | IDC | 2.93e-03 | -3.39e-01 | 0.2057 |
| 1933 | EEF1B2 | GSM4909293 | Human | Breast | IDC | 2.46e-38 | -4.70e-01 | 0.1581 |
| 1933 | EEF1B2 | GSM4909294 | Human | Breast | IDC | 9.22e-07 | -3.60e-01 | 0.2022 |
| 1933 | EEF1B2 | GSM4909295 | Human | Breast | IDC | 3.52e-02 | -3.55e-01 | 0.0898 |
| 1933 | EEF1B2 | GSM4909296 | Human | Breast | IDC | 4.95e-13 | -3.68e-01 | 0.1524 |
| 1933 | EEF1B2 | GSM4909297 | Human | Breast | IDC | 1.70e-17 | -3.59e-01 | 0.1517 |
| 1933 | EEF1B2 | GSM4909298 | Human | Breast | IDC | 2.96e-25 | -3.14e-01 | 0.1551 |
| 1933 | EEF1B2 | GSM4909301 | Human | Breast | IDC | 5.75e-24 | -4.59e-01 | 0.1577 |
| 1933 | EEF1B2 | GSM4909302 | Human | Breast | IDC | 1.21e-16 | -5.47e-01 | 0.1545 |
| 1933 | EEF1B2 | GSM4909304 | Human | Breast | IDC | 1.30e-49 | -5.83e-01 | 0.1636 |
| 1933 | EEF1B2 | GSM4909306 | Human | Breast | IDC | 2.82e-20 | -3.42e-01 | 0.1564 |
| 1933 | EEF1B2 | GSM4909307 | Human | Breast | IDC | 2.22e-09 | -2.86e-01 | 0.1569 |
| 1933 | EEF1B2 | GSM4909308 | Human | Breast | IDC | 1.53e-14 | -2.37e-01 | 0.158 |
| 1933 | EEF1B2 | GSM4909309 | Human | Breast | IDC | 2.78e-05 | -4.04e-01 | 0.0483 |
| 1933 | EEF1B2 | GSM4909311 | Human | Breast | IDC | 8.32e-46 | -7.41e-01 | 0.1534 |
| 1933 | EEF1B2 | GSM4909312 | Human | Breast | IDC | 8.93e-06 | -3.13e-01 | 0.1552 |
| 1933 | EEF1B2 | GSM4909315 | Human | Breast | IDC | 1.20e-12 | -3.79e-01 | 0.21 |
| 1933 | EEF1B2 | GSM4909316 | Human | Breast | IDC | 9.78e-06 | -6.02e-01 | 0.21 |
| Page: 1 2 3 4 5 6 7 8 9 10 11 12 13 14 15 16 17 |
| Tissue | Expression Dynamics | Abbreviation |
| Breast | 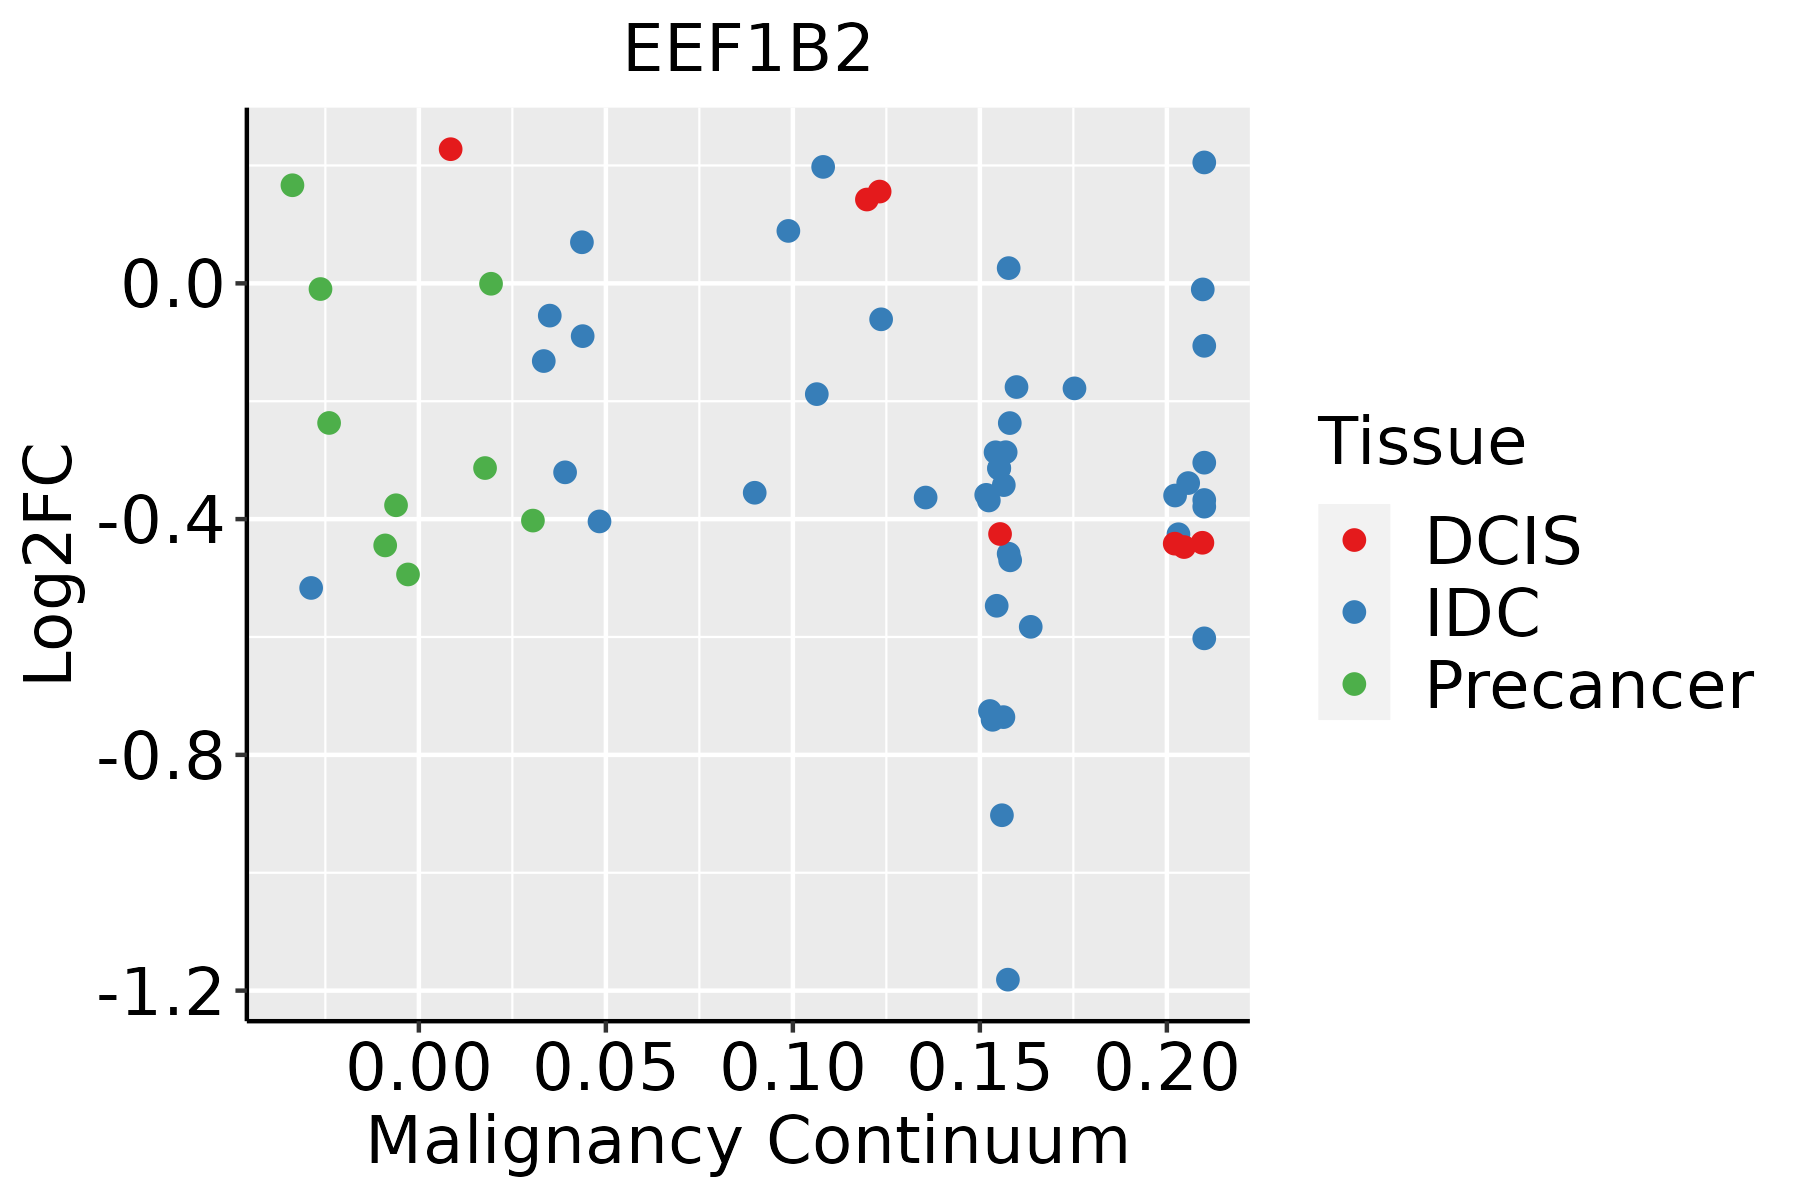 | IDC: Invasive ductal carcinoma |
| DCIS: Ductal carcinoma in situ | ||
| Precancer(BRCA1-mut): Precancerous lesion from BRCA1 mutation carriers | ||
| Cervix | 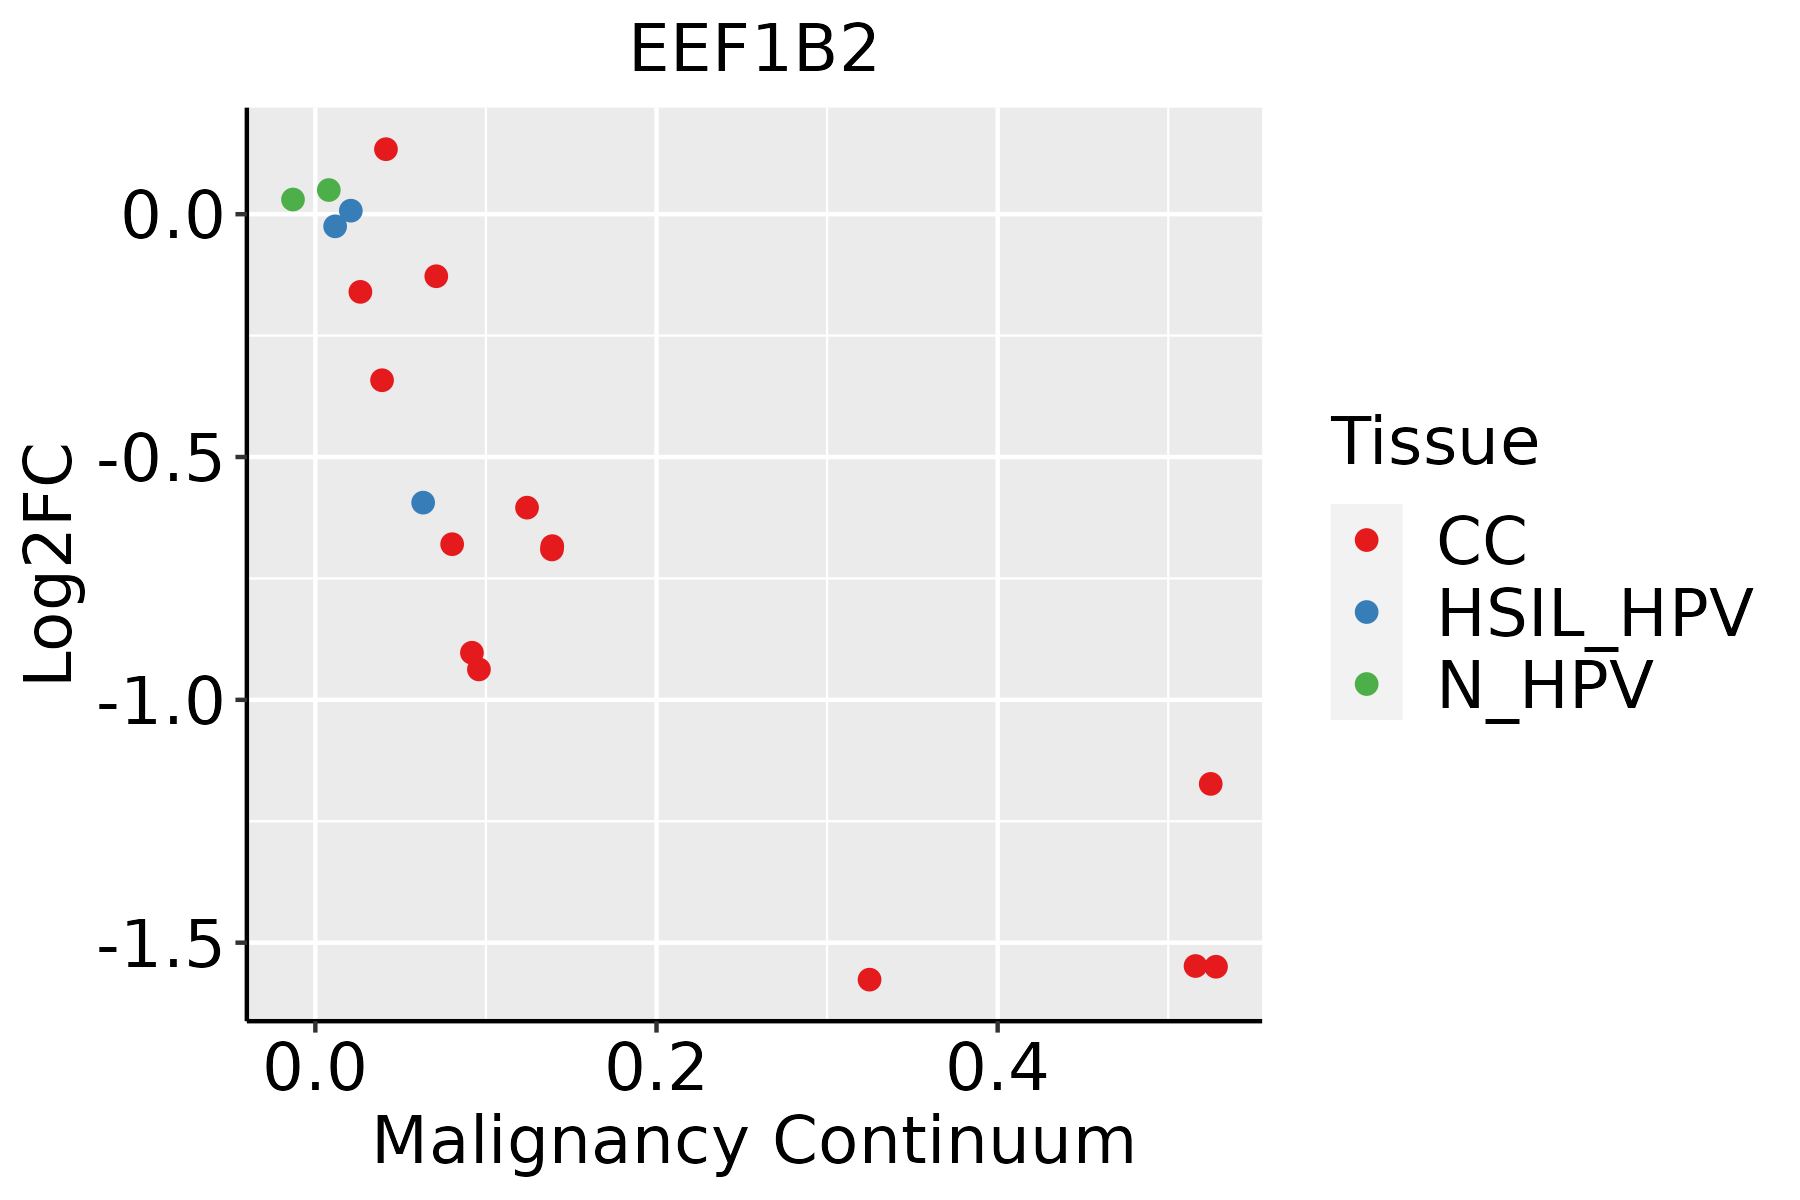 | CC: Cervix cancer |
| HSIL_HPV: HPV-infected high-grade squamous intraepithelial lesions | ||
| N_HPV: HPV-infected normal cervix | ||
| Colorectum (GSE201348) |  | FAP: Familial adenomatous polyposis |
| CRC: Colorectal cancer | ||
| Colorectum (HTA11) |  | AD: Adenomas |
| SER: Sessile serrated lesions | ||
| MSI-H: Microsatellite-high colorectal cancer | ||
| MSS: Microsatellite stable colorectal cancer | ||
| Endometrium | 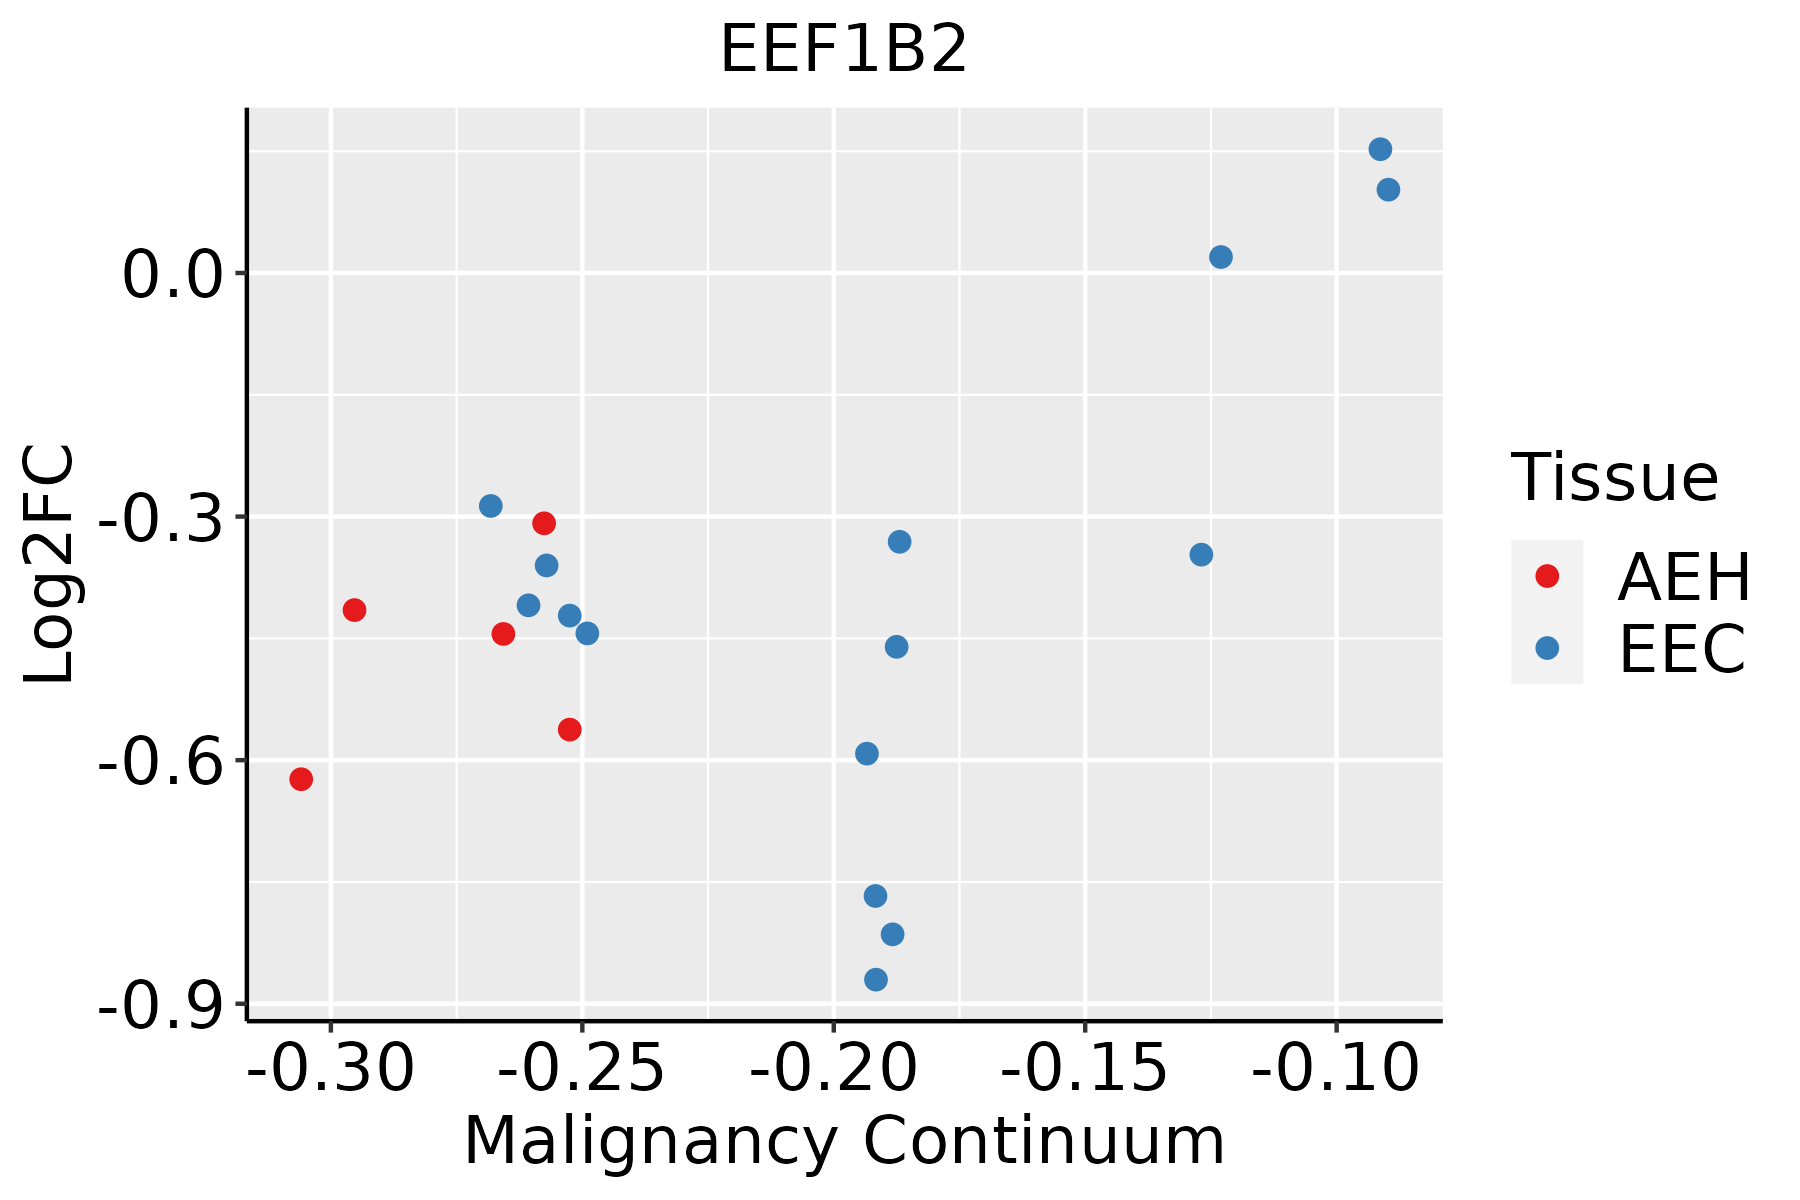 | AEH: Atypical endometrial hyperplasia |
| EEC: Endometrioid Cancer | ||
| Esophagus | 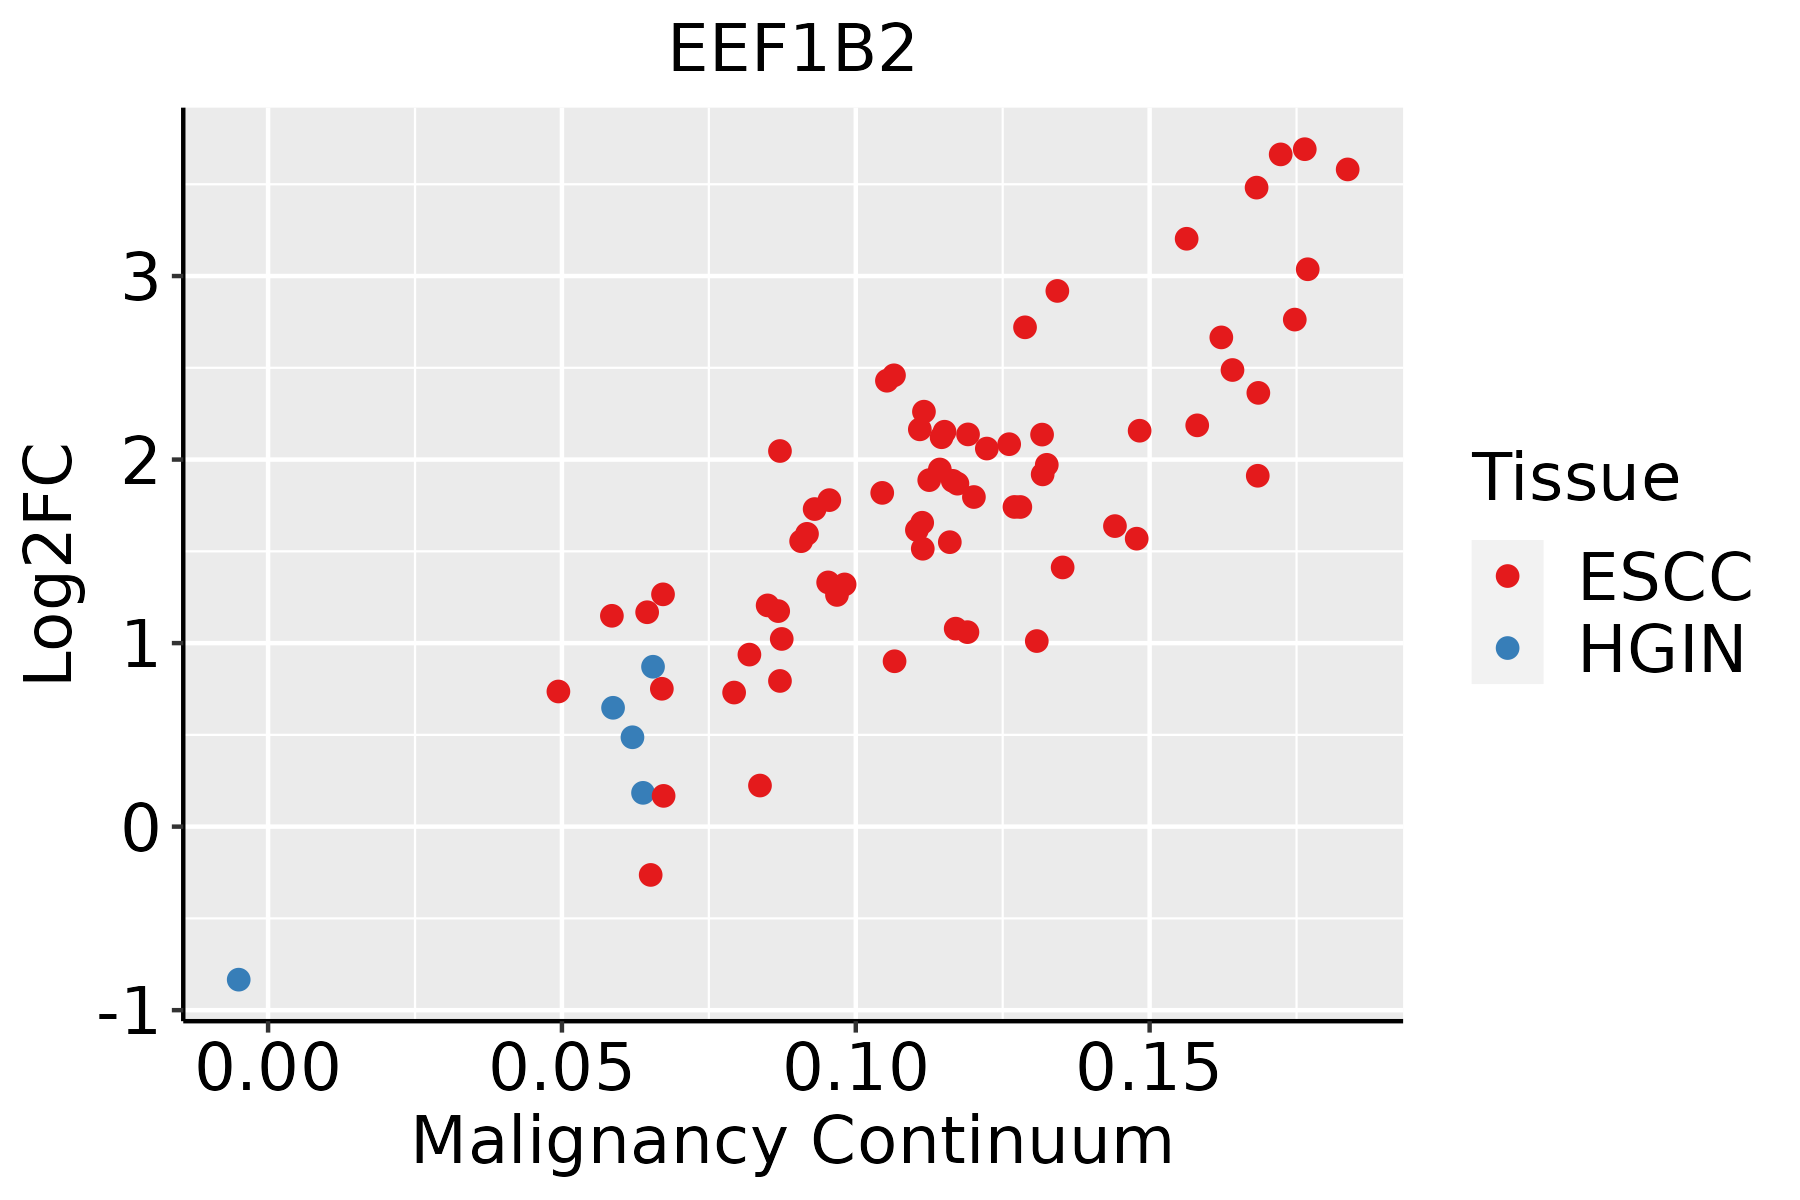 | ESCC: Esophageal squamous cell carcinoma |
| HGIN: High-grade intraepithelial neoplasias | ||
| LGIN: Low-grade intraepithelial neoplasias | ||
| Liver | 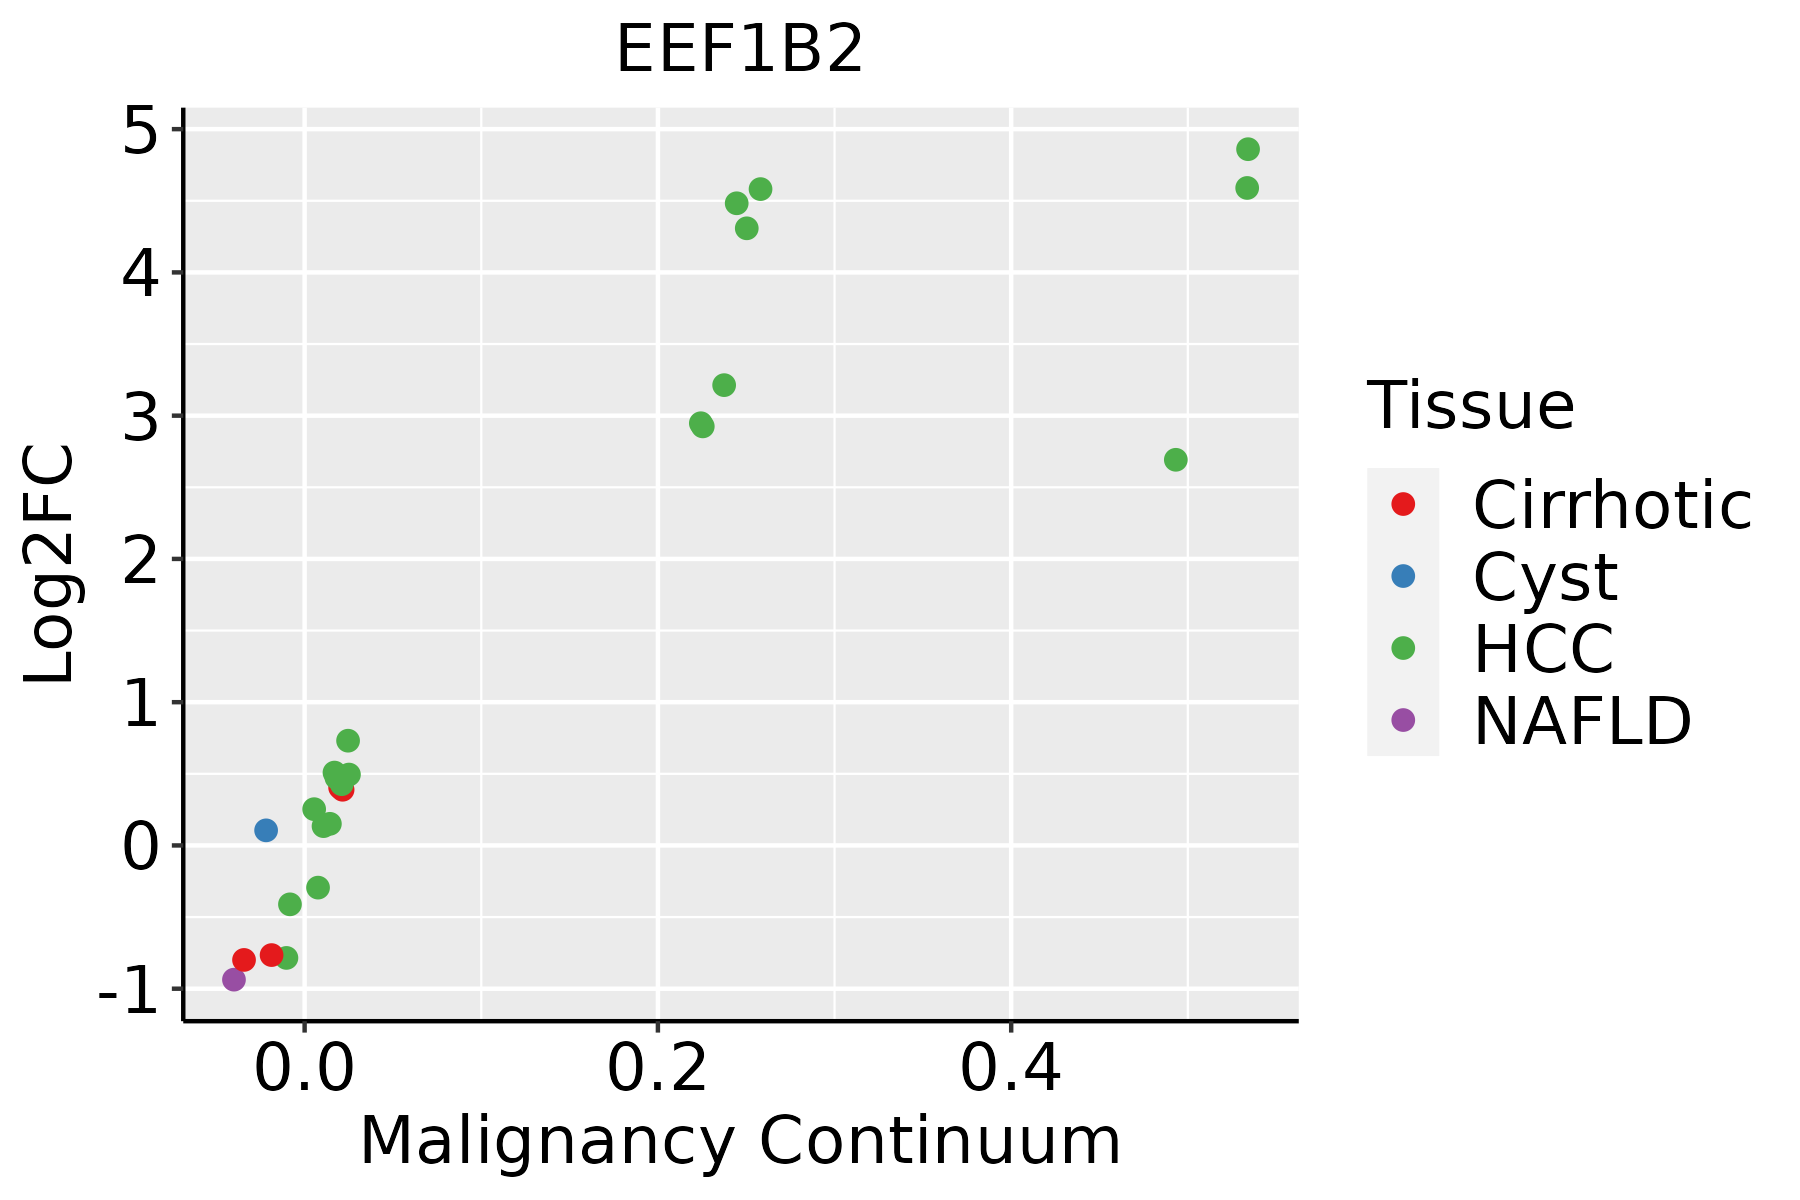 | HCC: Hepatocellular carcinoma |
| NAFLD: Non-alcoholic fatty liver disease | ||
| Lung |  | AAH: Atypical adenomatous hyperplasia |
| AIS: Adenocarcinoma in situ | ||
| IAC: Invasive lung adenocarcinoma | ||
| MIA: Minimally invasive adenocarcinoma | ||
| Oral Cavity | 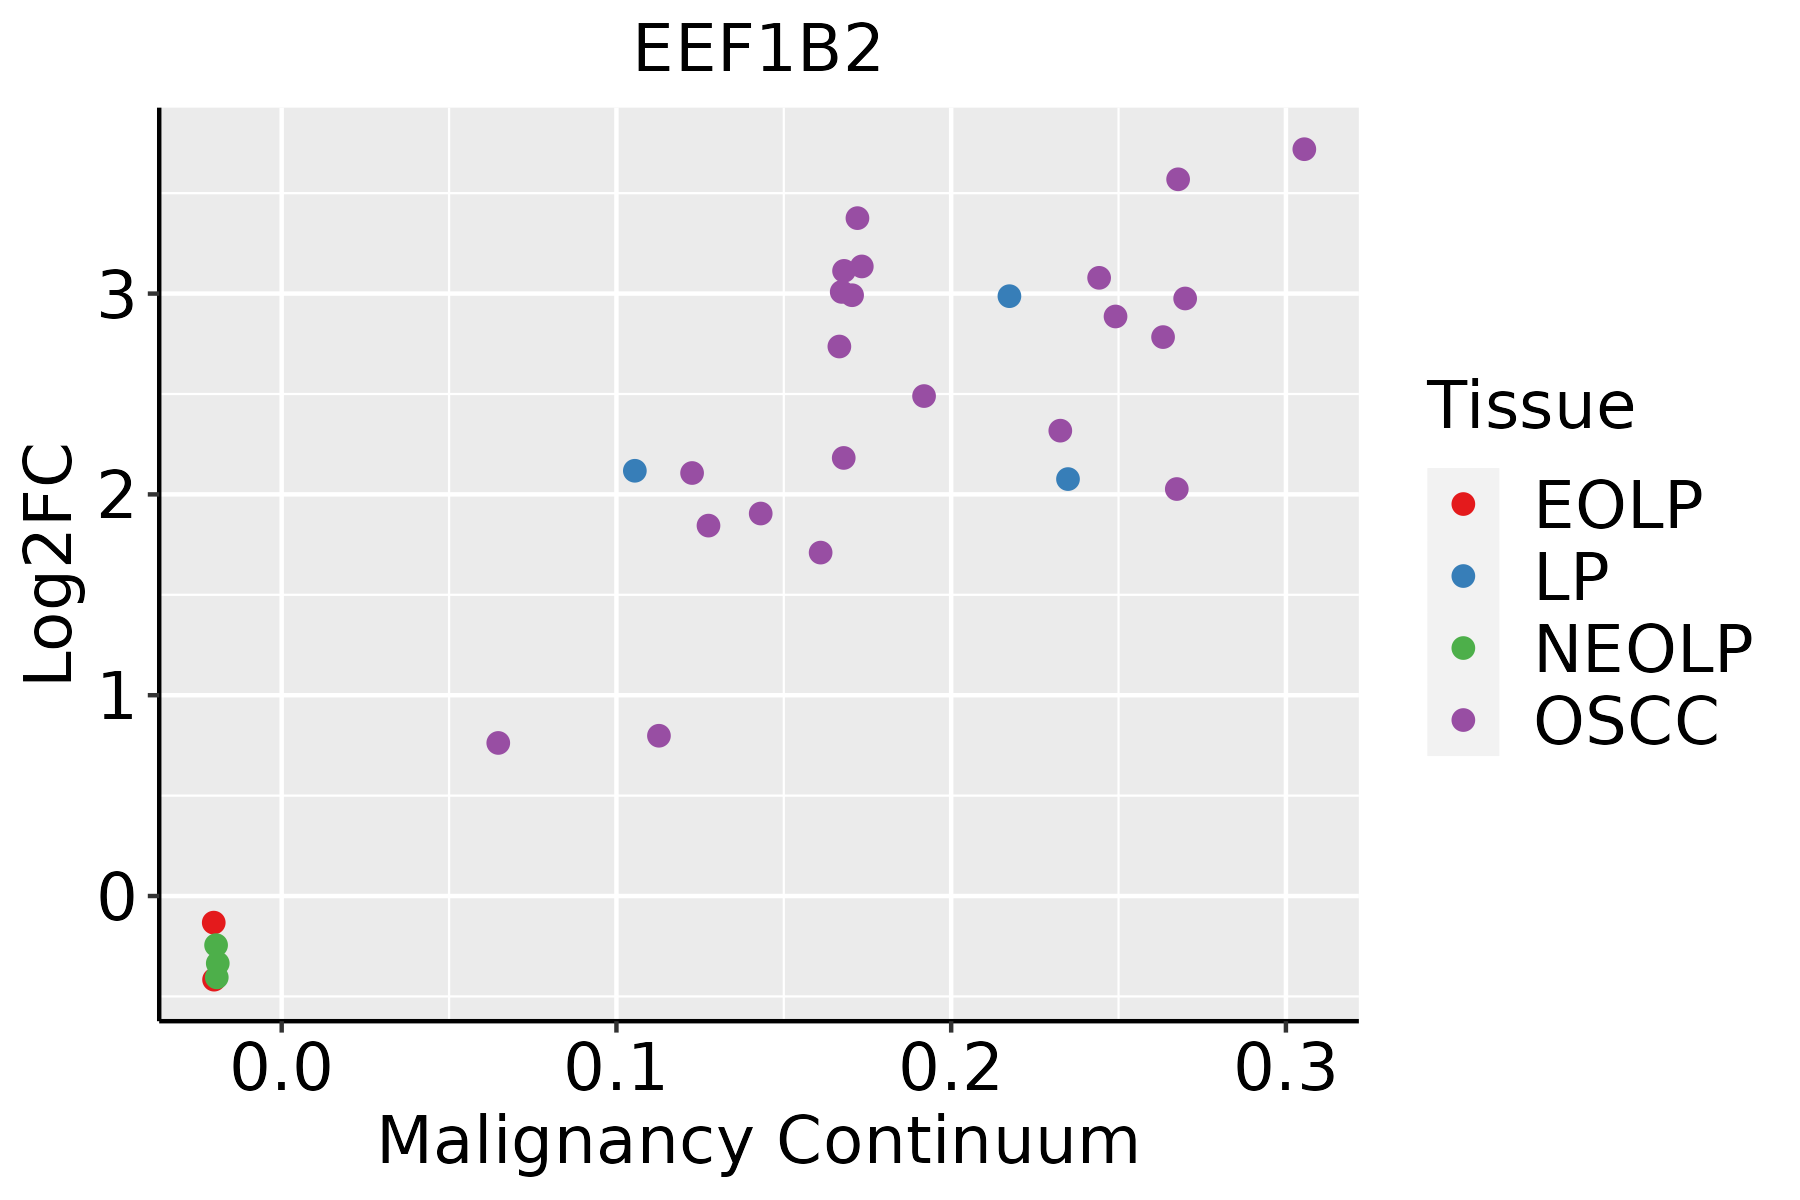 | EOLP: Erosive Oral lichen planus |
| LP: leukoplakia | ||
| NEOLP: Non-erosive oral lichen planus | ||
| OSCC: Oral squamous cell carcinoma | ||
| Prostate |  | BPH: Benign Prostatic Hyperplasia |
| Skin | 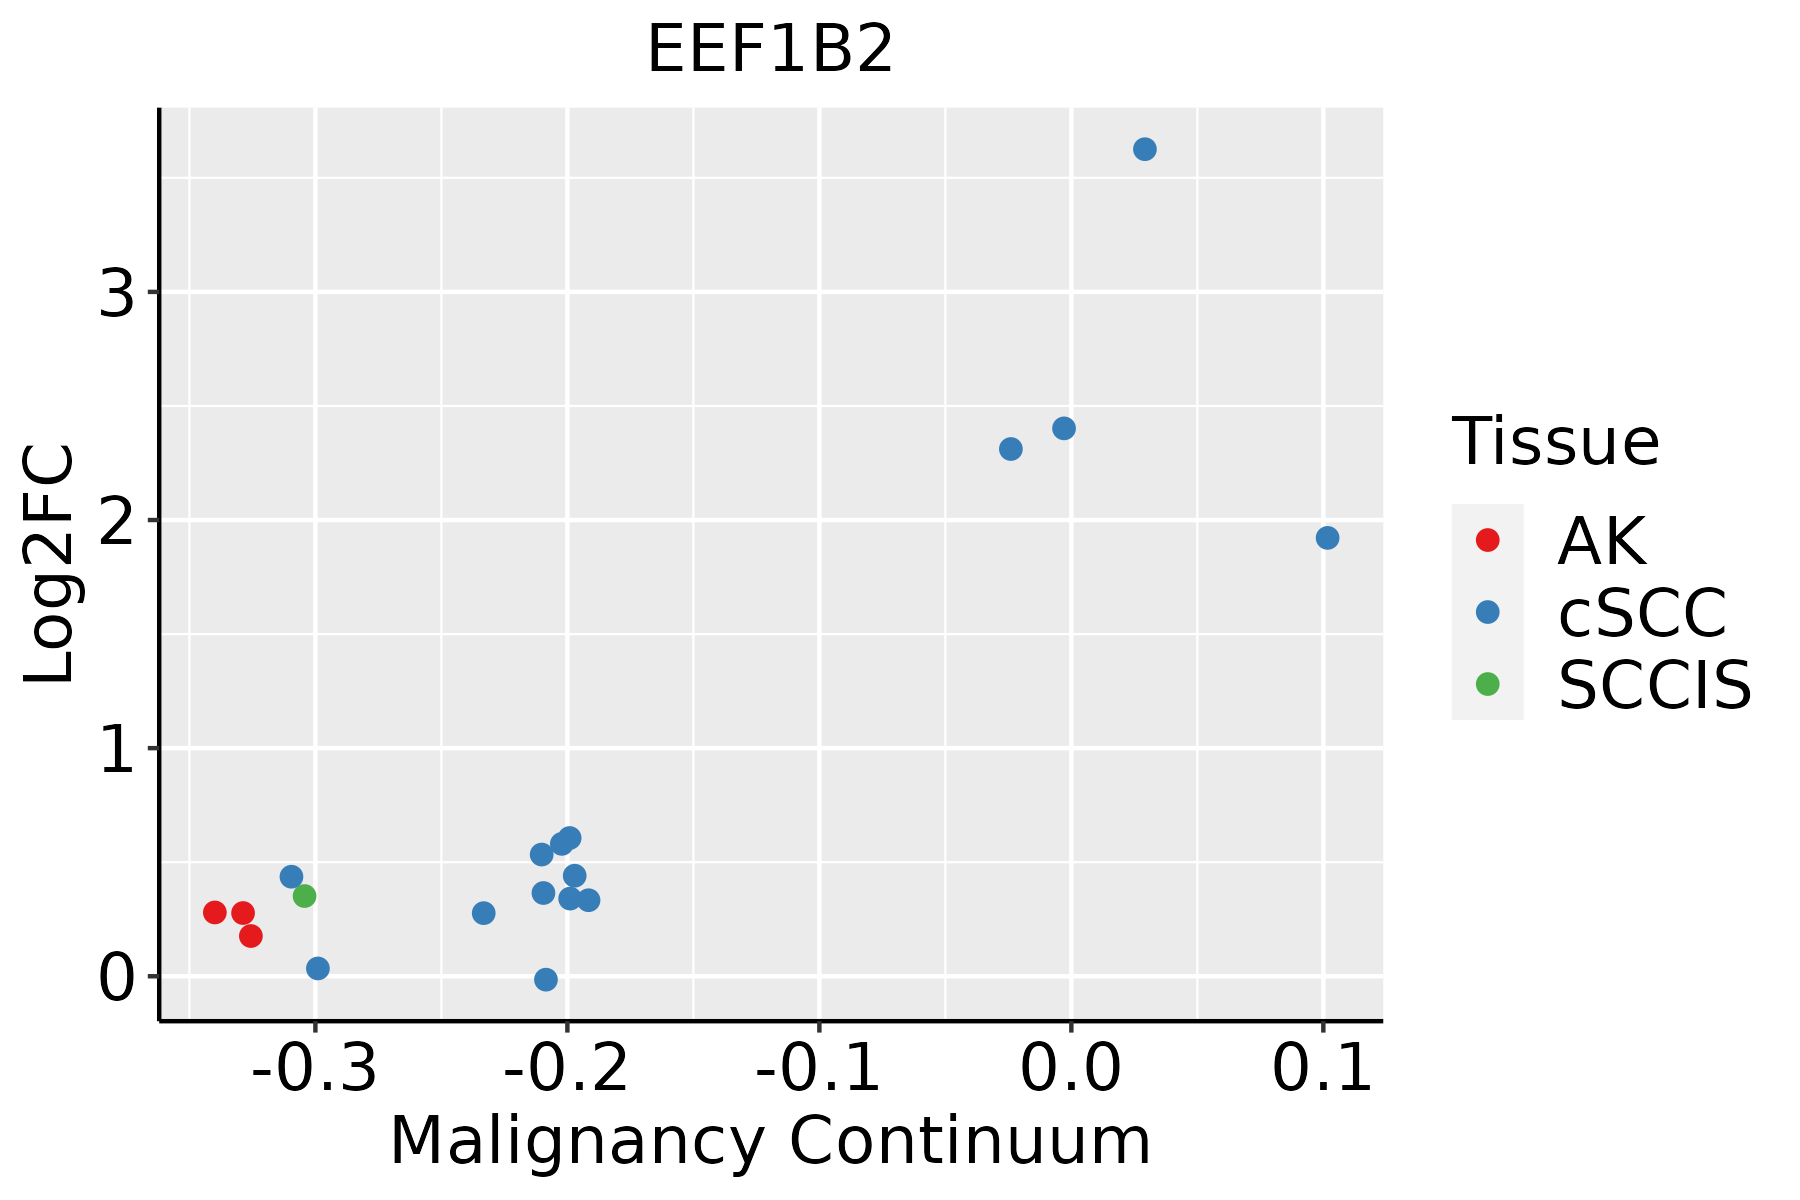 | AK: Actinic keratosis |
| cSCC: Cutaneous squamous cell carcinoma | ||
| SCCIS:squamous cell carcinoma in situ | ||
| Thyroid | 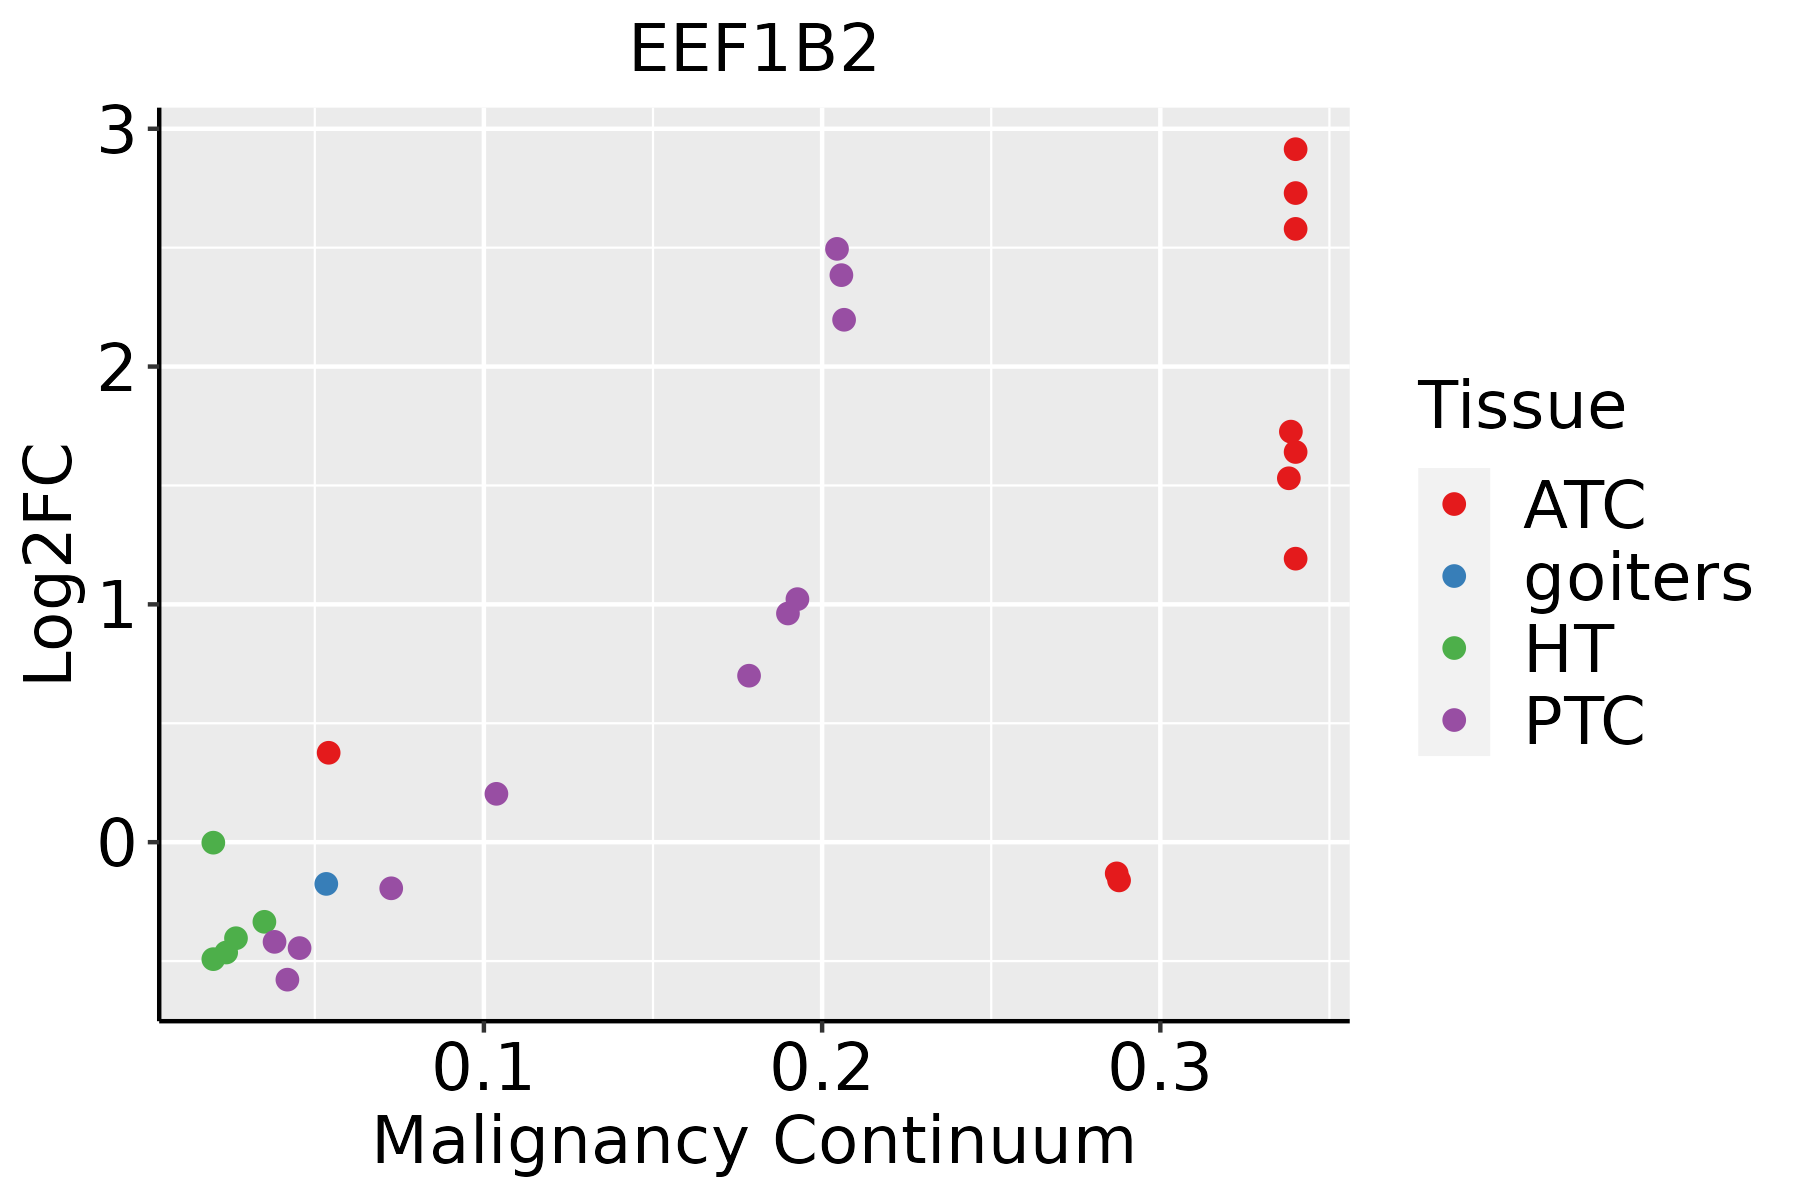 | ATC: Anaplastic thyroid cancer |
| HT: Hashimoto's thyroiditis | ||
| PTC: Papillary thyroid cancer |
| ∗log2FC in expression of this searched gene in stem-like cells from each diseased tissue sample relative to stem-like cells in normal samples in each tissue plotted against the malignancy continuum. Samples are colored based on if they are from different disease stage. |
Top |
Malignant transformation related pathway analysis |
| Find out the enriched GO biological processes and KEGG pathways involved in transition from healthy to precancer to cancer |
| Tissue | Disease Stage | Enriched GO biological Processes |
| Colorectum | AD |  |
| Colorectum | SER |  |
| Colorectum | MSS |  |
| Colorectum | MSI-H |  |
| Colorectum | FAP |  |
| ∗Top 15 enriched GO BP terms are showed in the bar plot of each disease state in each tissue. Each row represents a significant GO biological process which is colored according to the -log10(p.adjust). |
| Page: 1 2 3 4 5 6 7 8 9 |
| GO ID | Tissue | Disease Stage | Description | Gene Ratio | Bg Ratio | pvalue | p.adjust | Count |
| GO:00064147 | Breast | Precancer | translational elongation | 10/1080 | 55/18723 | 1.06e-03 | 1.18e-02 | 10 |
| GO:00973058 | Breast | Precancer | response to alcohol | 25/1080 | 253/18723 | 6.16e-03 | 4.35e-02 | 25 |
| GO:009730514 | Breast | IDC | response to alcohol | 36/1434 | 253/18723 | 2.29e-04 | 3.64e-03 | 36 |
| GO:00454713 | Breast | IDC | response to ethanol | 21/1434 | 137/18723 | 1.72e-03 | 1.67e-02 | 21 |
| GO:009730524 | Breast | DCIS | response to alcohol | 34/1390 | 253/18723 | 5.54e-04 | 7.09e-03 | 34 |
| GO:004547111 | Breast | DCIS | response to ethanol | 20/1390 | 137/18723 | 2.73e-03 | 2.40e-02 | 20 |
| GO:000641413 | Breast | DCIS | translational elongation | 10/1390 | 55/18723 | 6.66e-03 | 4.62e-02 | 10 |
| GO:00973059 | Cervix | CC | response to alcohol | 46/2311 | 253/18723 | 4.40e-03 | 2.69e-02 | 46 |
| GO:00064148 | Cervix | HSIL_HPV | translational elongation | 7/737 | 55/18723 | 5.59e-03 | 4.47e-02 | 7 |
| GO:0006414 | Colorectum | AD | translational elongation | 21/3918 | 55/18723 | 2.53e-03 | 1.93e-02 | 21 |
| GO:0097305 | Colorectum | AD | response to alcohol | 71/3918 | 253/18723 | 4.01e-03 | 2.80e-02 | 71 |
| GO:00064141 | Colorectum | SER | translational elongation | 17/2897 | 55/18723 | 3.00e-03 | 2.65e-02 | 17 |
| GO:00973051 | Colorectum | MSS | response to alcohol | 66/3467 | 253/18723 | 1.73e-03 | 1.54e-02 | 66 |
| GO:00064142 | Colorectum | MSS | translational elongation | 19/3467 | 55/18723 | 3.47e-03 | 2.59e-02 | 19 |
| GO:00973052 | Colorectum | MSI-H | response to alcohol | 33/1319 | 253/18723 | 4.53e-04 | 9.61e-03 | 33 |
| GO:00064143 | Colorectum | CRC | translational elongation | 14/2078 | 55/18723 | 2.21e-03 | 2.15e-02 | 14 |
| GO:00973054 | Colorectum | CRC | response to alcohol | 43/2078 | 253/18723 | 2.96e-03 | 2.66e-02 | 43 |
| GO:009730510 | Endometrium | AEH | response to alcohol | 48/2100 | 253/18723 | 1.80e-04 | 2.31e-03 | 48 |
| GO:00064149 | Endometrium | AEH | translational elongation | 13/2100 | 55/18723 | 6.76e-03 | 3.94e-02 | 13 |
| GO:009730516 | Endometrium | EEC | response to alcohol | 49/2168 | 253/18723 | 1.99e-04 | 2.42e-03 | 49 |
| Page: 1 2 3 |
| Pathway ID | Tissue | Disease Stage | Description | Gene Ratio | Bg Ratio | pvalue | p.adjust | qvalue | Count |
| Page: 1 |
Top |
Cell-cell communication analysis |
| Identification of potential cell-cell interactions between two cell types and their ligand-receptor pairs for different disease states |
| Ligand | Receptor | LRpair | Pathway | Tissue | Disease Stage |
| Page: 1 |
Top |
Single-cell gene regulatory network inference analysis |
| Find out the significant the regulons (TFs) and the target genes of each regulon across cell types for different disease states |
| TF | Cell Type | Tissue | Disease Stage | Target Gene | RSS | Regulon Activity |
| ∗The dot plots of a searched regulon are shown for all cell subpopulations in each disease state of each tissue based on the regulon specific score inferred using pySCENIC and by calculating the average expression. |
| Page: 1 |
Top |
Somatic mutation of malignant transformation related genes |
| Annotation of somatic variants for genes involved in malignant transformation |
| Hugo Symbol | Variant Class | Variant Classification | dbSNP RS | HGVSc | HGVSp | HGVSp Short | SWISSPROT | BIOTYPE | SIFT | PolyPhen | Tumor Sample Barcode | Tissue | Histology | Sex | Age | Stage | Therapy Types | Drugs | Outcome |
| EEF1B2 | SNV | Missense_Mutation | novel | c.245C>T | p.Ala82Val | p.A82V | P24534 | protein_coding | tolerated(0.1) | benign(0.021) | TCGA-A2-A4S3-01 | Breast | breast invasive carcinoma | Female | <65 | I/II | Unknown | Unknown | SD |
| EEF1B2 | SNV | Missense_Mutation | rs767990866 | c.675N>G | p.Ile225Met | p.I225M | P24534 | protein_coding | deleterious(0) | possibly_damaging(0.685) | TCGA-BH-A18J-01 | Breast | breast invasive carcinoma | Female | <65 | III/IV | Unknown | Unknown | PD |
| EEF1B2 | SNV | Missense_Mutation | c.610N>C | p.Glu204Gln | p.E204Q | P24534 | protein_coding | tolerated(0.68) | benign(0.035) | TCGA-EK-A2RN-01 | Cervix | cervical & endocervical cancer | Female | <65 | I/II | Unknown | Unknown | SD | |
| EEF1B2 | SNV | Missense_Mutation | novel | c.281N>G | p.Asp94Gly | p.D94G | P24534 | protein_coding | tolerated(0.14) | benign(0) | TCGA-CA-6717-01 | Colorectum | colon adenocarcinoma | Male | <65 | I/II | Chemotherapy | oxaliplatin | CR |
| EEF1B2 | SNV | Missense_Mutation | c.66G>T | p.Lys22Asn | p.K22N | P24534 | protein_coding | tolerated(0.07) | benign(0.072) | TCGA-CM-4752-01 | Colorectum | colon adenocarcinoma | Male | <65 | I/II | Unknown | Unknown | SD | |
| EEF1B2 | SNV | Missense_Mutation | c.601N>C | p.Asp201His | p.D201H | P24534 | protein_coding | deleterious(0) | probably_damaging(0.987) | TCGA-AF-2687-01 | Colorectum | rectum adenocarcinoma | Male | <65 | III/IV | Chemotherapy | xeloda | PD | |
| EEF1B2 | SNV | Missense_Mutation | novel | c.203N>T | p.Ser68Ile | p.S68I | P24534 | protein_coding | deleterious(0.02) | possibly_damaging(0.474) | TCGA-AJ-A3EL-01 | Endometrium | uterine corpus endometrioid carcinoma | Female | <65 | I/II | Unknown | Unknown | SD |
| EEF1B2 | SNV | Missense_Mutation | novel | c.219N>T | p.Lys73Asn | p.K73N | P24534 | protein_coding | deleterious(0.03) | benign(0.052) | TCGA-AX-A1CE-01 | Endometrium | uterine corpus endometrioid carcinoma | Female | <65 | I/II | Unspecific | Paclitaxel | SD |
| EEF1B2 | SNV | Missense_Mutation | c.365N>A | p.Arg122His | p.R122H | P24534 | protein_coding | tolerated(0.06) | benign(0.24) | TCGA-AX-A1CE-01 | Endometrium | uterine corpus endometrioid carcinoma | Female | <65 | I/II | Unspecific | Paclitaxel | SD | |
| EEF1B2 | SNV | Missense_Mutation | novel | c.541N>A | p.Gly181Arg | p.G181R | P24534 | protein_coding | deleterious(0.03) | probably_damaging(0.99) | TCGA-AX-A3G8-01 | Endometrium | uterine corpus endometrioid carcinoma | Female | >=65 | I/II | Unknown | Unknown | SD |
| Page: 1 2 3 |
Top |
Related drugs of malignant transformation related genes |
| Identification of chemicals and drugs interact with genes involved in malignant transfromation |
| (DGIdb 4.0) |
| Entrez ID | Symbol | Category | Interaction Types | Drug Claim Name | Drug Name | PMIDs |
| Page: 1 |

Copyright 2023-Present -The University of Texas Health Science Center at Houston |