
|
|||||
|
 | |
| |
| |
| |
| |
| |
|
Gene: EEF1A2 |
Gene summary for EEF1A2 |
| Gene information | Species | Human | Gene symbol | EEF1A2 | Gene ID | 1917 |
| Gene name | eukaryotic translation elongation factor 1 alpha 2 | |
| Gene Alias | DEE33 | |
| Cytomap | 20q13.33 | |
| Gene Type | protein-coding | GO ID | GO:0006412 | UniProtAcc | Q05639 |
Top |
Malignant transformation analysis |
| Identification of the aberrant gene expression in precancerous and cancerous lesions by comparing the gene expression of stem-like cells in diseased tissues with normal stem cells |
| Entrez ID | Symbol | Replicates | Species | Organ | Tissue | Adj P-value | Log2FC | Malignancy |
| 1917 | EEF1A2 | GSM4909293 | Human | Breast | IDC | 1.42e-02 | 1.33e-01 | 0.1581 |
| 1917 | EEF1A2 | GSM4909304 | Human | Breast | IDC | 2.89e-57 | 8.84e-01 | 0.1636 |
| 1917 | EEF1A2 | GSM4909316 | Human | Breast | IDC | 2.49e-03 | 3.60e-01 | 0.21 |
| 1917 | EEF1A2 | GSM4909321 | Human | Breast | IDC | 1.49e-06 | 2.75e-01 | 0.1559 |
| 1917 | EEF1A2 | brca3 | Human | Breast | Precancer | 1.59e-11 | 2.62e-01 | -0.0263 |
| 1917 | EEF1A2 | M2 | Human | Breast | IDC | 4.93e-03 | 3.87e-01 | 0.21 |
| 1917 | EEF1A2 | M5 | Human | Breast | IDC | 1.76e-08 | 6.31e-01 | 0.1598 |
| 1917 | EEF1A2 | NCCBC2 | Human | Breast | DCIS | 6.53e-10 | 8.02e-01 | 0.1554 |
| 1917 | EEF1A2 | P3 | Human | Breast | IDC | 1.06e-06 | 5.16e-01 | 0.1542 |
| Page: 1 |
| Tissue | Expression Dynamics | Abbreviation |
| Breast | 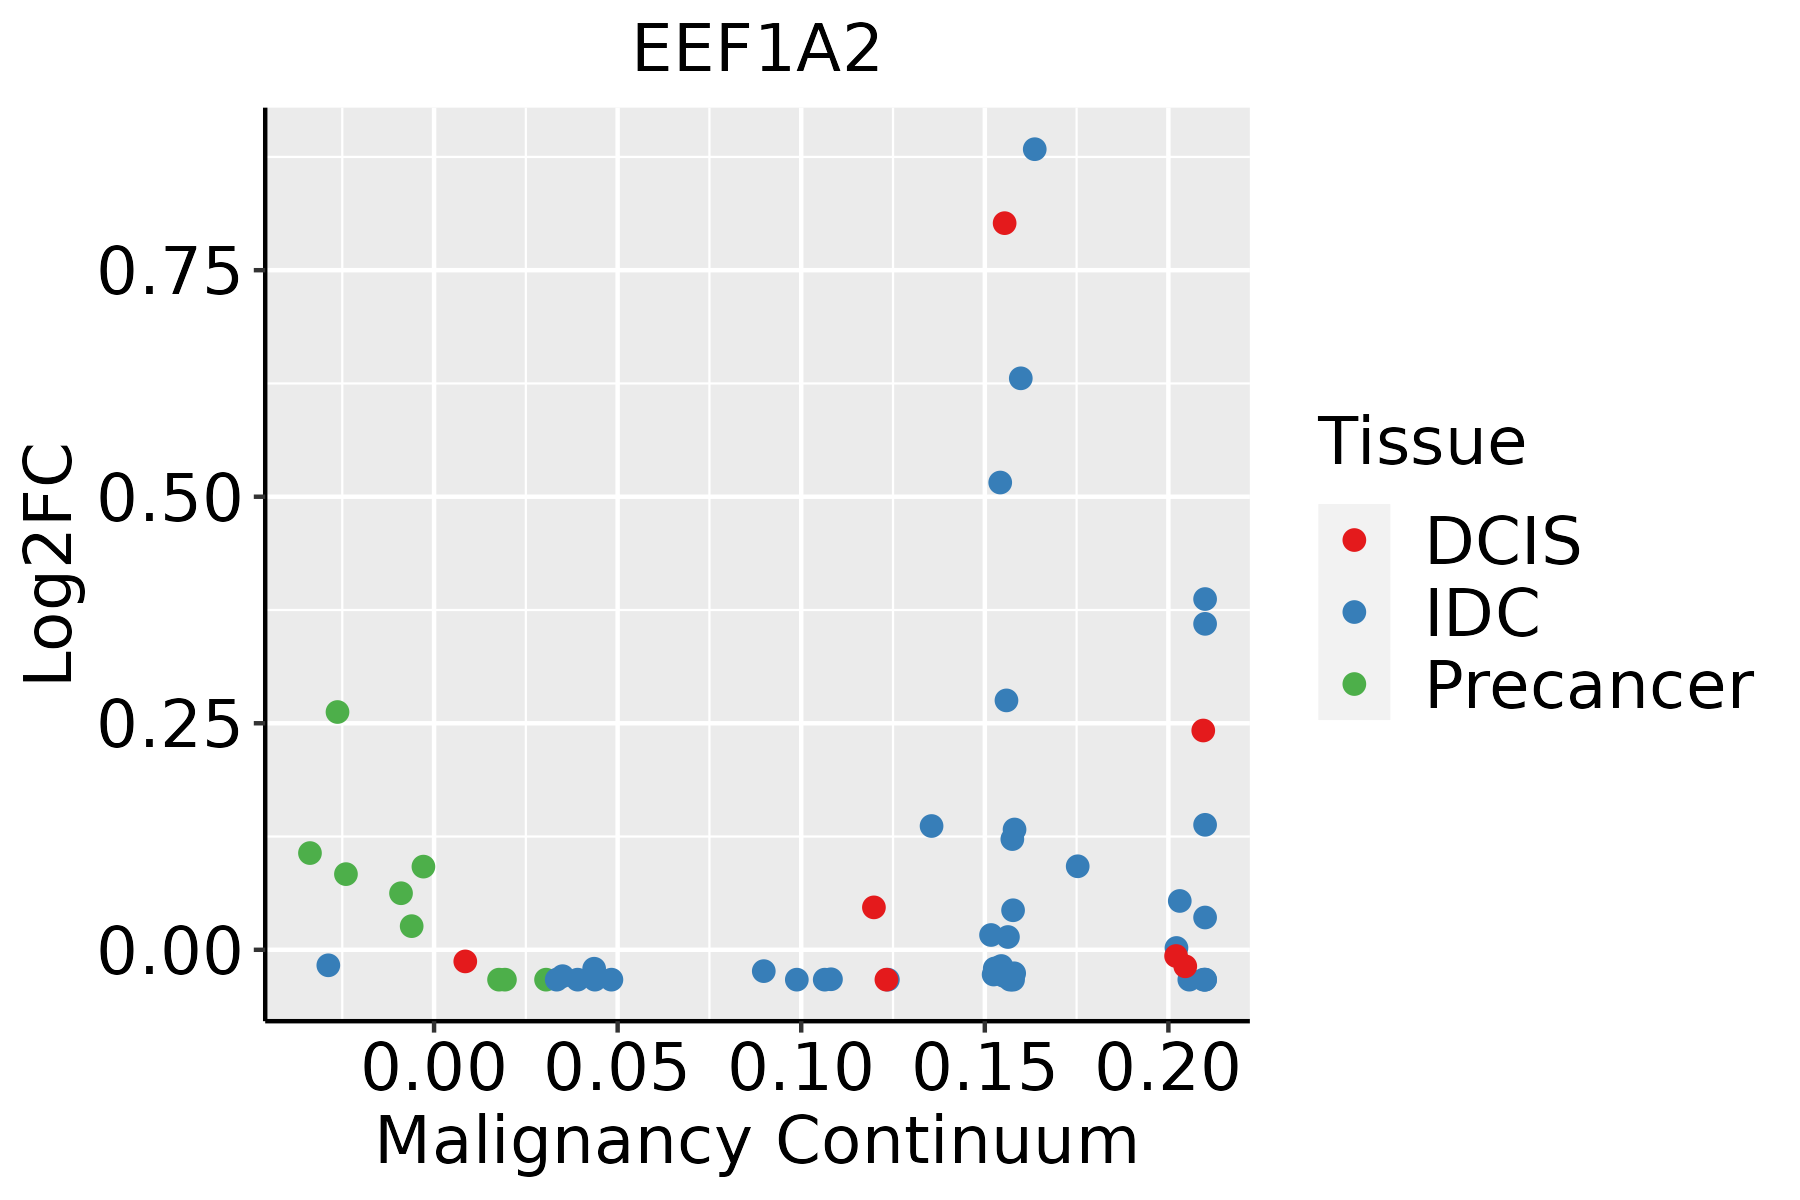 | IDC: Invasive ductal carcinoma |
| DCIS: Ductal carcinoma in situ | ||
| Precancer(BRCA1-mut): Precancerous lesion from BRCA1 mutation carriers |
| ∗log2FC in expression of this searched gene in stem-like cells from each diseased tissue sample relative to stem-like cells in normal samples in each tissue plotted against the malignancy continuum. Samples are colored based on if they are from different disease stage. |
Top |
Malignant transformation related pathway analysis |
| Find out the enriched GO biological processes and KEGG pathways involved in transition from healthy to precancer to cancer |
| Tissue | Disease Stage | Enriched GO biological Processes |
| Colorectum | AD |  |
| Colorectum | SER |  |
| Colorectum | MSS |  |
| Colorectum | MSI-H |  |
| Colorectum | FAP |  |
| ∗Top 15 enriched GO BP terms are showed in the bar plot of each disease state in each tissue. Each row represents a significant GO biological process which is colored according to the -log10(p.adjust). |
| Page: 1 2 3 4 5 6 7 8 9 |
| GO ID | Tissue | Disease Stage | Description | Gene Ratio | Bg Ratio | pvalue | p.adjust | Count |
| GO:00421769 | Breast | Precancer | regulation of protein catabolic process | 47/1080 | 391/18723 | 1.50e-06 | 5.58e-05 | 47 |
| GO:00192164 | Breast | Precancer | regulation of lipid metabolic process | 34/1080 | 331/18723 | 8.14e-04 | 9.55e-03 | 34 |
| GO:00064147 | Breast | Precancer | translational elongation | 10/1080 | 55/18723 | 1.06e-03 | 1.18e-02 | 10 |
| GO:00616846 | Breast | Precancer | chaperone-mediated autophagy | 5/1080 | 16/18723 | 1.62e-03 | 1.64e-02 | 5 |
| GO:00336749 | Breast | Precancer | positive regulation of kinase activity | 42/1080 | 467/18723 | 2.94e-03 | 2.54e-02 | 42 |
| GO:004217614 | Breast | IDC | regulation of protein catabolic process | 63/1434 | 391/18723 | 1.32e-08 | 9.61e-07 | 63 |
| GO:001921612 | Breast | IDC | regulation of lipid metabolic process | 45/1434 | 331/18723 | 1.21e-04 | 2.24e-03 | 45 |
| GO:006168411 | Breast | IDC | chaperone-mediated autophagy | 6/1434 | 16/18723 | 8.18e-04 | 9.64e-03 | 6 |
| GO:004217624 | Breast | DCIS | regulation of protein catabolic process | 62/1390 | 391/18723 | 9.98e-09 | 7.53e-07 | 62 |
| GO:001921621 | Breast | DCIS | regulation of lipid metabolic process | 43/1390 | 331/18723 | 2.37e-04 | 3.71e-03 | 43 |
| GO:006168421 | Breast | DCIS | chaperone-mediated autophagy | 6/1390 | 16/18723 | 6.93e-04 | 8.45e-03 | 6 |
| GO:000641413 | Breast | DCIS | translational elongation | 10/1390 | 55/18723 | 6.66e-03 | 4.62e-02 | 10 |
| Page: 1 |
| Pathway ID | Tissue | Disease Stage | Description | Gene Ratio | Bg Ratio | pvalue | p.adjust | qvalue | Count |
| hsa0513441 | Breast | DCIS | Legionellosis | 19/846 | 57/8465 | 1.30e-06 | 2.10e-05 | 1.55e-05 | 19 |
| hsa0514021 | Breast | DCIS | Leishmaniasis | 17/846 | 77/8465 | 1.29e-03 | 9.06e-03 | 6.67e-03 | 17 |
| hsa0513451 | Breast | DCIS | Legionellosis | 19/846 | 57/8465 | 1.30e-06 | 2.10e-05 | 1.55e-05 | 19 |
| hsa0514031 | Breast | DCIS | Leishmaniasis | 17/846 | 77/8465 | 1.29e-03 | 9.06e-03 | 6.67e-03 | 17 |
| Page: 1 |
Top |
Cell-cell communication analysis |
| Identification of potential cell-cell interactions between two cell types and their ligand-receptor pairs for different disease states |
| Ligand | Receptor | LRpair | Pathway | Tissue | Disease Stage |
| Page: 1 |
Top |
Single-cell gene regulatory network inference analysis |
| Find out the significant the regulons (TFs) and the target genes of each regulon across cell types for different disease states |
| TF | Cell Type | Tissue | Disease Stage | Target Gene | RSS | Regulon Activity |
| ∗The dot plots of a searched regulon are shown for all cell subpopulations in each disease state of each tissue based on the regulon specific score inferred using pySCENIC and by calculating the average expression. |
| Page: 1 |
Top |
Somatic mutation of malignant transformation related genes |
| Annotation of somatic variants for genes involved in malignant transformation |
| Hugo Symbol | Variant Class | Variant Classification | dbSNP RS | HGVSc | HGVSp | HGVSp Short | SWISSPROT | BIOTYPE | SIFT | PolyPhen | Tumor Sample Barcode | Tissue | Histology | Sex | Age | Stage | Therapy Types | Drugs | Outcome |
| EEF1A2 | SNV | Missense_Mutation | c.1012N>T | p.Ala338Ser | p.A338S | Q05639 | protein_coding | tolerated_low_confidence(0.11) | benign(0.022) | TCGA-A7-A4SF-01 | Breast | breast invasive carcinoma | Female | <65 | I/II | Chemotherapy | carboplatin | CR | |
| EEF1A2 | SNV | Missense_Mutation | c.30C>G | p.Ile10Met | p.I10M | Q05639 | protein_coding | deleterious_low_confidence(0.01) | possibly_damaging(0.665) | TCGA-AC-A23H-01 | Breast | breast invasive carcinoma | Female | >=65 | I/II | Unknown | Unknown | PD | |
| EEF1A2 | SNV | Missense_Mutation | novel | c.917N>T | p.Asp306Val | p.D306V | Q05639 | protein_coding | deleterious_low_confidence(0) | probably_damaging(0.976) | TCGA-AC-A3W5-01 | Breast | breast invasive carcinoma | Female | >=65 | I/II | Chemotherapy | docetaxel | CR |
| EEF1A2 | SNV | Missense_Mutation | novel | c.1196N>A | p.Ala399Glu | p.A399E | Q05639 | protein_coding | deleterious_low_confidence(0) | probably_damaging(0.993) | TCGA-BH-A0BW-01 | Breast | breast invasive carcinoma | Female | >=65 | I/II | Chemotherapy | adriamycin | CR |
| EEF1A2 | SNV | Missense_Mutation | novel | c.718C>T | p.Arg240Cys | p.R240C | Q05639 | protein_coding | tolerated_low_confidence(0.08) | benign(0.007) | TCGA-OL-A5RX-01 | Breast | breast invasive carcinoma | Female | <65 | I/II | Unknown | Unknown | SD |
| EEF1A2 | SNV | Missense_Mutation | rs778585590 | c.667N>A | p.Ala223Thr | p.A223T | Q05639 | protein_coding | tolerated_low_confidence(0.05) | benign(0.079) | TCGA-2W-A8YY-01 | Cervix | cervical & endocervical cancer | Female | <65 | I/II | Chemotherapy | cisplatin | CR |
| EEF1A2 | SNV | Missense_Mutation | novel | c.662N>A | p.Gly221Asp | p.G221D | Q05639 | protein_coding | deleterious_low_confidence(0.02) | possibly_damaging(0.777) | TCGA-EA-A410-01 | Cervix | cervical & endocervical cancer | Female | <65 | I/II | Unknown | Unknown | SD |
| EEF1A2 | SNV | Missense_Mutation | c.901G>A | p.Glu301Lys | p.E301K | Q05639 | protein_coding | tolerated_low_confidence(0.06) | benign(0.117) | TCGA-MY-A5BD-01 | Cervix | cervical & endocervical cancer | Female | <65 | I/II | Chemotherapy | cisplatin | CR | |
| EEF1A2 | SNV | Missense_Mutation | c.391N>A | p.Gly131Arg | p.G131R | Q05639 | protein_coding | deleterious_low_confidence(0.02) | possibly_damaging(0.5) | TCGA-A6-5665-01 | Colorectum | colon adenocarcinoma | Female | >=65 | I/II | Unknown | Unknown | PD | |
| EEF1A2 | SNV | Missense_Mutation | c.454G>A | p.Val152Met | p.V152M | Q05639 | protein_coding | deleterious_low_confidence(0.01) | possibly_damaging(0.902) | TCGA-A6-6653-01 | Colorectum | colon adenocarcinoma | Male | >=65 | I/II | Unknown | Unknown | SD |
| Page: 1 2 3 4 5 6 7 |
Top |
Related drugs of malignant transformation related genes |
| Identification of chemicals and drugs interact with genes involved in malignant transfromation |
| (DGIdb 4.0) |
| Entrez ID | Symbol | Category | Interaction Types | Drug Claim Name | Drug Name | PMIDs |
| Page: 1 |

Copyright 2023-Present -The University of Texas Health Science Center at Houston |