
|
|||||
|
 | |
| |
| |
| |
| |
| |
|
Gene: EEF1A1 |
Gene summary for EEF1A1 |
| Gene information | Species | Human | Gene symbol | EEF1A1 | Gene ID | 1915 |
| Gene name | eukaryotic translation elongation factor 1 alpha 1 | |
| Gene Alias | CCS-3 | |
| Cytomap | 6q13 | |
| Gene Type | protein-coding | GO ID | GO:0006412 | UniProtAcc | P68104 |
Top |
Malignant transformation analysis |
| Identification of the aberrant gene expression in precancerous and cancerous lesions by comparing the gene expression of stem-like cells in diseased tissues with normal stem cells |
| Entrez ID | Symbol | Replicates | Species | Organ | Tissue | Adj P-value | Log2FC | Malignancy |
| 1915 | EEF1A1 | GSM4909277 | Human | Breast | Precancer | 1.35e-02 | -2.09e-01 | 0.0177 |
| 1915 | EEF1A1 | GSM4909280 | Human | Breast | Precancer | 6.37e-11 | -2.95e-01 | 0.0305 |
| 1915 | EEF1A1 | GSM4909281 | Human | Breast | IDC | 1.54e-22 | -1.57e-01 | 0.21 |
| 1915 | EEF1A1 | GSM4909282 | Human | Breast | IDC | 5.70e-11 | -9.56e-02 | -0.0288 |
| 1915 | EEF1A1 | GSM4909285 | Human | Breast | IDC | 7.41e-23 | 1.54e-01 | 0.21 |
| 1915 | EEF1A1 | GSM4909287 | Human | Breast | IDC | 1.63e-21 | -1.84e-01 | 0.2057 |
| 1915 | EEF1A1 | GSM4909289 | Human | Breast | IDC | 1.15e-04 | -1.43e-01 | 0.1064 |
| 1915 | EEF1A1 | GSM4909290 | Human | Breast | IDC | 1.90e-22 | -1.67e-01 | 0.2096 |
| 1915 | EEF1A1 | GSM4909291 | Human | Breast | IDC | 6.53e-80 | -4.75e-01 | 0.1753 |
| 1915 | EEF1A1 | GSM4909292 | Human | Breast | IDC | 1.53e-17 | -3.87e-01 | 0.1236 |
| 1915 | EEF1A1 | GSM4909294 | Human | Breast | IDC | 1.28e-04 | -6.44e-02 | 0.2022 |
| 1915 | EEF1A1 | GSM4909295 | Human | Breast | IDC | 6.06e-14 | -1.96e-01 | 0.0898 |
| 1915 | EEF1A1 | GSM4909296 | Human | Breast | IDC | 2.59e-112 | -5.20e-01 | 0.1524 |
| 1915 | EEF1A1 | GSM4909297 | Human | Breast | IDC | 9.40e-24 | -1.71e-01 | 0.1517 |
| 1915 | EEF1A1 | GSM4909301 | Human | Breast | IDC | 1.19e-78 | -3.01e-01 | 0.1577 |
| 1915 | EEF1A1 | GSM4909302 | Human | Breast | IDC | 1.23e-28 | -2.12e-01 | 0.1545 |
| 1915 | EEF1A1 | GSM4909304 | Human | Breast | IDC | 2.00e-72 | -2.47e-01 | 0.1636 |
| 1915 | EEF1A1 | GSM4909306 | Human | Breast | IDC | 1.45e-09 | -8.82e-02 | 0.1564 |
| 1915 | EEF1A1 | GSM4909308 | Human | Breast | IDC | 9.11e-08 | 8.92e-02 | 0.158 |
| 1915 | EEF1A1 | GSM4909309 | Human | Breast | IDC | 3.25e-35 | -2.90e-01 | 0.0483 |
| Page: 1 2 3 4 5 6 7 8 9 10 11 12 13 14 15 16 17 18 19 |
| Tissue | Expression Dynamics | Abbreviation |
| Breast |  | IDC: Invasive ductal carcinoma |
| DCIS: Ductal carcinoma in situ | ||
| Precancer(BRCA1-mut): Precancerous lesion from BRCA1 mutation carriers | ||
| Cervix | 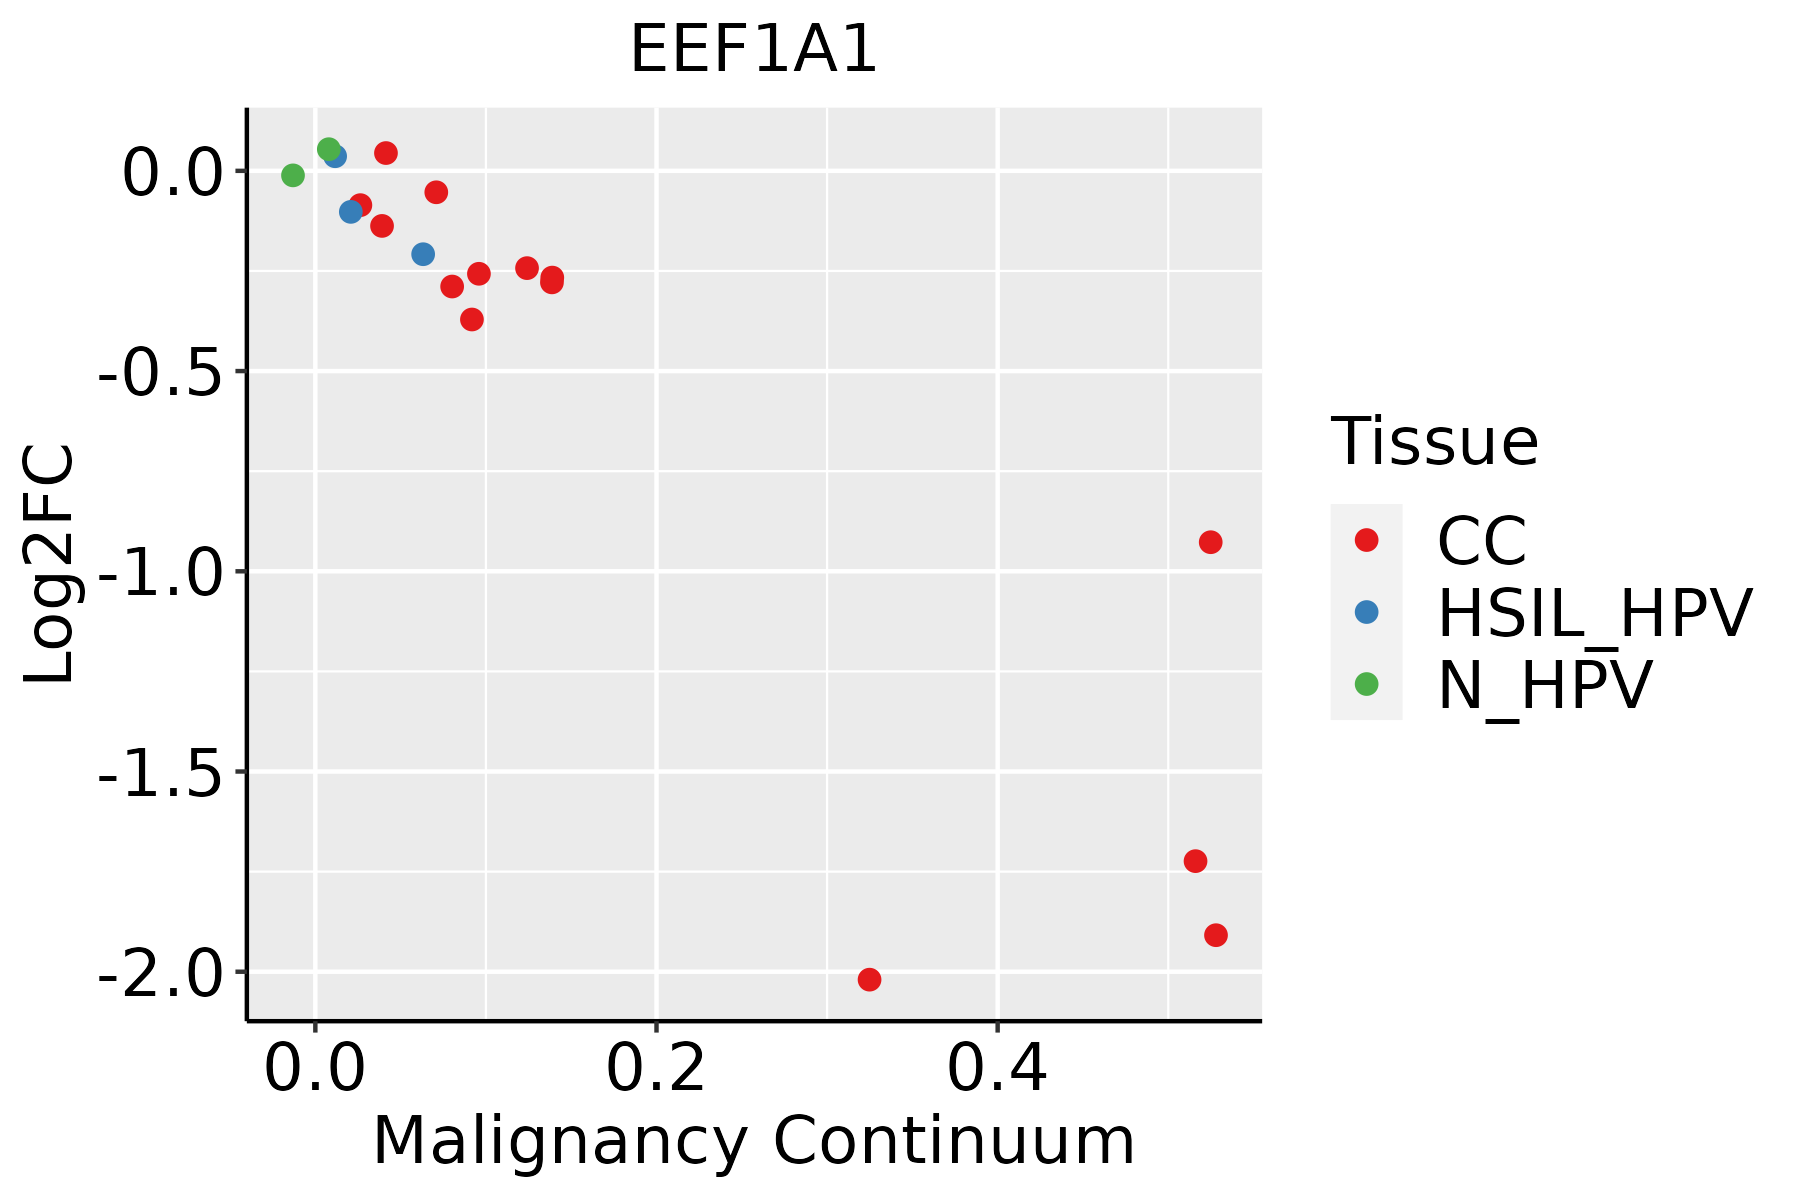 | CC: Cervix cancer |
| HSIL_HPV: HPV-infected high-grade squamous intraepithelial lesions | ||
| N_HPV: HPV-infected normal cervix | ||
| Colorectum (GSE201348) |  | FAP: Familial adenomatous polyposis |
| CRC: Colorectal cancer | ||
| Colorectum (HTA11) |  | AD: Adenomas |
| SER: Sessile serrated lesions | ||
| MSI-H: Microsatellite-high colorectal cancer | ||
| MSS: Microsatellite stable colorectal cancer | ||
| Endometrium | 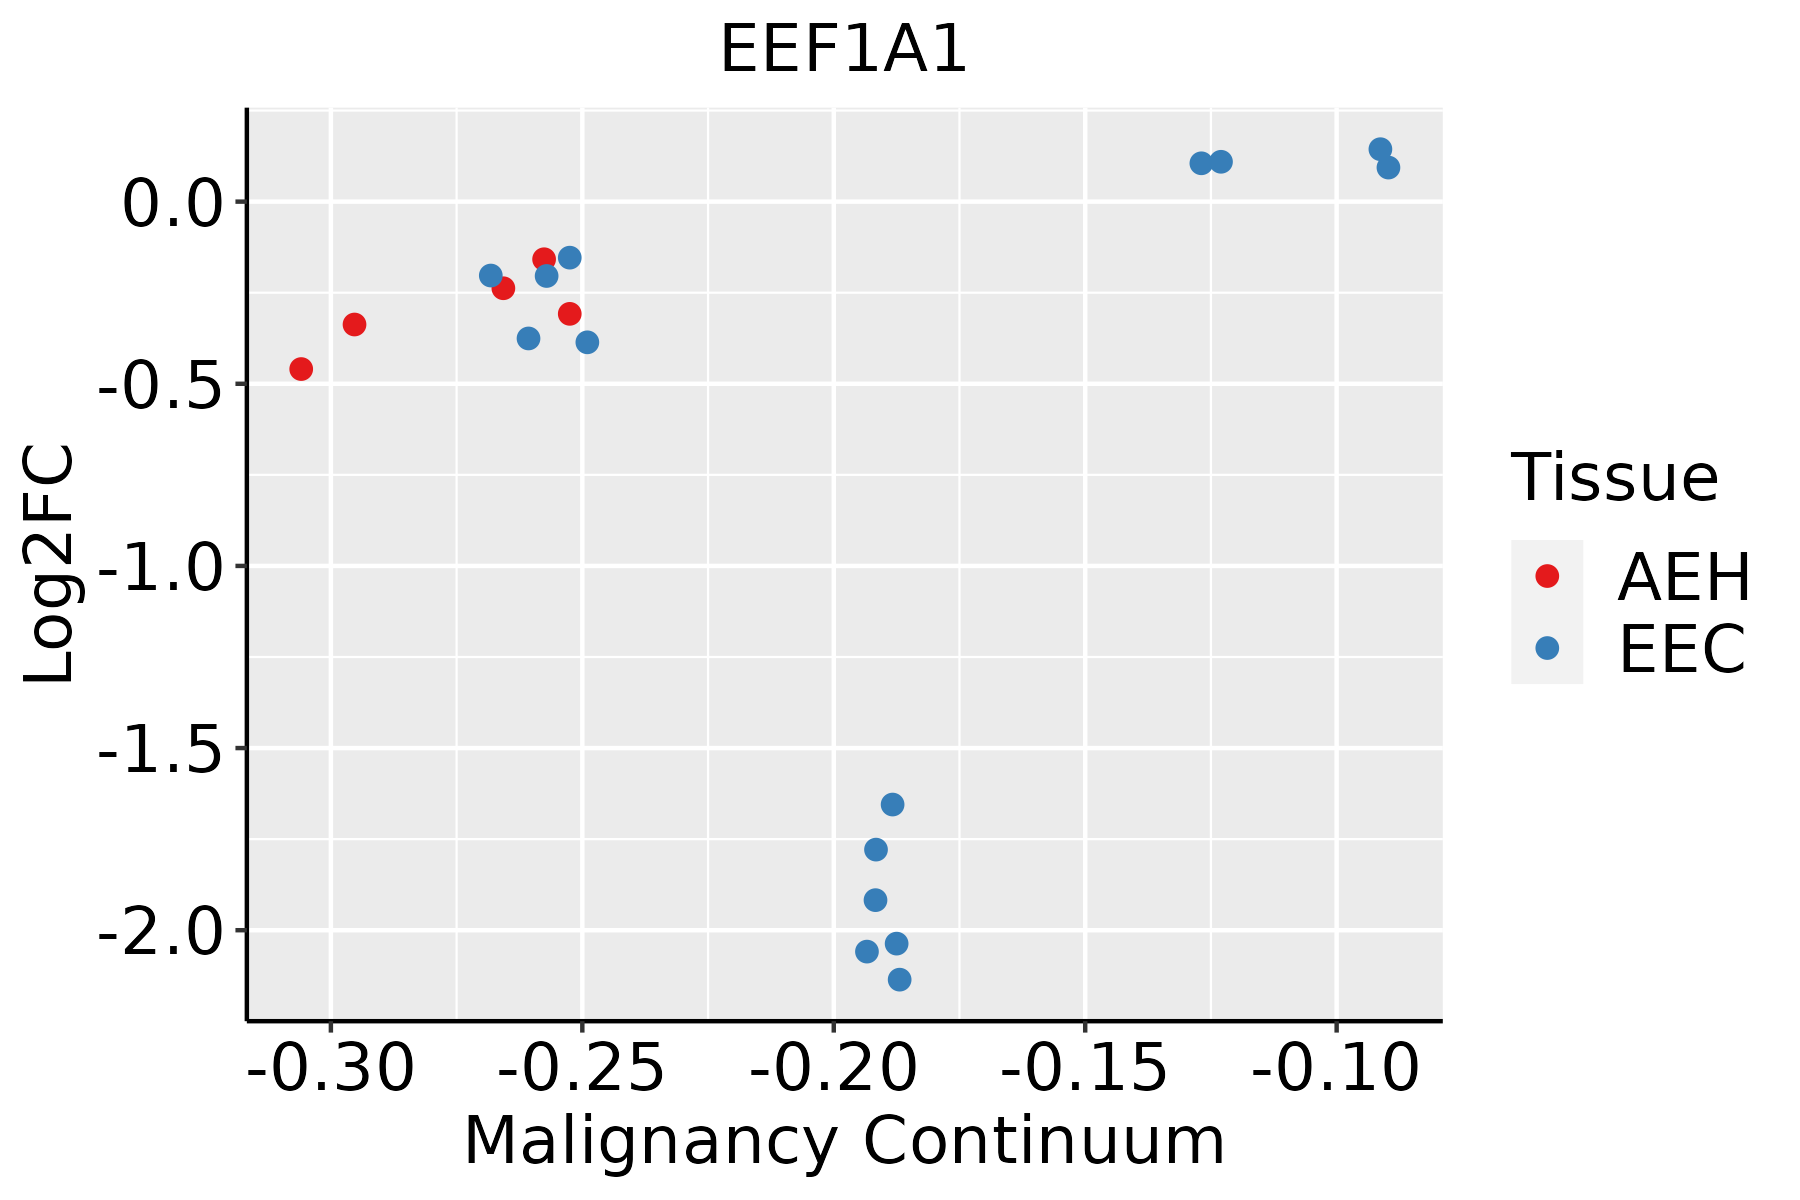 | AEH: Atypical endometrial hyperplasia |
| EEC: Endometrioid Cancer | ||
| Esophagus |  | ESCC: Esophageal squamous cell carcinoma |
| HGIN: High-grade intraepithelial neoplasias | ||
| LGIN: Low-grade intraepithelial neoplasias | ||
| GC |  | CAG: Chronic atrophic gastritis |
| CAG with IM: Chronic atrophic gastritis with intestinal metaplasia | ||
| CSG: Chronic superficial gastritis | ||
| GC: Gastric cancer | ||
| SIM: Severe intestinal metaplasia | ||
| WIM: Wild intestinal metaplasia | ||
| Liver |  | HCC: Hepatocellular carcinoma |
| NAFLD: Non-alcoholic fatty liver disease | ||
| Lung | 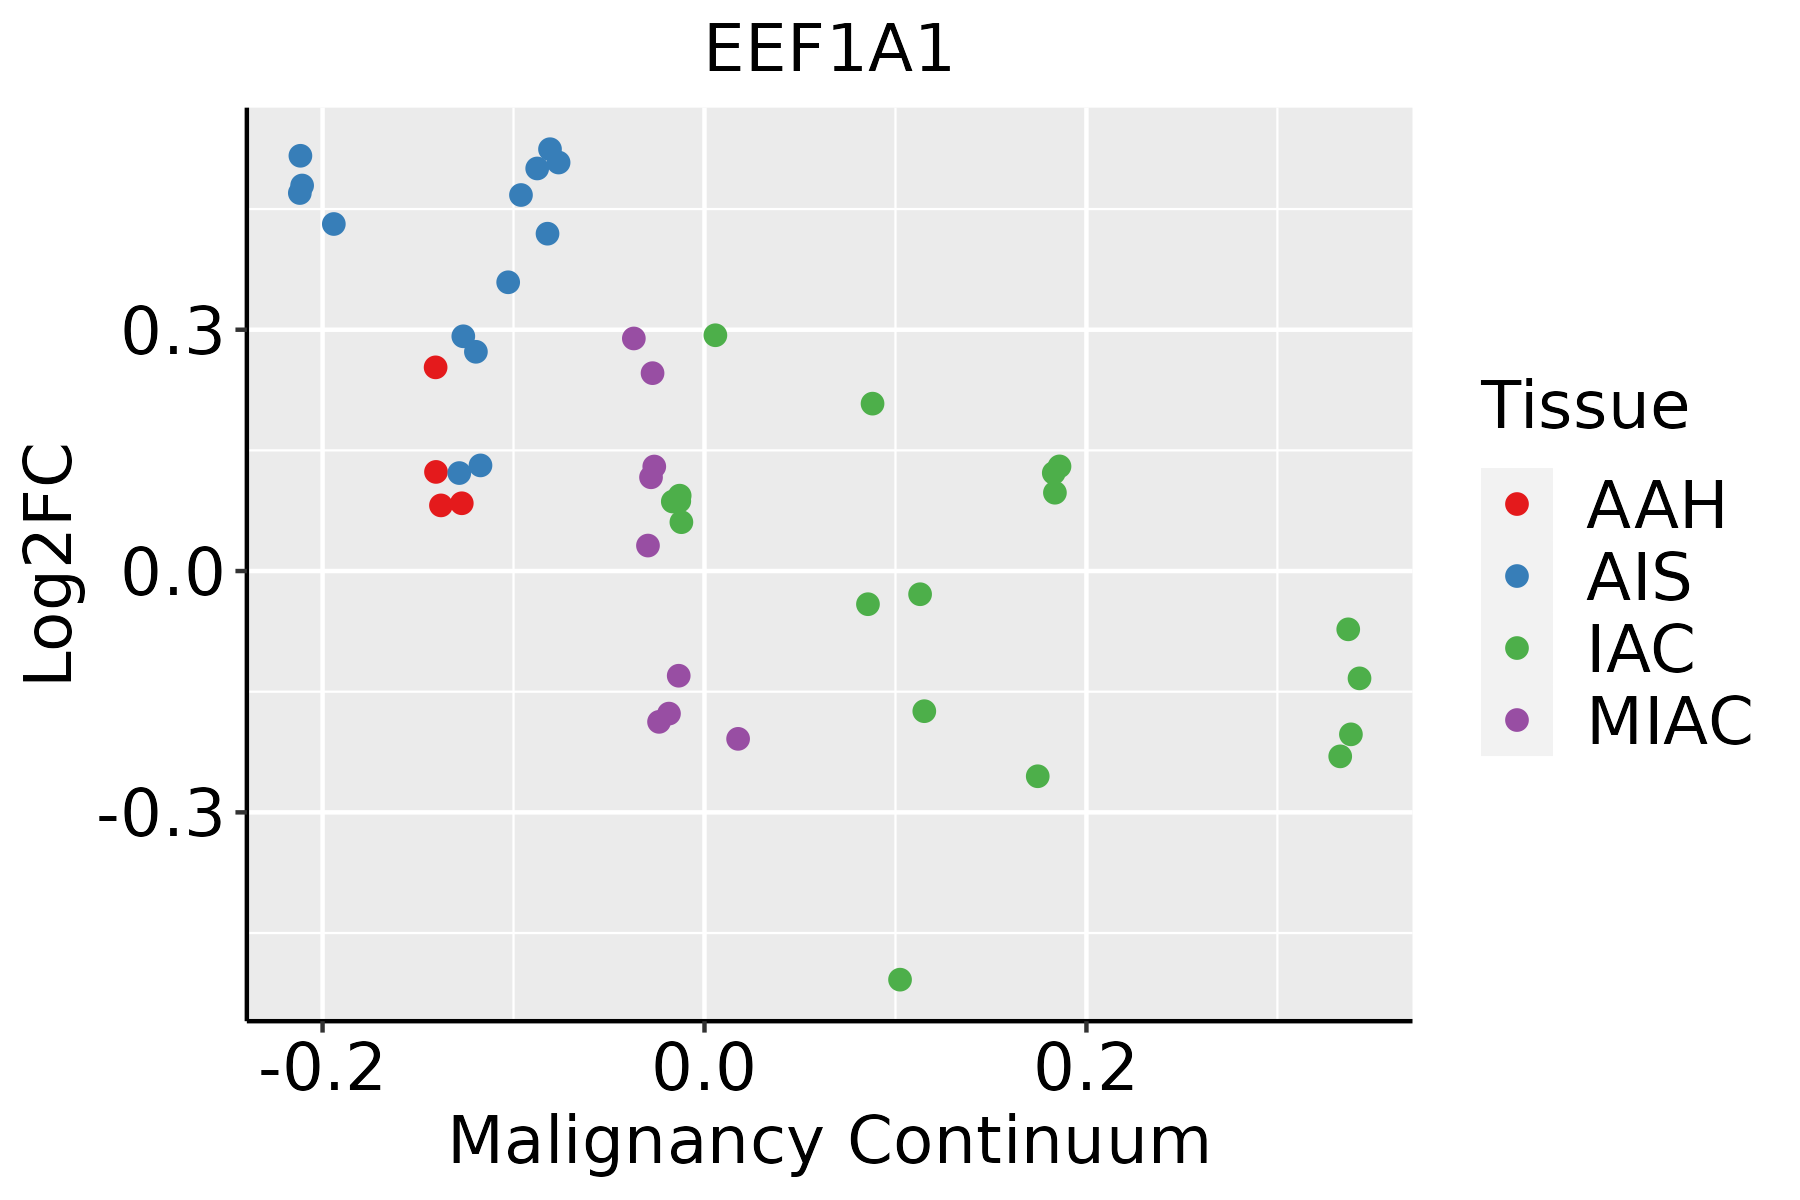 | AAH: Atypical adenomatous hyperplasia |
| AIS: Adenocarcinoma in situ | ||
| IAC: Invasive lung adenocarcinoma | ||
| MIA: Minimally invasive adenocarcinoma | ||
| Oral Cavity | 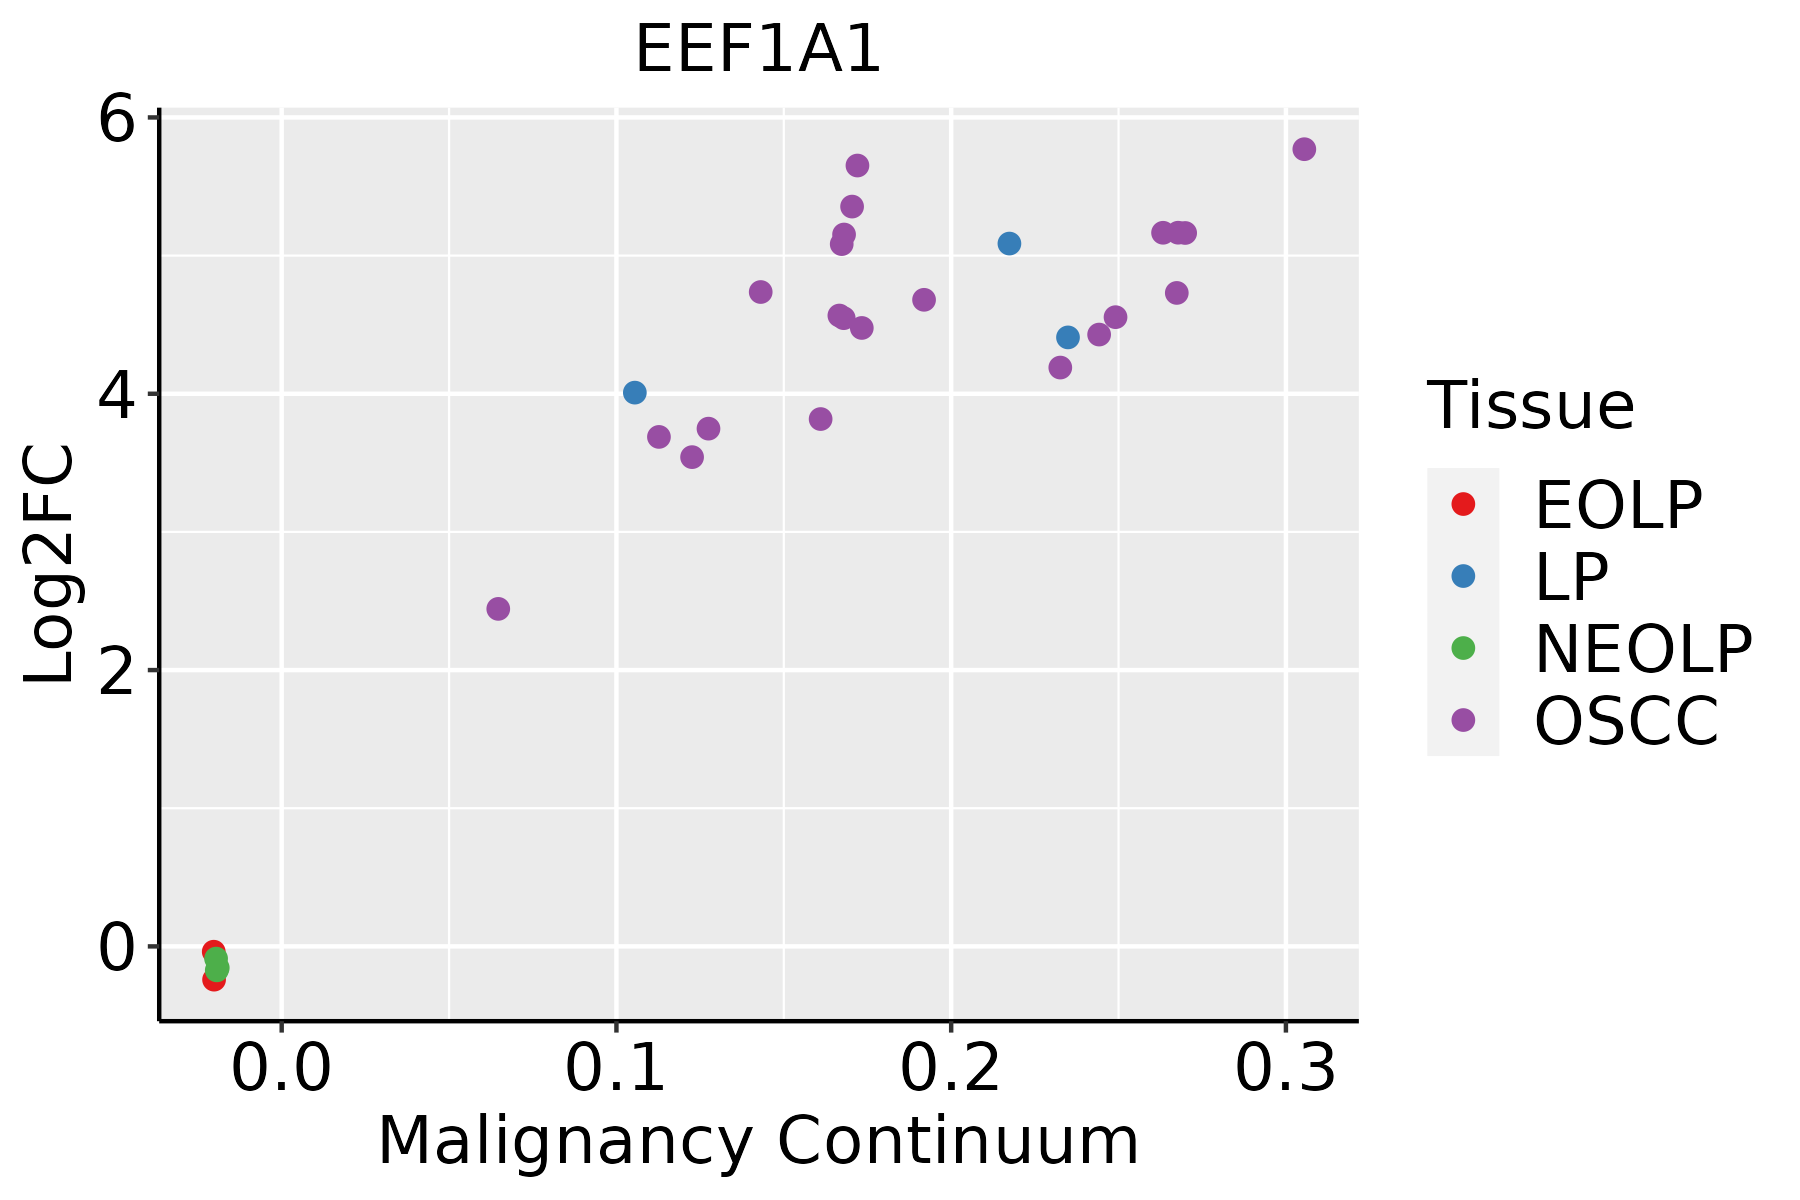 | EOLP: Erosive Oral lichen planus |
| LP: leukoplakia | ||
| NEOLP: Non-erosive oral lichen planus | ||
| OSCC: Oral squamous cell carcinoma | ||
| Prostate | 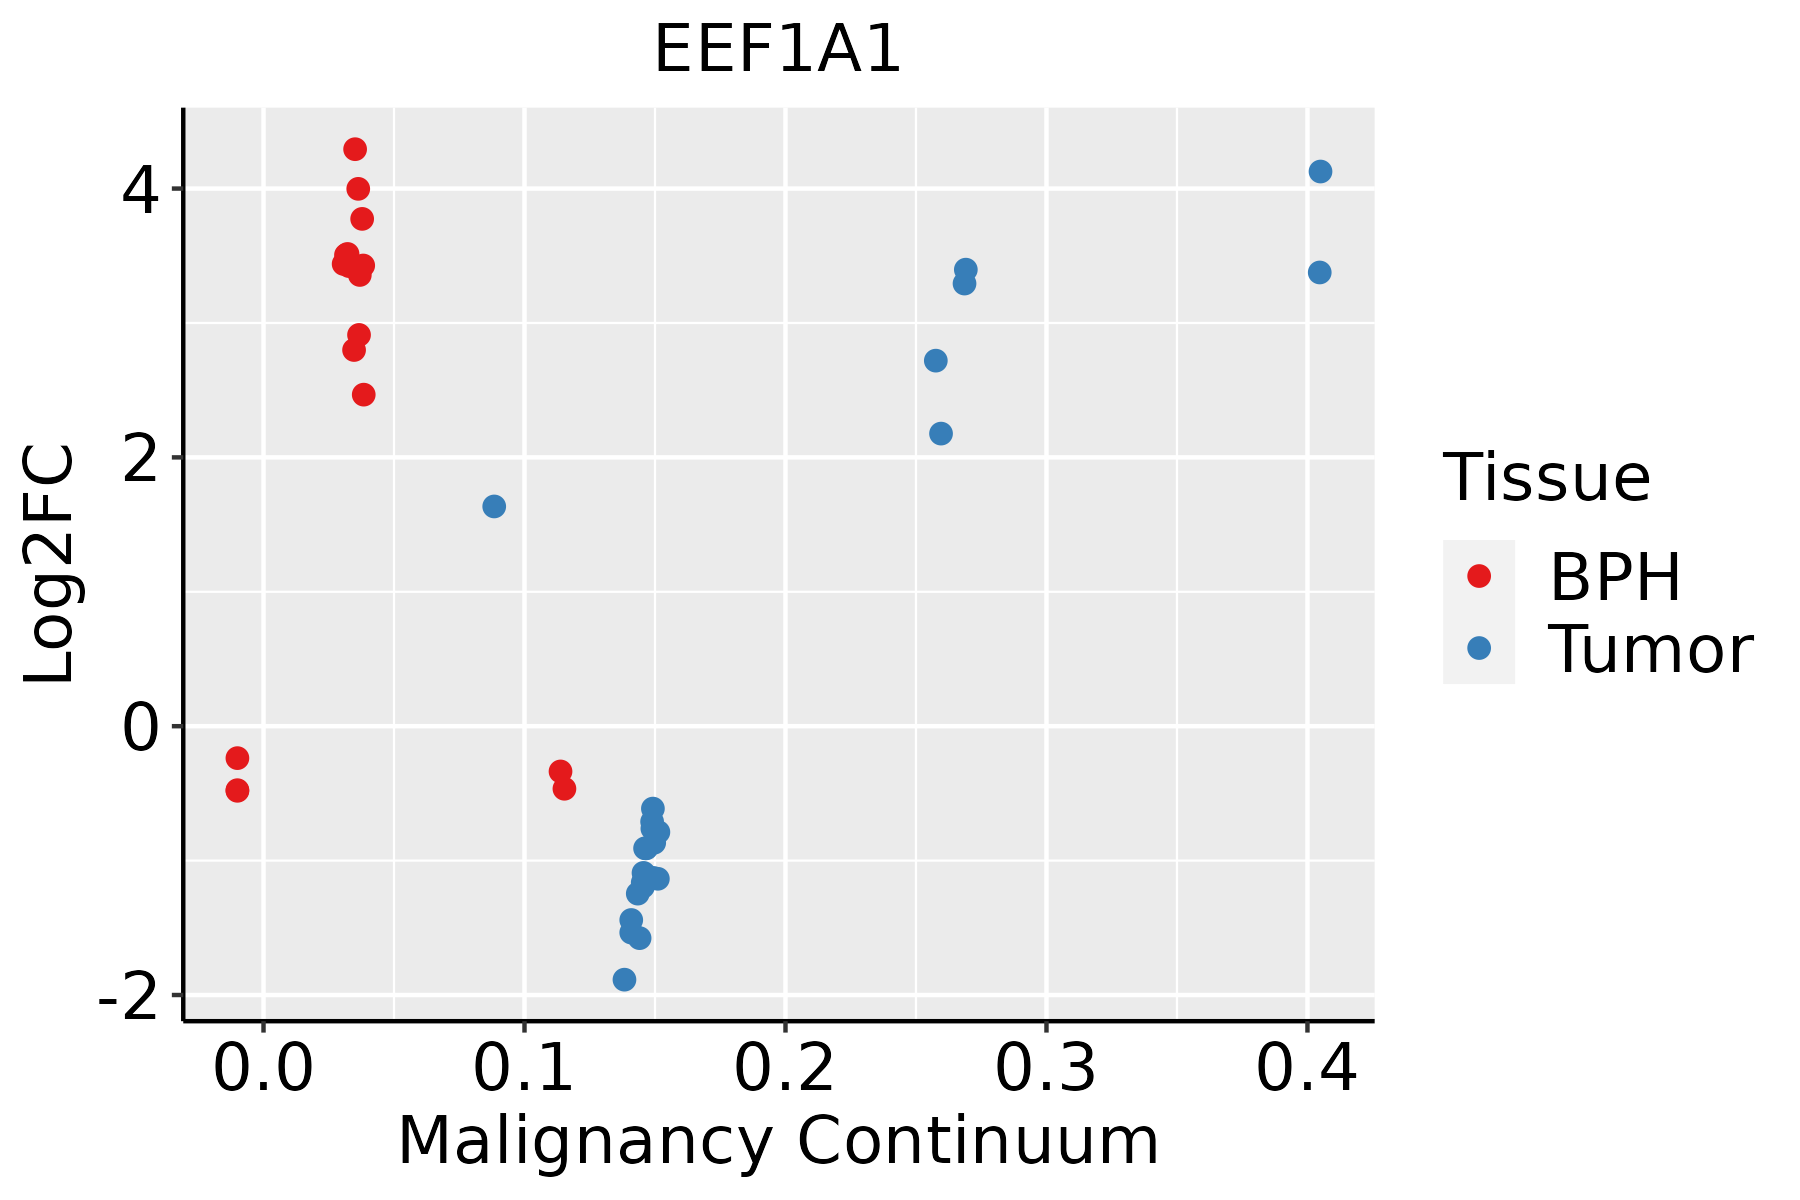 | BPH: Benign Prostatic Hyperplasia |
| Skin | 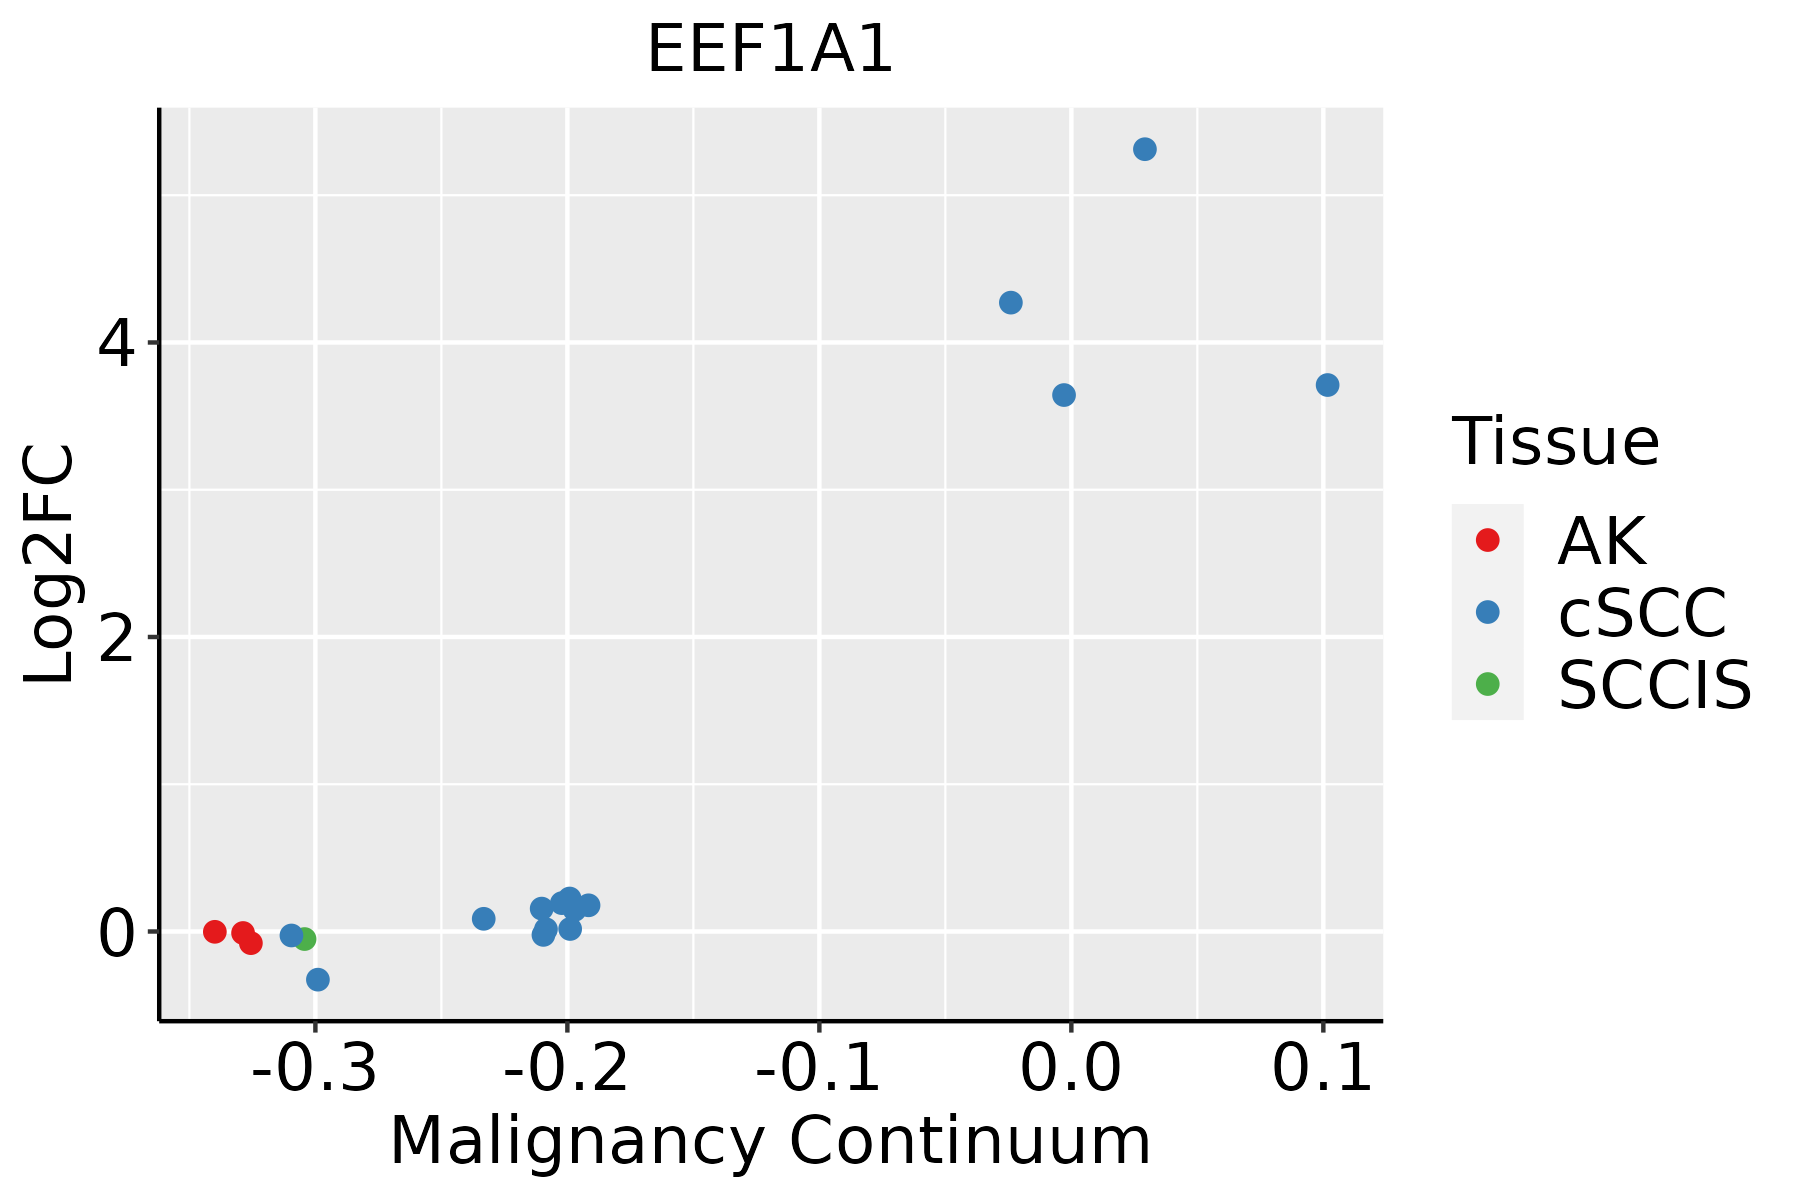 | AK: Actinic keratosis |
| cSCC: Cutaneous squamous cell carcinoma | ||
| SCCIS:squamous cell carcinoma in situ | ||
| Thyroid | 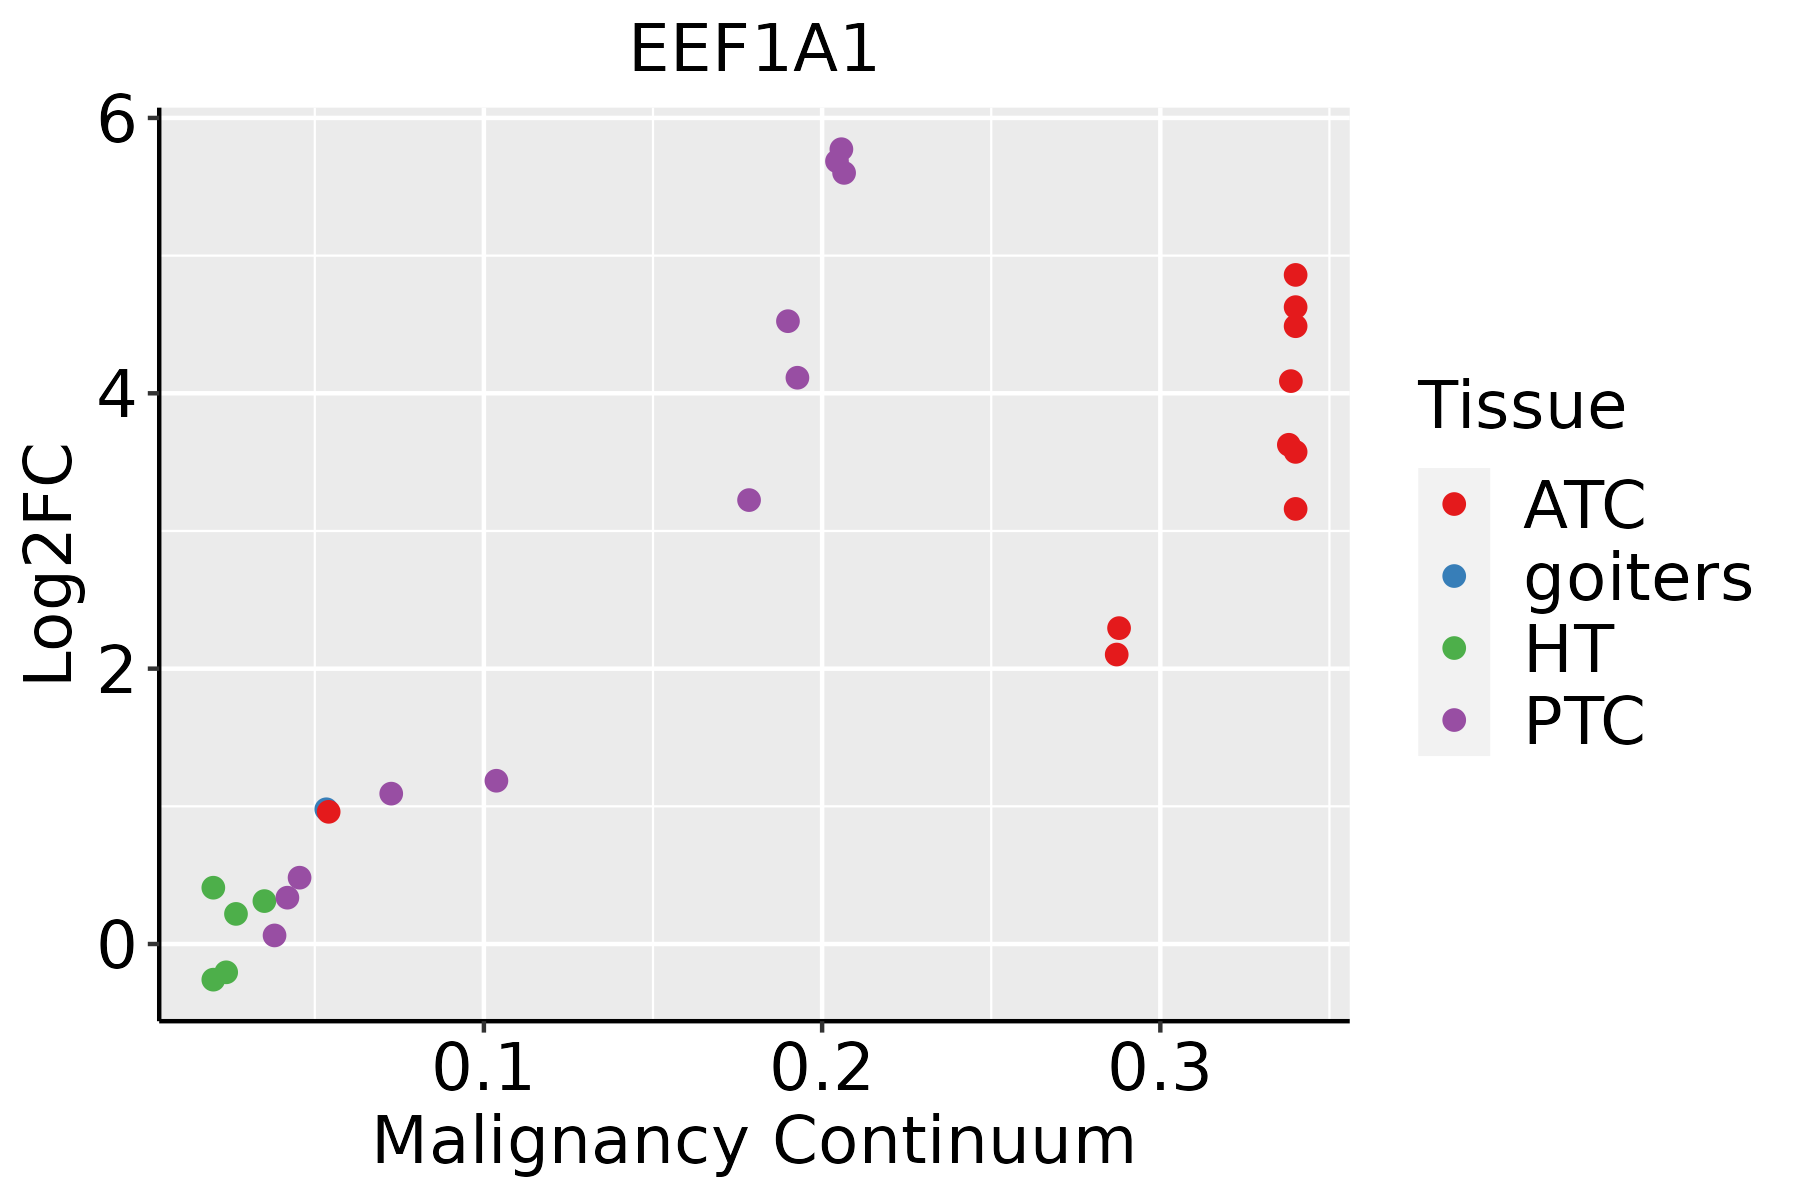 | ATC: Anaplastic thyroid cancer |
| HT: Hashimoto's thyroiditis | ||
| PTC: Papillary thyroid cancer |
| ∗log2FC in expression of this searched gene in stem-like cells from each diseased tissue sample relative to stem-like cells in normal samples in each tissue plotted against the malignancy continuum. Samples are colored based on if they are from different disease stage. |
Top |
Malignant transformation related pathway analysis |
| Find out the enriched GO biological processes and KEGG pathways involved in transition from healthy to precancer to cancer |
| Tissue | Disease Stage | Enriched GO biological Processes |
| Colorectum | AD |  |
| Colorectum | SER |  |
| Colorectum | MSS |  |
| Colorectum | MSI-H |  |
| Colorectum | FAP |  |
| ∗Top 15 enriched GO BP terms are showed in the bar plot of each disease state in each tissue. Each row represents a significant GO biological process which is colored according to the -log10(p.adjust). |
| Page: 1 2 3 4 5 6 7 8 9 |
| GO ID | Tissue | Disease Stage | Description | Gene Ratio | Bg Ratio | pvalue | p.adjust | Count |
| GO:00421769 | Breast | Precancer | regulation of protein catabolic process | 47/1080 | 391/18723 | 1.50e-06 | 5.58e-05 | 47 |
| GO:00064147 | Breast | Precancer | translational elongation | 10/1080 | 55/18723 | 1.06e-03 | 1.18e-02 | 10 |
| GO:00616846 | Breast | Precancer | chaperone-mediated autophagy | 5/1080 | 16/18723 | 1.62e-03 | 1.64e-02 | 5 |
| GO:00713647 | Breast | Precancer | cellular response to epidermal growth factor stimulus | 8/1080 | 45/18723 | 3.82e-03 | 3.06e-02 | 8 |
| GO:00708497 | Breast | Precancer | response to epidermal growth factor | 8/1080 | 49/18723 | 6.53e-03 | 4.51e-02 | 8 |
| GO:004217614 | Breast | IDC | regulation of protein catabolic process | 63/1434 | 391/18723 | 1.32e-08 | 9.61e-07 | 63 |
| GO:007136413 | Breast | IDC | cellular response to epidermal growth factor stimulus | 11/1434 | 45/18723 | 4.57e-04 | 6.13e-03 | 11 |
| GO:006168411 | Breast | IDC | chaperone-mediated autophagy | 6/1434 | 16/18723 | 8.18e-04 | 9.64e-03 | 6 |
| GO:007084913 | Breast | IDC | response to epidermal growth factor | 11/1434 | 49/18723 | 9.88e-04 | 1.11e-02 | 11 |
| GO:004217624 | Breast | DCIS | regulation of protein catabolic process | 62/1390 | 391/18723 | 9.98e-09 | 7.53e-07 | 62 |
| GO:006168421 | Breast | DCIS | chaperone-mediated autophagy | 6/1390 | 16/18723 | 6.93e-04 | 8.45e-03 | 6 |
| GO:007136422 | Breast | DCIS | cellular response to epidermal growth factor stimulus | 10/1390 | 45/18723 | 1.43e-03 | 1.46e-02 | 10 |
| GO:007084922 | Breast | DCIS | response to epidermal growth factor | 10/1390 | 49/18723 | 2.80e-03 | 2.43e-02 | 10 |
| GO:000641413 | Breast | DCIS | translational elongation | 10/1390 | 55/18723 | 6.66e-03 | 4.62e-02 | 10 |
| GO:004217610 | Cervix | CC | regulation of protein catabolic process | 104/2311 | 391/18723 | 9.39e-15 | 9.36e-12 | 104 |
| GO:00713648 | Cervix | CC | cellular response to epidermal growth factor stimulus | 16/2311 | 45/18723 | 5.24e-05 | 7.83e-04 | 16 |
| GO:00708498 | Cervix | CC | response to epidermal growth factor | 16/2311 | 49/18723 | 1.67e-04 | 1.99e-03 | 16 |
| GO:00105067 | Cervix | CC | regulation of autophagy | 61/2311 | 317/18723 | 2.61e-04 | 2.87e-03 | 61 |
| GO:00616847 | Cervix | CC | chaperone-mediated autophagy | 8/2311 | 16/18723 | 2.73e-04 | 2.99e-03 | 8 |
| GO:004217615 | Cervix | HSIL_HPV | regulation of protein catabolic process | 34/737 | 391/18723 | 1.41e-05 | 4.41e-04 | 34 |
| Page: 1 2 3 4 5 6 7 8 9 |
| Pathway ID | Tissue | Disease Stage | Description | Gene Ratio | Bg Ratio | pvalue | p.adjust | qvalue | Count |
| hsa0513414 | Breast | Precancer | Legionellosis | 19/684 | 57/8465 | 4.62e-08 | 9.12e-07 | 6.98e-07 | 19 |
| hsa0513415 | Breast | Precancer | Legionellosis | 19/684 | 57/8465 | 4.62e-08 | 9.12e-07 | 6.98e-07 | 19 |
| hsa0513422 | Breast | IDC | Legionellosis | 19/867 | 57/8465 | 1.89e-06 | 3.07e-05 | 2.29e-05 | 19 |
| hsa0514012 | Breast | IDC | Leishmaniasis | 16/867 | 77/8465 | 4.35e-03 | 2.57e-02 | 1.92e-02 | 16 |
| hsa0513432 | Breast | IDC | Legionellosis | 19/867 | 57/8465 | 1.89e-06 | 3.07e-05 | 2.29e-05 | 19 |
| hsa0514013 | Breast | IDC | Leishmaniasis | 16/867 | 77/8465 | 4.35e-03 | 2.57e-02 | 1.92e-02 | 16 |
| hsa0513441 | Breast | DCIS | Legionellosis | 19/846 | 57/8465 | 1.30e-06 | 2.10e-05 | 1.55e-05 | 19 |
| hsa0514021 | Breast | DCIS | Leishmaniasis | 17/846 | 77/8465 | 1.29e-03 | 9.06e-03 | 6.67e-03 | 17 |
| hsa0513451 | Breast | DCIS | Legionellosis | 19/846 | 57/8465 | 1.30e-06 | 2.10e-05 | 1.55e-05 | 19 |
| hsa0514031 | Breast | DCIS | Leishmaniasis | 17/846 | 77/8465 | 1.29e-03 | 9.06e-03 | 6.67e-03 | 17 |
| hsa0513416 | Cervix | CC | Legionellosis | 20/1267 | 57/8465 | 1.29e-04 | 8.19e-04 | 4.85e-04 | 20 |
| hsa0514014 | Cervix | CC | Leishmaniasis | 21/1267 | 77/8465 | 3.65e-03 | 1.34e-02 | 7.91e-03 | 21 |
| hsa0513417 | Cervix | CC | Legionellosis | 20/1267 | 57/8465 | 1.29e-04 | 8.19e-04 | 4.85e-04 | 20 |
| hsa0514015 | Cervix | CC | Leishmaniasis | 21/1267 | 77/8465 | 3.65e-03 | 1.34e-02 | 7.91e-03 | 21 |
| hsa0514022 | Cervix | HSIL_HPV | Leishmaniasis | 18/459 | 77/8465 | 9.82e-08 | 3.14e-06 | 2.54e-06 | 18 |
| hsa0513423 | Cervix | HSIL_HPV | Legionellosis | 12/459 | 57/8465 | 4.24e-05 | 6.21e-04 | 5.02e-04 | 12 |
| hsa0514032 | Cervix | HSIL_HPV | Leishmaniasis | 18/459 | 77/8465 | 9.82e-08 | 3.14e-06 | 2.54e-06 | 18 |
| hsa0513433 | Cervix | HSIL_HPV | Legionellosis | 12/459 | 57/8465 | 4.24e-05 | 6.21e-04 | 5.02e-04 | 12 |
| hsa0514041 | Cervix | N_HPV | Leishmaniasis | 12/349 | 77/8465 | 6.52e-05 | 7.39e-04 | 5.78e-04 | 12 |
| hsa0513442 | Cervix | N_HPV | Legionellosis | 8/349 | 57/8465 | 2.17e-03 | 1.29e-02 | 1.00e-02 | 8 |
| Page: 1 2 3 4 |
Top |
Cell-cell communication analysis |
| Identification of potential cell-cell interactions between two cell types and their ligand-receptor pairs for different disease states |
| Ligand | Receptor | LRpair | Pathway | Tissue | Disease Stage |
| Page: 1 |
Top |
Single-cell gene regulatory network inference analysis |
| Find out the significant the regulons (TFs) and the target genes of each regulon across cell types for different disease states |
| TF | Cell Type | Tissue | Disease Stage | Target Gene | RSS | Regulon Activity |
| ∗The dot plots of a searched regulon are shown for all cell subpopulations in each disease state of each tissue based on the regulon specific score inferred using pySCENIC and by calculating the average expression. |
| Page: 1 |
Top |
Somatic mutation of malignant transformation related genes |
| Annotation of somatic variants for genes involved in malignant transformation |
| Hugo Symbol | Variant Class | Variant Classification | dbSNP RS | HGVSc | HGVSp | HGVSp Short | SWISSPROT | BIOTYPE | SIFT | PolyPhen | Tumor Sample Barcode | Tissue | Histology | Sex | Age | Stage | Therapy Types | Drugs | Outcome |
| EEF1A1 | SNV | Missense_Mutation | c.20N>G | p.His7Arg | p.H7R | P68104 | protein_coding | deleterious_low_confidence(0) | possibly_damaging(0.642) | TCGA-A2-A25C-01 | Breast | breast invasive carcinoma | Female | <65 | I/II | Chemotherapy | taxotere | SD | |
| EEF1A1 | SNV | Missense_Mutation | c.563N>C | p.Val188Ala | p.V188A | P68104 | protein_coding | deleterious_low_confidence(0) | probably_damaging(0.955) | TCGA-D8-A1XK-01 | Breast | breast invasive carcinoma | Female | <65 | I/II | Chemotherapy | doxorubicine+cyclophosphamide | SD | |
| EEF1A1 | SNV | Missense_Mutation | c.271N>A | p.Asp91Asn | p.D91N | P68104 | protein_coding | deleterious_low_confidence(0.02) | probably_damaging(1) | TCGA-D8-A4Z1-01 | Breast | breast invasive carcinoma | Female | >=65 | I/II | Hormone Therapy | tamoxiphen | SD | |
| EEF1A1 | SNV | Missense_Mutation | novel | c.595G>C | p.Asp199His | p.D199H | P68104 | protein_coding | deleterious_low_confidence(0) | probably_damaging(0.994) | TCGA-E2-A574-01 | Breast | breast invasive carcinoma | Female | <65 | I/II | Chemotherapy | adriamycin | SD |
| EEF1A1 | SNV | Missense_Mutation | novel | c.34N>A | p.Val12Ile | p.V12I | P68104 | protein_coding | tolerated_low_confidence(0.27) | benign(0.015) | TCGA-OL-A66K-01 | Breast | breast invasive carcinoma | Female | >=65 | I/II | Unknown | Unknown | SD |
| EEF1A1 | insertion | Nonsense_Mutation | novel | c.500_501insA | p.Tyr167Ter | p.Y167* | P68104 | protein_coding | TCGA-A2-A0ES-01 | Breast | breast invasive carcinoma | Female | <65 | I/II | Chemotherapy | docetaxel | SD | ||
| EEF1A1 | insertion | Frame_Shift_Ins | novel | c.1231_1232insT | p.Cys411LeufsTer3 | p.C411Lfs*3 | P68104 | protein_coding | TCGA-C8-A26X-01 | Breast | breast invasive carcinoma | Female | <65 | I/II | Chemotherapy | 5-fluorouracil | CR | ||
| EEF1A1 | insertion | Frame_Shift_Ins | novel | c.148_149insATACAGATGG | p.Gly50AspfsTer16 | p.G50Dfs*16 | P68104 | protein_coding | TCGA-D8-A1X5-01 | Breast | breast invasive carcinoma | Female | >=65 | III/IV | Hormone Therapy | tamoxiphen | SD | ||
| EEF1A1 | SNV | Missense_Mutation | c.370N>C | p.Glu124Gln | p.E124Q | P68104 | protein_coding | deleterious_low_confidence(0) | possibly_damaging(0.609) | TCGA-EK-A3GK-01 | Cervix | cervical & endocervical cancer | Female | <65 | I/II | Unknown | Unknown | SD | |
| EEF1A1 | SNV | Missense_Mutation | c.213N>G | p.Ile71Met | p.I71M | P68104 | protein_coding | deleterious_low_confidence(0) | possibly_damaging(0.908) | TCGA-EK-A3GK-01 | Cervix | cervical & endocervical cancer | Female | <65 | I/II | Unknown | Unknown | SD |
| Page: 1 2 3 4 5 6 7 8 |
Top |
Related drugs of malignant transformation related genes |
| Identification of chemicals and drugs interact with genes involved in malignant transfromation |
| (DGIdb 4.0) |
| Entrez ID | Symbol | Category | Interaction Types | Drug Claim Name | Drug Name | PMIDs |
| 1915 | EEF1A1 | TRANSCRIPTION FACTOR | SPARSOMYCIN | SPARSOMYCIN | 20118940 | |
| 1915 | EEF1A1 | TRANSCRIPTION FACTOR | PMA | 9492285 |
| Page: 1 |

Copyright 2023-Present -The University of Texas Health Science Center at Houston |