
|
|||||
|
 | |
| |
| |
| |
| |
| |
|
Gene: EEA1 |
Gene summary for EEA1 |
| Gene information | Species | Human | Gene symbol | EEA1 | Gene ID | 8411 |
| Gene name | early endosome antigen 1 | |
| Gene Alias | MST105 | |
| Cytomap | 12q22 | |
| Gene Type | protein-coding | GO ID | GO:0006810 | UniProtAcc | Q15075 |
Top |
Malignant transformation analysis |
| Identification of the aberrant gene expression in precancerous and cancerous lesions by comparing the gene expression of stem-like cells in diseased tissues with normal stem cells |
| Entrez ID | Symbol | Replicates | Species | Organ | Tissue | Adj P-value | Log2FC | Malignancy |
| 8411 | EEA1 | CA_HPV_1 | Human | Cervix | CC | 1.16e-05 | -1.36e-01 | 0.0264 |
| 8411 | EEA1 | N_HPV_1 | Human | Cervix | N_HPV | 1.77e-02 | -1.89e-01 | 0.0079 |
| 8411 | EEA1 | CCI_2 | Human | Cervix | CC | 8.25e-04 | 6.52e-01 | 0.5249 |
| 8411 | EEA1 | CCI_3 | Human | Cervix | CC | 5.53e-03 | 1.03e+00 | 0.516 |
| 8411 | EEA1 | HTA11_3410_2000001011 | Human | Colorectum | AD | 1.12e-12 | -6.08e-01 | 0.0155 |
| 8411 | EEA1 | HTA11_696_2000001011 | Human | Colorectum | AD | 8.22e-05 | -2.98e-01 | -0.1464 |
| 8411 | EEA1 | HTA11_5216_2000001011 | Human | Colorectum | SER | 2.25e-02 | -4.31e-01 | -0.1462 |
| 8411 | EEA1 | HTA11_866_3004761011 | Human | Colorectum | AD | 8.80e-05 | -4.78e-01 | 0.096 |
| 8411 | EEA1 | HTA11_8622_2000001021 | Human | Colorectum | SER | 3.57e-02 | -6.38e-01 | 0.0528 |
| 8411 | EEA1 | HTA11_10711_2000001011 | Human | Colorectum | AD | 5.28e-03 | -4.85e-01 | 0.0338 |
| 8411 | EEA1 | HTA11_99999970781_79442 | Human | Colorectum | MSS | 1.88e-16 | -5.16e-01 | 0.294 |
| 8411 | EEA1 | HTA11_99999971662_82457 | Human | Colorectum | MSS | 3.54e-07 | -4.06e-01 | 0.3859 |
| 8411 | EEA1 | HTA11_99999974143_84620 | Human | Colorectum | MSS | 1.14e-18 | -5.88e-01 | 0.3005 |
| 8411 | EEA1 | A002-C-010 | Human | Colorectum | FAP | 2.50e-02 | -8.12e-02 | 0.242 |
| 8411 | EEA1 | A001-C-207 | Human | Colorectum | FAP | 4.10e-03 | -2.80e-01 | 0.1278 |
| 8411 | EEA1 | A015-C-203 | Human | Colorectum | FAP | 5.82e-38 | -3.74e-01 | -0.1294 |
| 8411 | EEA1 | A015-C-204 | Human | Colorectum | FAP | 1.74e-05 | -3.70e-01 | -0.0228 |
| 8411 | EEA1 | A014-C-040 | Human | Colorectum | FAP | 8.05e-04 | -2.76e-01 | -0.1184 |
| 8411 | EEA1 | A002-C-201 | Human | Colorectum | FAP | 2.04e-11 | -3.48e-01 | 0.0324 |
| 8411 | EEA1 | A002-C-203 | Human | Colorectum | FAP | 2.80e-06 | -2.66e-01 | 0.2786 |
| Page: 1 2 3 4 5 6 7 8 9 |
| Tissue | Expression Dynamics | Abbreviation |
| Cervix | 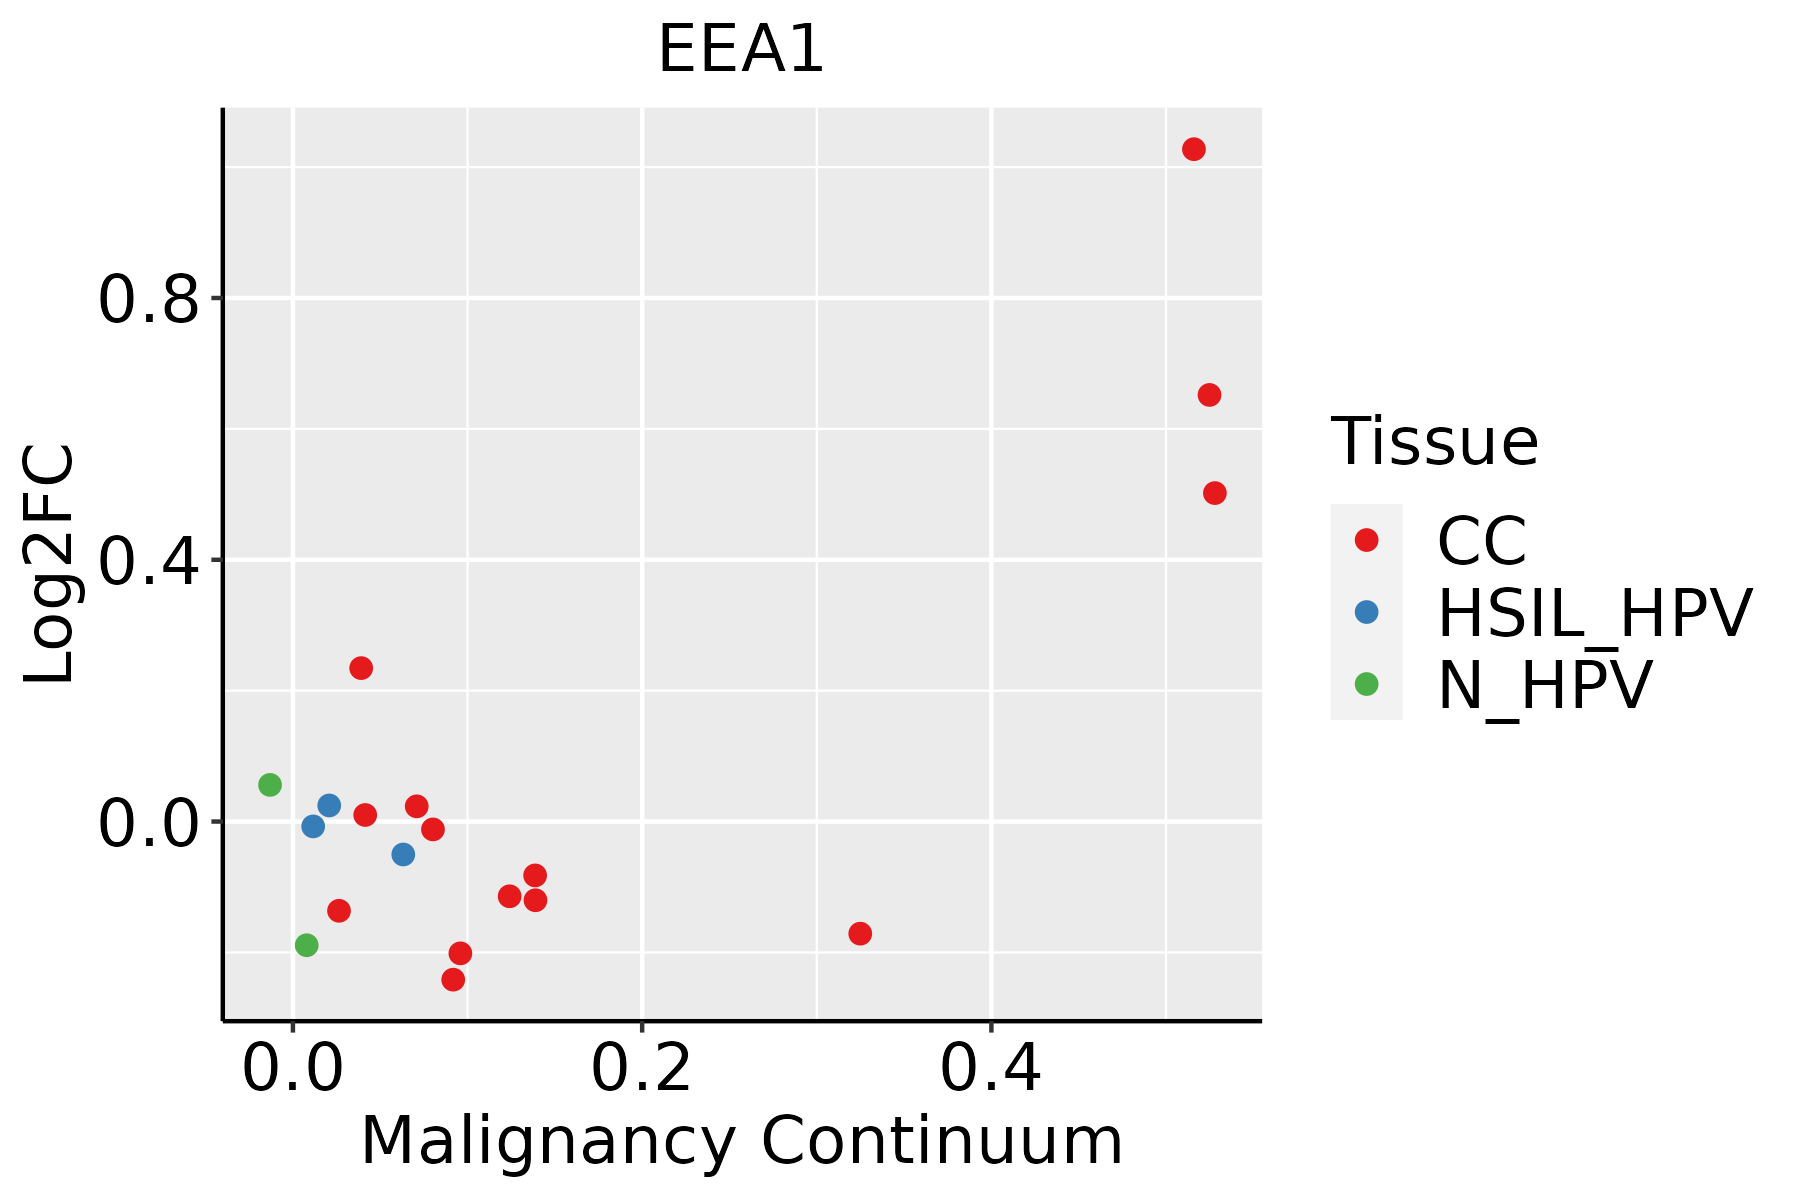 | CC: Cervix cancer |
| HSIL_HPV: HPV-infected high-grade squamous intraepithelial lesions | ||
| N_HPV: HPV-infected normal cervix | ||
| Colorectum (GSE201348) |  | FAP: Familial adenomatous polyposis |
| CRC: Colorectal cancer | ||
| Colorectum (HTA11) | 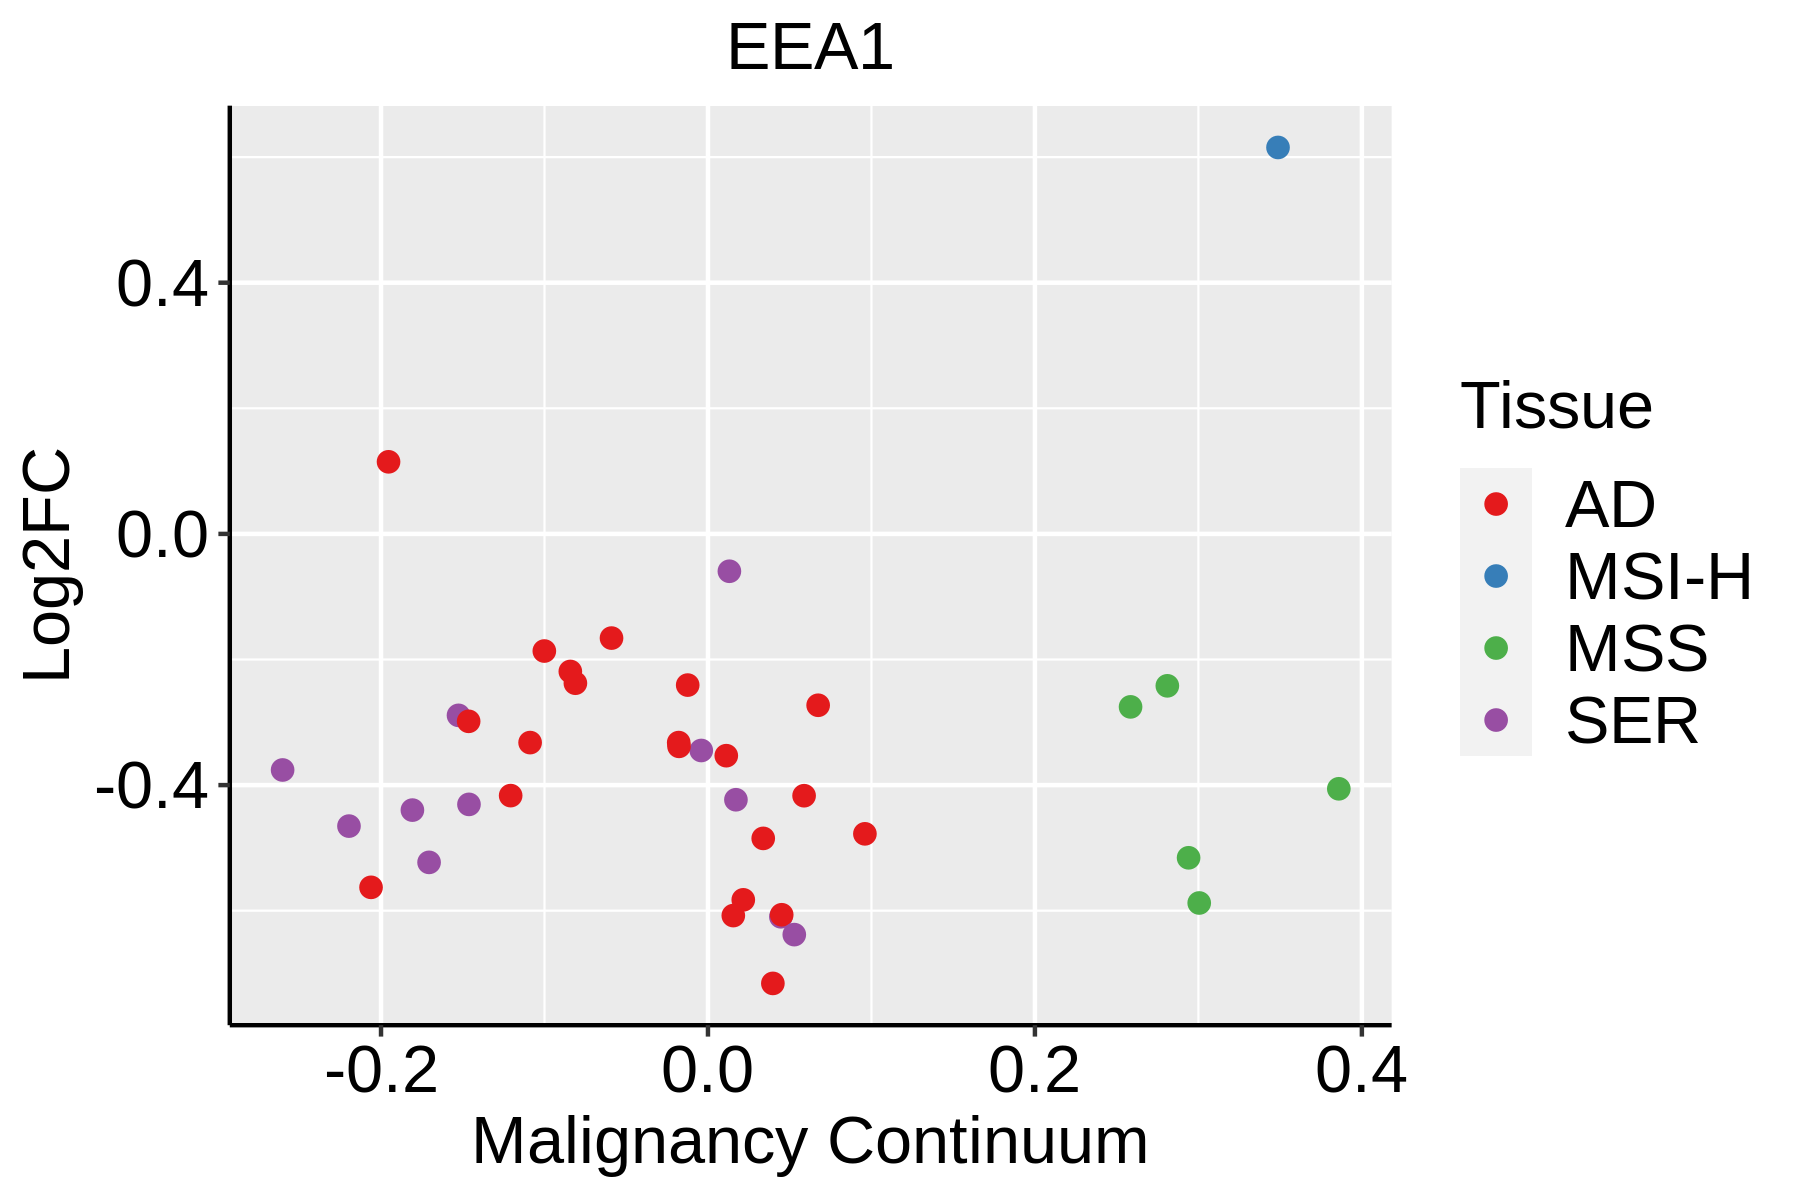 | AD: Adenomas |
| SER: Sessile serrated lesions | ||
| MSI-H: Microsatellite-high colorectal cancer | ||
| MSS: Microsatellite stable colorectal cancer | ||
| Esophagus | 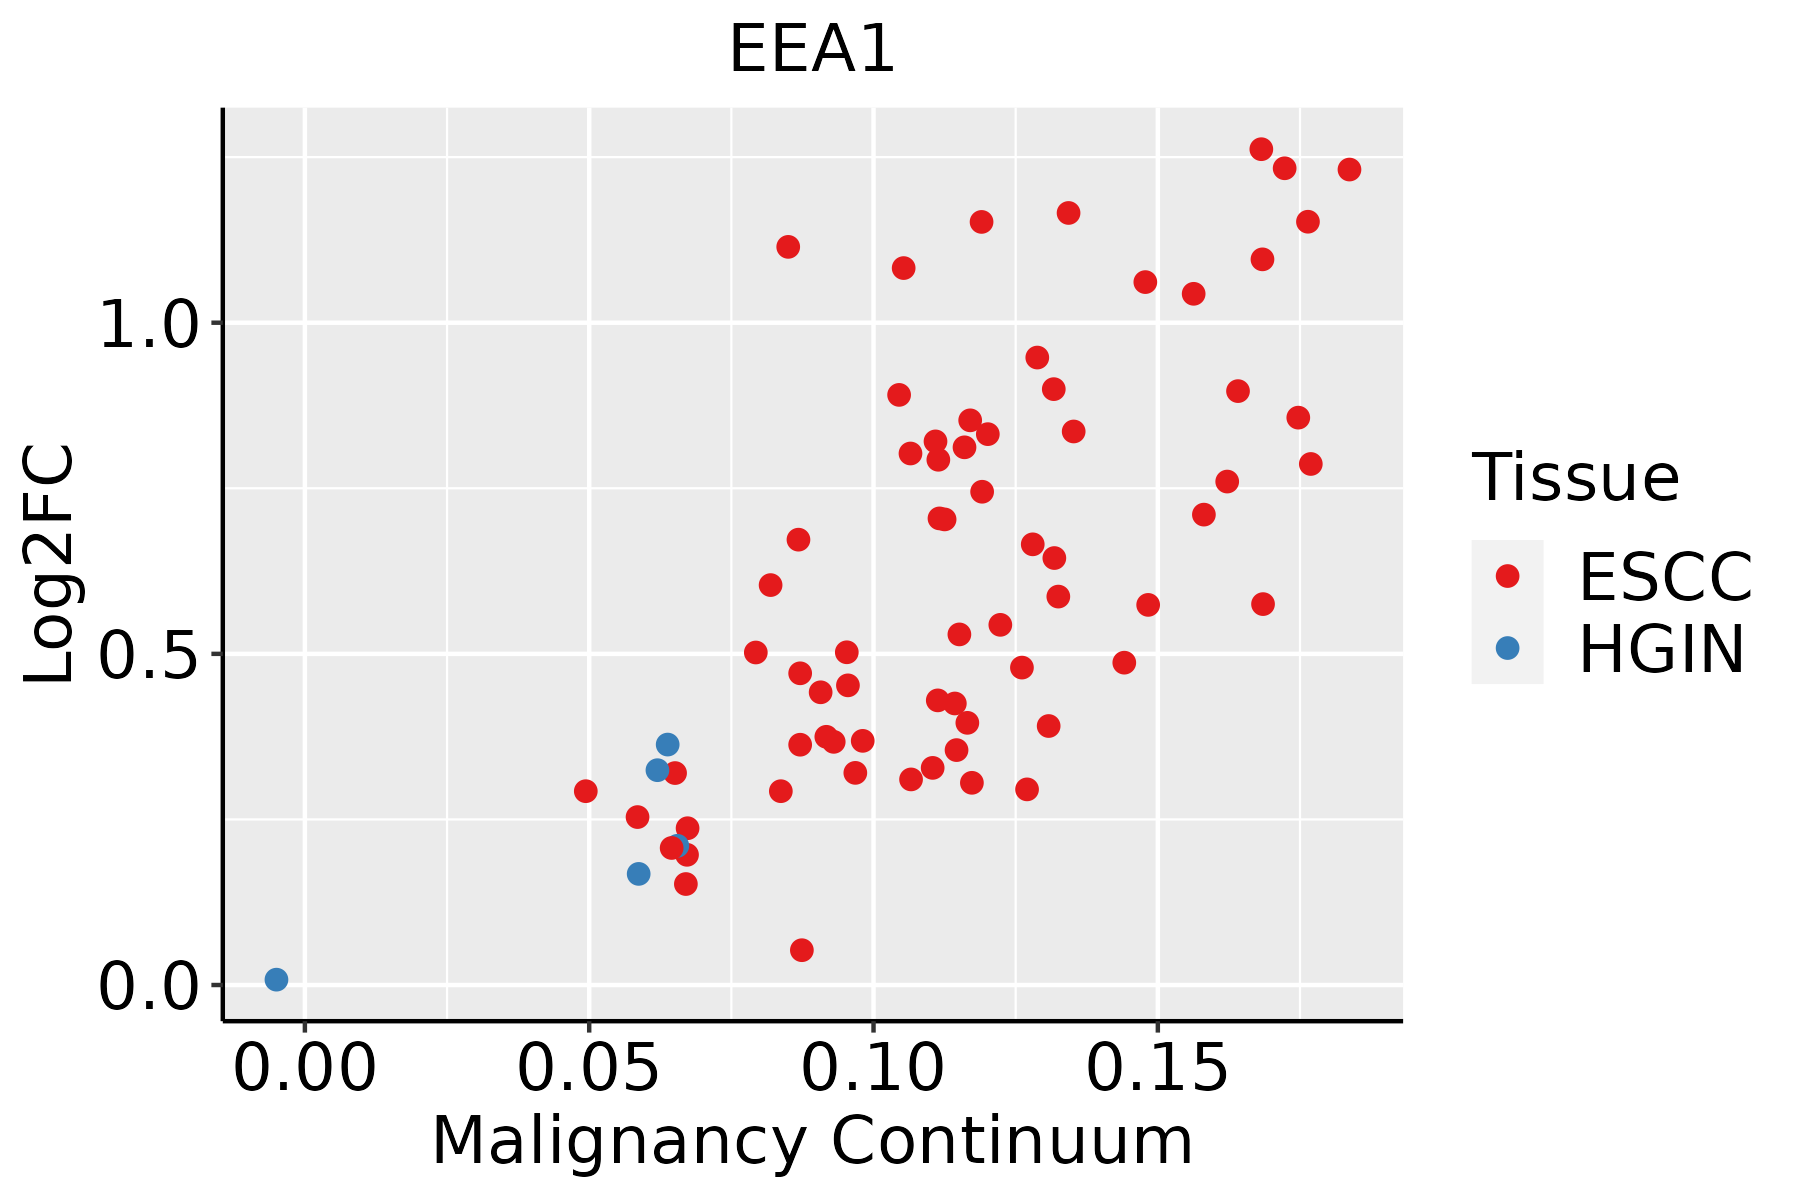 | ESCC: Esophageal squamous cell carcinoma |
| HGIN: High-grade intraepithelial neoplasias | ||
| LGIN: Low-grade intraepithelial neoplasias | ||
| Liver |  | HCC: Hepatocellular carcinoma |
| NAFLD: Non-alcoholic fatty liver disease | ||
| Lung | 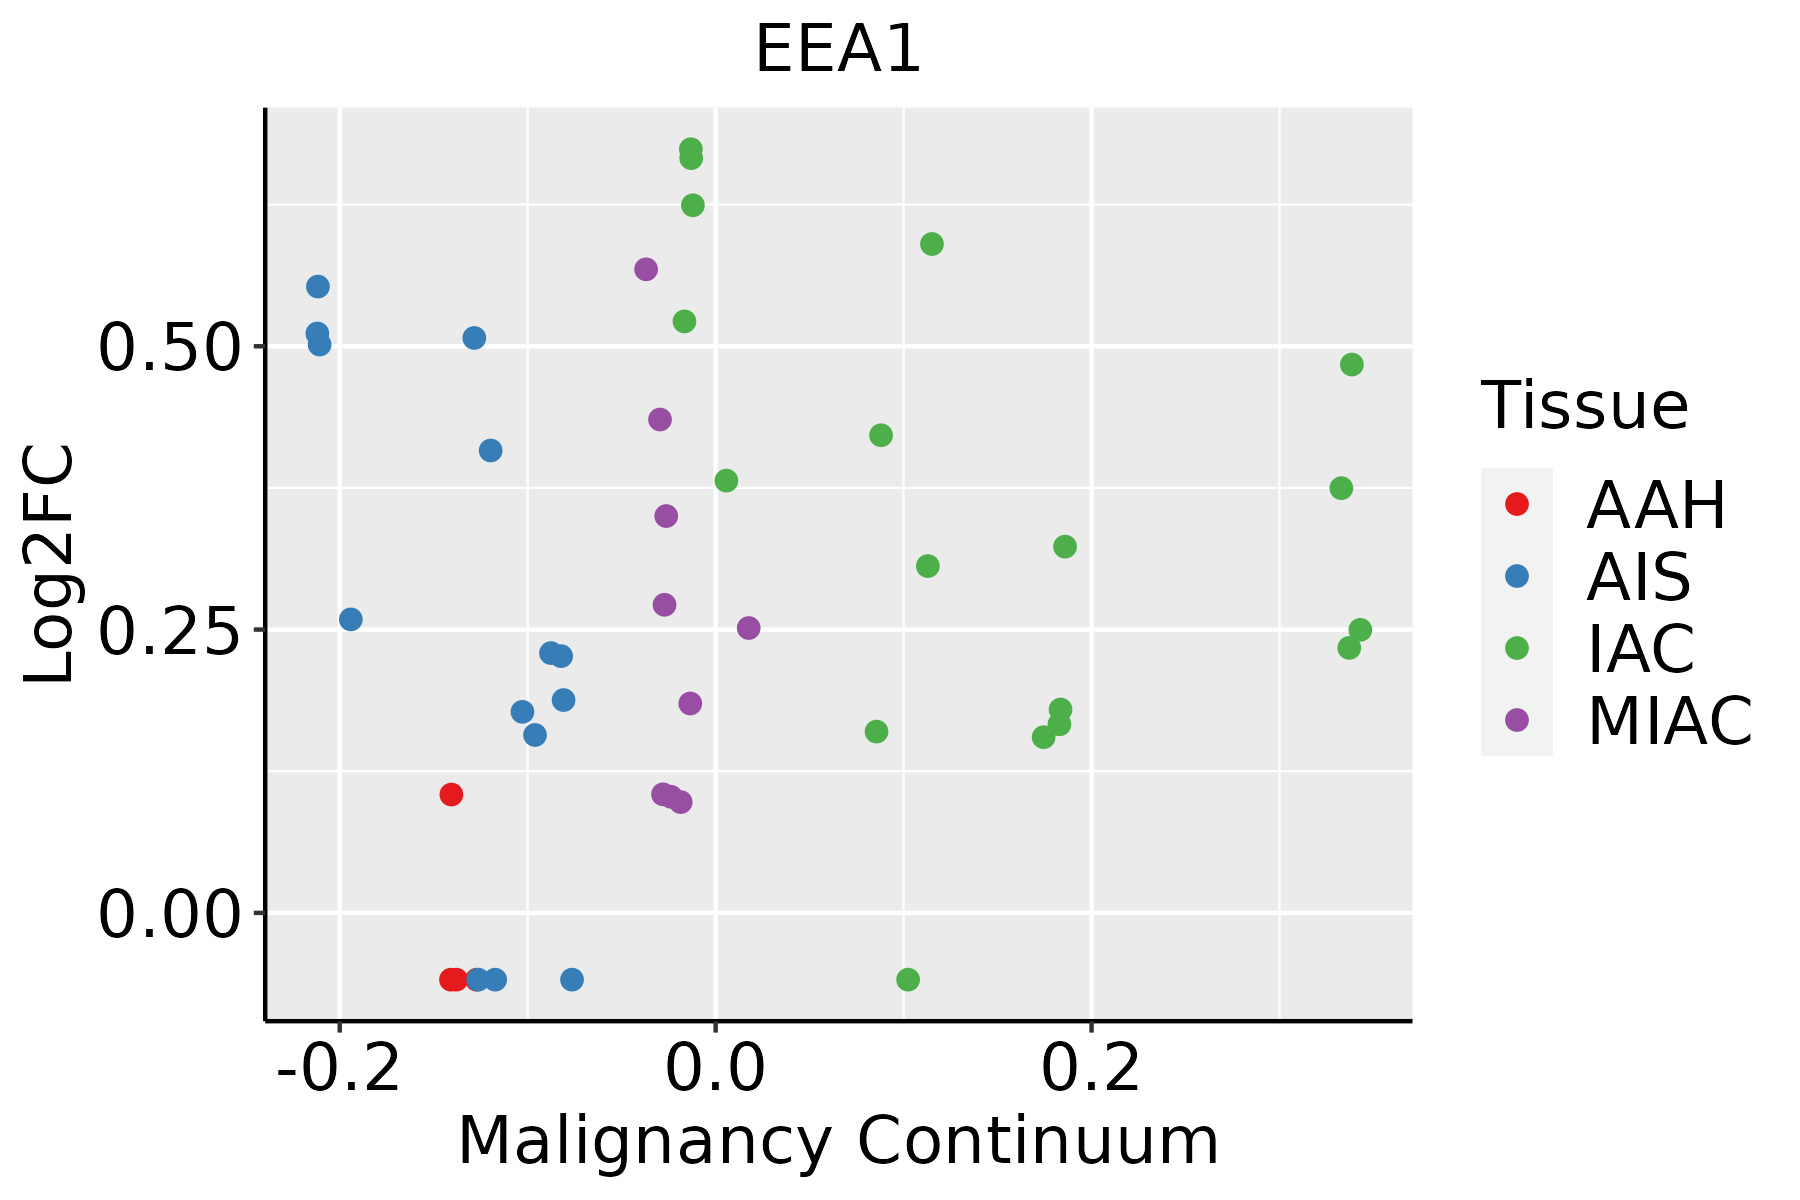 | AAH: Atypical adenomatous hyperplasia |
| AIS: Adenocarcinoma in situ | ||
| IAC: Invasive lung adenocarcinoma | ||
| MIA: Minimally invasive adenocarcinoma | ||
| Oral Cavity | 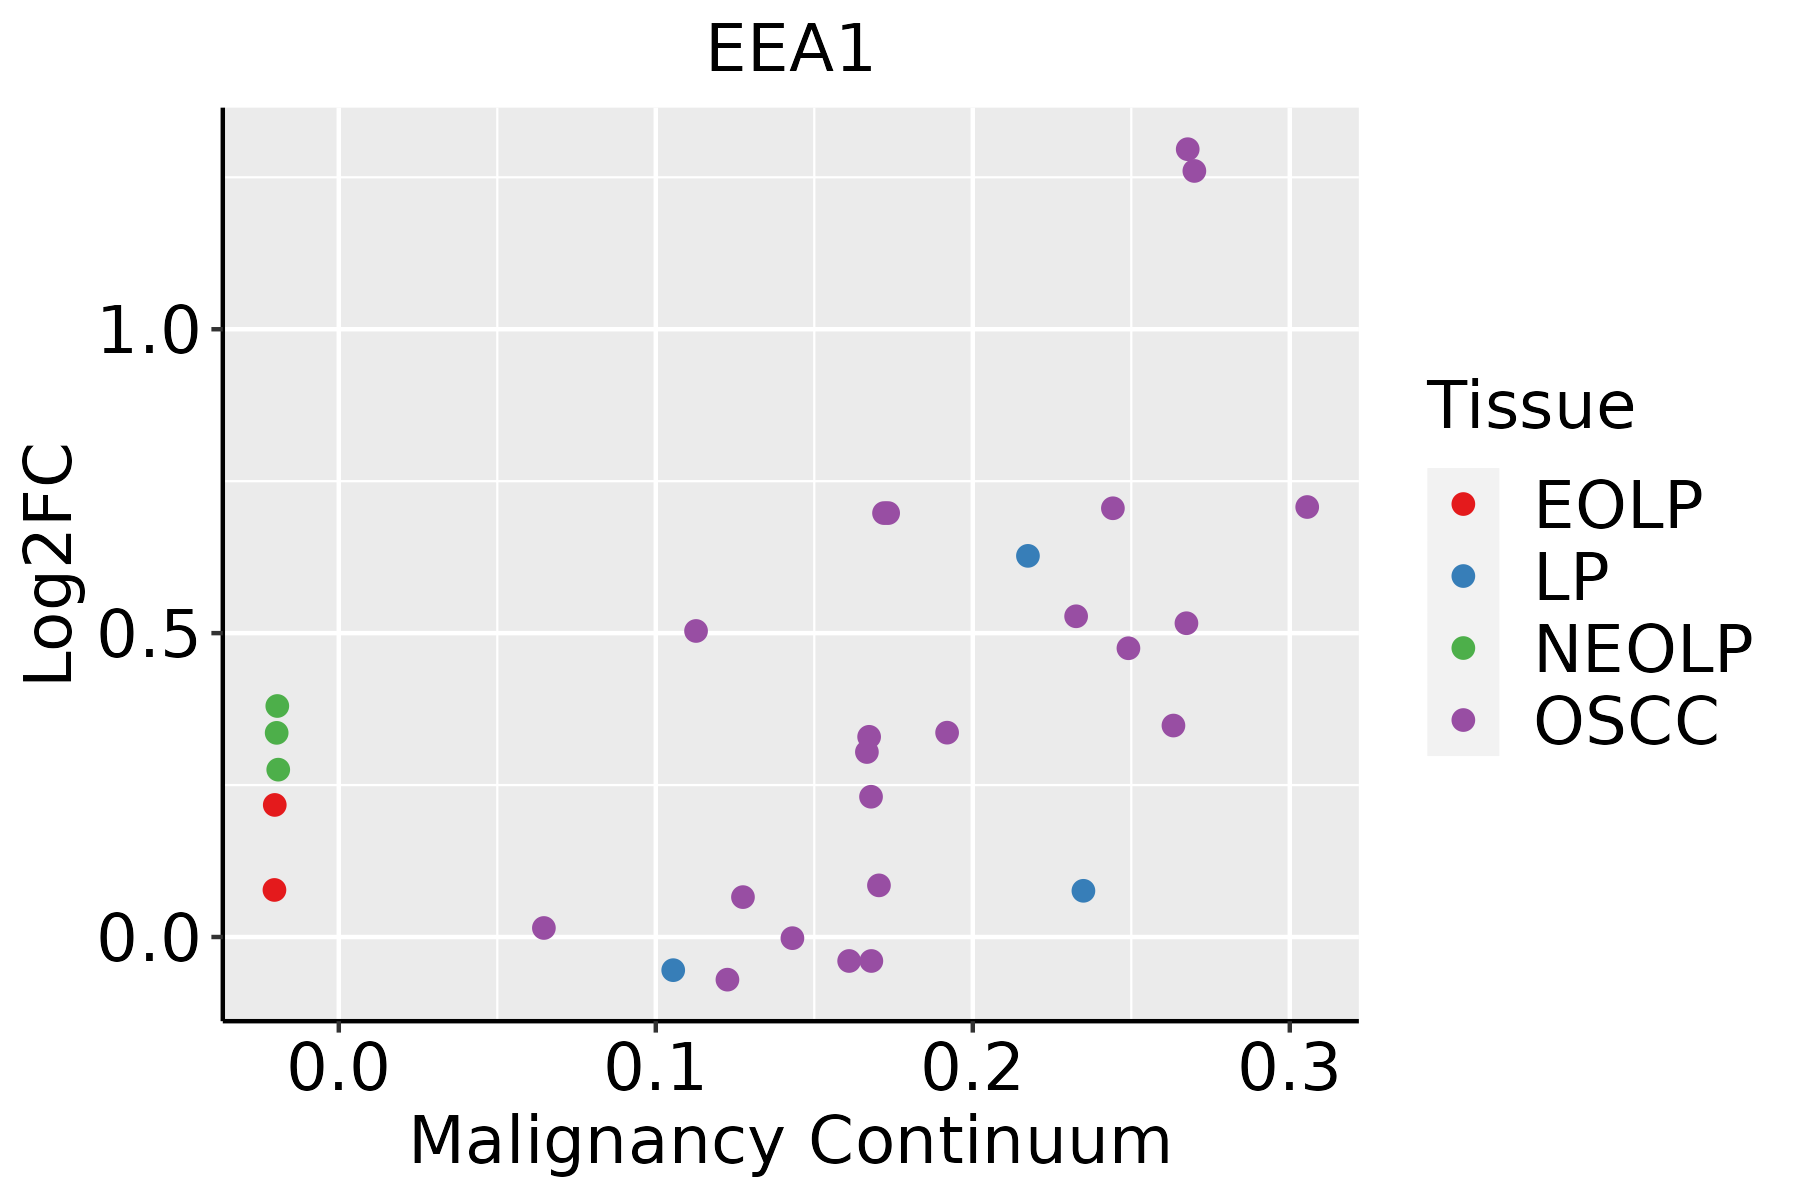 | EOLP: Erosive Oral lichen planus |
| LP: leukoplakia | ||
| NEOLP: Non-erosive oral lichen planus | ||
| OSCC: Oral squamous cell carcinoma | ||
| Skin | 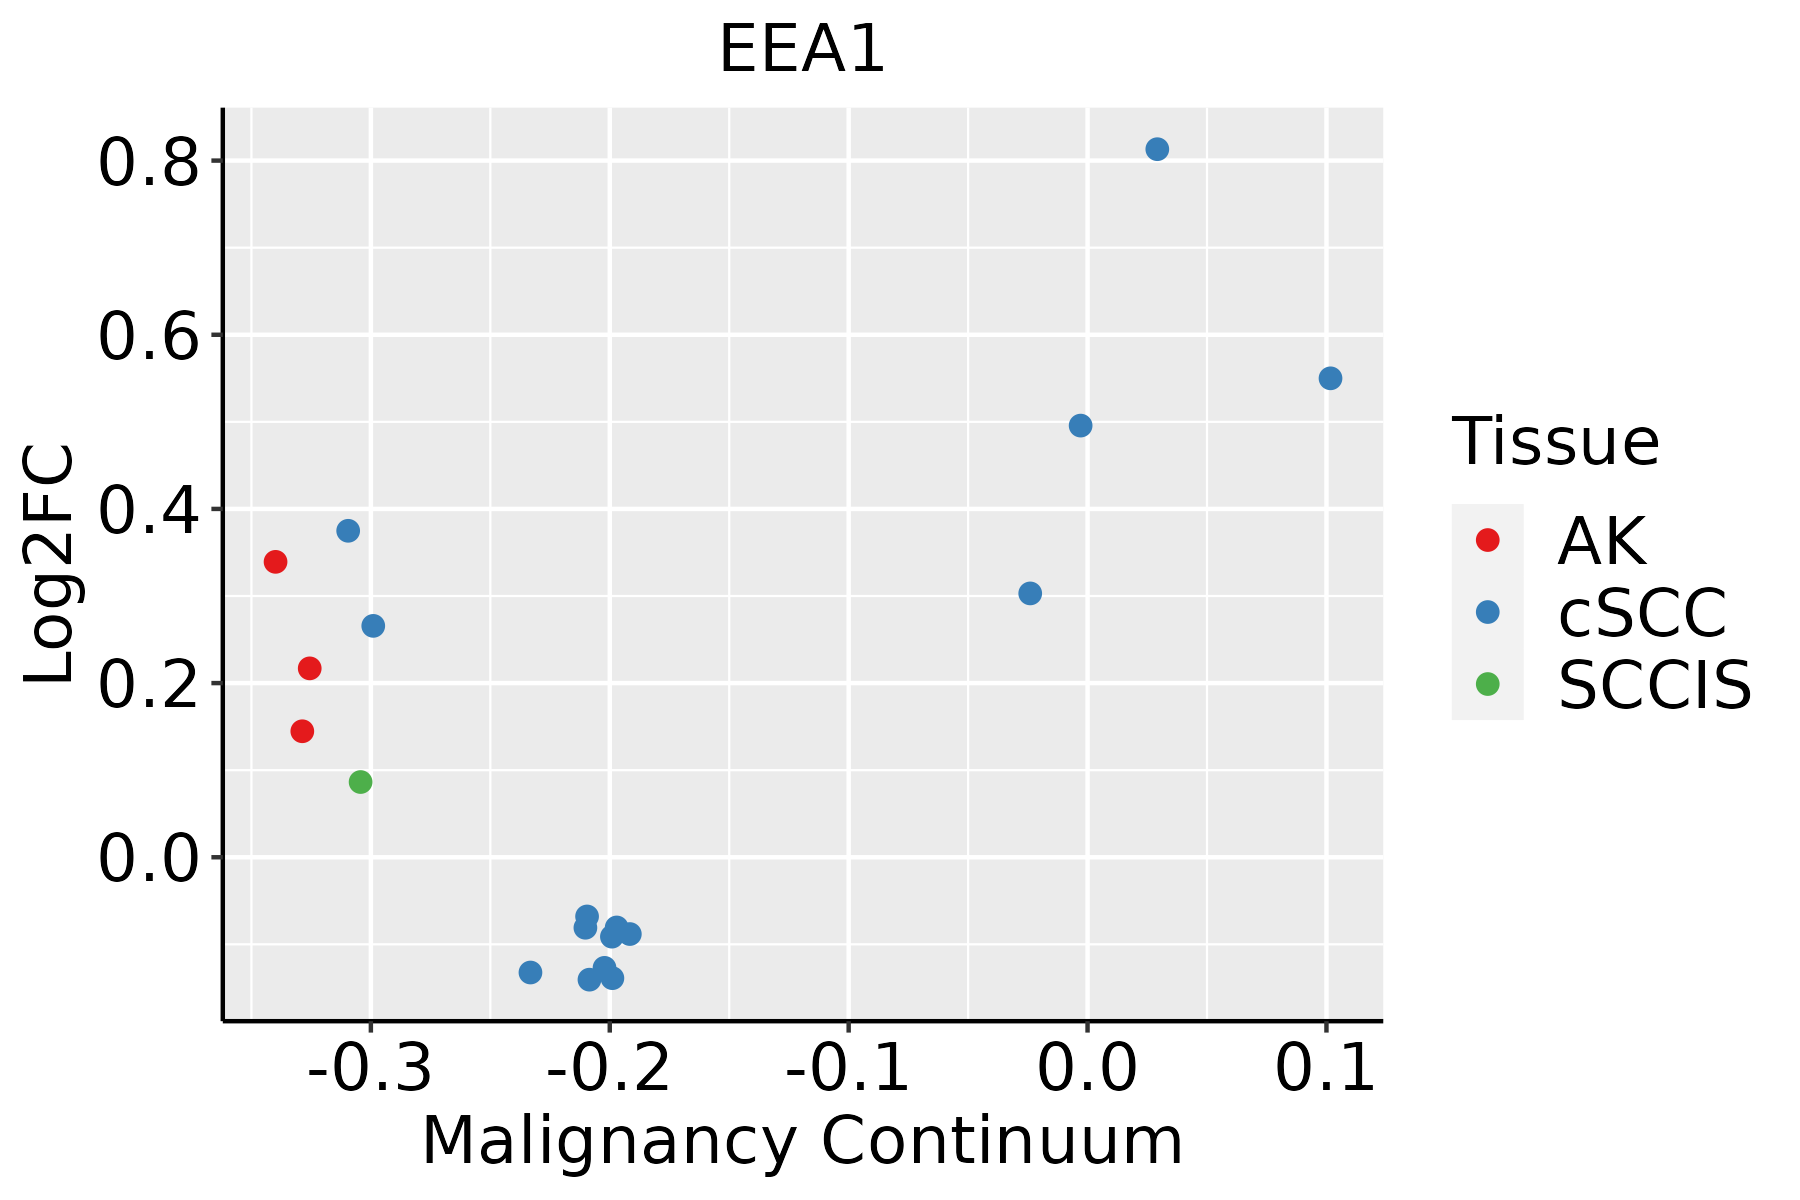 | AK: Actinic keratosis |
| cSCC: Cutaneous squamous cell carcinoma | ||
| SCCIS:squamous cell carcinoma in situ | ||
| Thyroid | 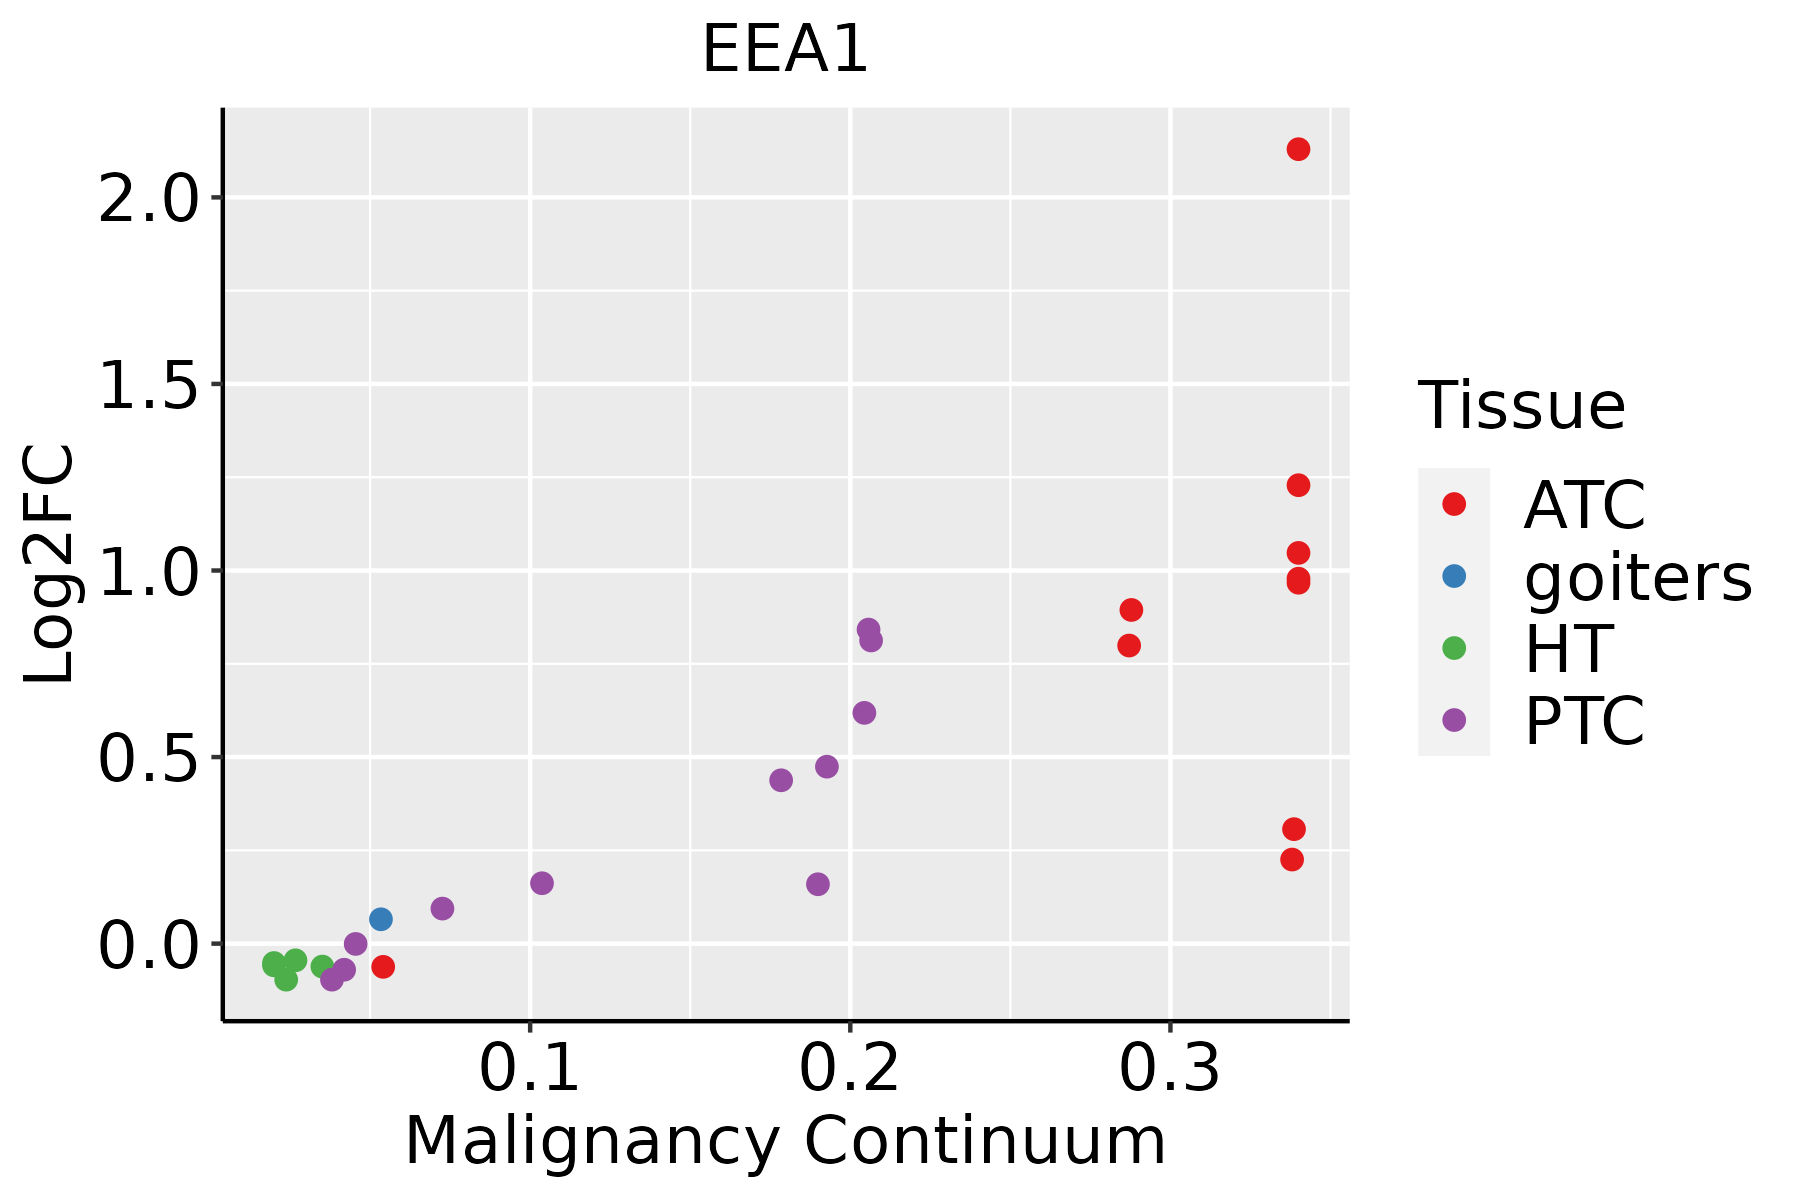 | ATC: Anaplastic thyroid cancer |
| HT: Hashimoto's thyroiditis | ||
| PTC: Papillary thyroid cancer |
| ∗log2FC in expression of this searched gene in stem-like cells from each diseased tissue sample relative to stem-like cells in normal samples in each tissue plotted against the malignancy continuum. Samples are colored based on if they are from different disease stage. |
Top |
Malignant transformation related pathway analysis |
| Find out the enriched GO biological processes and KEGG pathways involved in transition from healthy to precancer to cancer |
| Tissue | Disease Stage | Enriched GO biological Processes |
| Colorectum | AD |  |
| Colorectum | SER |  |
| Colorectum | MSS |  |
| Colorectum | MSI-H |  |
| Colorectum | FAP |  |
| ∗Top 15 enriched GO BP terms are showed in the bar plot of each disease state in each tissue. Each row represents a significant GO biological process which is colored according to the -log10(p.adjust). |
| Page: 1 2 3 4 5 6 7 8 9 |
| GO ID | Tissue | Disease Stage | Description | Gene Ratio | Bg Ratio | pvalue | p.adjust | Count |
| GO:001603210 | Cervix | CC | viral process | 109/2311 | 415/18723 | 5.40e-15 | 6.46e-12 | 109 |
| GO:001905810 | Cervix | CC | viral life cycle | 87/2311 | 317/18723 | 2.20e-13 | 1.20e-10 | 87 |
| GO:001907910 | Cervix | CC | viral genome replication | 35/2311 | 131/18723 | 6.11e-06 | 1.49e-04 | 35 |
| GO:00161977 | Cervix | CC | endosomal transport | 48/2311 | 230/18723 | 1.65e-04 | 1.97e-03 | 48 |
| GO:00995322 | Cervix | CC | synaptic vesicle endosomal processing | 6/2311 | 10/18723 | 4.73e-04 | 4.68e-03 | 6 |
| GO:00160506 | Cervix | CC | vesicle organization | 54/2311 | 300/18723 | 2.71e-03 | 1.85e-02 | 54 |
| GO:00164827 | Cervix | CC | cytosolic transport | 33/2311 | 168/18723 | 4.43e-03 | 2.70e-02 | 33 |
| GO:001603225 | Cervix | N_HPV | viral process | 33/534 | 415/18723 | 1.23e-07 | 1.15e-05 | 33 |
| GO:001905825 | Cervix | N_HPV | viral life cycle | 23/534 | 317/18723 | 4.35e-05 | 1.03e-03 | 23 |
| GO:001907924 | Cervix | N_HPV | viral genome replication | 10/534 | 131/18723 | 4.34e-03 | 3.30e-02 | 10 |
| GO:0016032 | Colorectum | AD | viral process | 168/3918 | 415/18723 | 4.67e-20 | 3.66e-17 | 168 |
| GO:0019058 | Colorectum | AD | viral life cycle | 119/3918 | 317/18723 | 6.18e-12 | 8.23e-10 | 119 |
| GO:0016197 | Colorectum | AD | endosomal transport | 90/3918 | 230/18723 | 1.88e-10 | 1.73e-08 | 90 |
| GO:0016482 | Colorectum | AD | cytosolic transport | 68/3918 | 168/18723 | 6.00e-09 | 3.72e-07 | 68 |
| GO:0016050 | Colorectum | AD | vesicle organization | 101/3918 | 300/18723 | 1.65e-07 | 7.17e-06 | 101 |
| GO:0019079 | Colorectum | AD | viral genome replication | 51/3918 | 131/18723 | 1.83e-06 | 5.51e-05 | 51 |
| GO:0007032 | Colorectum | AD | endosome organization | 33/3918 | 82/18723 | 5.30e-05 | 9.01e-04 | 33 |
| GO:0098927 | Colorectum | AD | vesicle-mediated transport between endosomal compartments | 19/3918 | 43/18723 | 5.03e-04 | 5.43e-03 | 19 |
| GO:0045022 | Colorectum | AD | early endosome to late endosome transport | 17/3918 | 40/18723 | 1.66e-03 | 1.38e-02 | 17 |
| GO:0048284 | Colorectum | AD | organelle fusion | 42/3918 | 141/18723 | 8.04e-03 | 4.73e-02 | 42 |
| Page: 1 2 3 4 5 6 7 8 9 10 |
| Pathway ID | Tissue | Disease Stage | Description | Gene Ratio | Bg Ratio | pvalue | p.adjust | qvalue | Count |
| hsa0414520 | Cervix | CC | Phagosome | 47/1267 | 152/8465 | 3.95e-07 | 4.26e-06 | 2.52e-06 | 47 |
| hsa0414418 | Cervix | CC | Endocytosis | 64/1267 | 251/8465 | 6.97e-06 | 6.10e-05 | 3.61e-05 | 64 |
| hsa05152 | Cervix | CC | Tuberculosis | 42/1267 | 180/8465 | 1.78e-03 | 7.21e-03 | 4.26e-03 | 42 |
| hsa04145110 | Cervix | CC | Phagosome | 47/1267 | 152/8465 | 3.95e-07 | 4.26e-06 | 2.52e-06 | 47 |
| hsa0414419 | Cervix | CC | Endocytosis | 64/1267 | 251/8465 | 6.97e-06 | 6.10e-05 | 3.61e-05 | 64 |
| hsa051521 | Cervix | CC | Tuberculosis | 42/1267 | 180/8465 | 1.78e-03 | 7.21e-03 | 4.26e-03 | 42 |
| hsa0414542 | Cervix | N_HPV | Phagosome | 24/349 | 152/8465 | 1.17e-08 | 2.88e-07 | 2.25e-07 | 24 |
| hsa051524 | Cervix | N_HPV | Tuberculosis | 16/349 | 180/8465 | 3.05e-03 | 1.73e-02 | 1.35e-02 | 16 |
| hsa0414552 | Cervix | N_HPV | Phagosome | 24/349 | 152/8465 | 1.17e-08 | 2.88e-07 | 2.25e-07 | 24 |
| hsa051525 | Cervix | N_HPV | Tuberculosis | 16/349 | 180/8465 | 3.05e-03 | 1.73e-02 | 1.35e-02 | 16 |
| hsa04144 | Colorectum | AD | Endocytosis | 111/2092 | 251/8465 | 5.95e-12 | 1.42e-10 | 9.08e-11 | 111 |
| hsa041441 | Colorectum | AD | Endocytosis | 111/2092 | 251/8465 | 5.95e-12 | 1.42e-10 | 9.08e-11 | 111 |
| hsa041442 | Colorectum | SER | Endocytosis | 81/1580 | 251/8465 | 1.14e-07 | 2.36e-06 | 1.71e-06 | 81 |
| hsa041443 | Colorectum | SER | Endocytosis | 81/1580 | 251/8465 | 1.14e-07 | 2.36e-06 | 1.71e-06 | 81 |
| hsa041444 | Colorectum | MSS | Endocytosis | 102/1875 | 251/8465 | 1.85e-11 | 4.43e-10 | 2.71e-10 | 102 |
| hsa041445 | Colorectum | MSS | Endocytosis | 102/1875 | 251/8465 | 1.85e-11 | 4.43e-10 | 2.71e-10 | 102 |
| hsa041446 | Colorectum | FAP | Endocytosis | 78/1404 | 251/8465 | 6.20e-09 | 2.96e-07 | 1.80e-07 | 78 |
| hsa041447 | Colorectum | FAP | Endocytosis | 78/1404 | 251/8465 | 6.20e-09 | 2.96e-07 | 1.80e-07 | 78 |
| hsa041448 | Colorectum | CRC | Endocytosis | 65/1091 | 251/8465 | 1.27e-08 | 1.06e-06 | 7.19e-07 | 65 |
| hsa041449 | Colorectum | CRC | Endocytosis | 65/1091 | 251/8465 | 1.27e-08 | 1.06e-06 | 7.19e-07 | 65 |
| Page: 1 2 3 |
Top |
Cell-cell communication analysis |
| Identification of potential cell-cell interactions between two cell types and their ligand-receptor pairs for different disease states |
| Ligand | Receptor | LRpair | Pathway | Tissue | Disease Stage |
| Page: 1 |
Top |
Single-cell gene regulatory network inference analysis |
| Find out the significant the regulons (TFs) and the target genes of each regulon across cell types for different disease states |
| TF | Cell Type | Tissue | Disease Stage | Target Gene | RSS | Regulon Activity |
| ∗The dot plots of a searched regulon are shown for all cell subpopulations in each disease state of each tissue based on the regulon specific score inferred using pySCENIC and by calculating the average expression. |
| Page: 1 |
Top |
Somatic mutation of malignant transformation related genes |
| Annotation of somatic variants for genes involved in malignant transformation |
| Hugo Symbol | Variant Class | Variant Classification | dbSNP RS | HGVSc | HGVSp | HGVSp Short | SWISSPROT | BIOTYPE | SIFT | PolyPhen | Tumor Sample Barcode | Tissue | Histology | Sex | Age | Stage | Therapy Types | Drugs | Outcome |
| EEA1 | SNV | Missense_Mutation | c.1153G>C | p.Glu385Gln | p.E385Q | Q15075 | protein_coding | deleterious(0.01) | possibly_damaging(0.666) | TCGA-A2-A04X-01 | Breast | breast invasive carcinoma | Female | <65 | I/II | Chemotherapy | adriamycin | SD | |
| EEA1 | SNV | Missense_Mutation | c.3172C>G | p.Leu1058Val | p.L1058V | Q15075 | protein_coding | tolerated(0.21) | probably_damaging(0.978) | TCGA-A8-A076-01 | Breast | breast invasive carcinoma | Female | >=65 | I/II | Hormone Therapy | anastrozole | SD | |
| EEA1 | SNV | Missense_Mutation | novel | c.3706N>C | p.Glu1236Gln | p.E1236Q | Q15075 | protein_coding | deleterious(0) | benign(0.229) | TCGA-A8-A09G-01 | Breast | breast invasive carcinoma | Female | >=65 | III/IV | Unknown | Unknown | SD |
| EEA1 | SNV | Missense_Mutation | c.3889N>C | p.Glu1297Gln | p.E1297Q | Q15075 | protein_coding | deleterious(0) | possibly_damaging(0.868) | TCGA-AC-A23H-01 | Breast | breast invasive carcinoma | Female | >=65 | I/II | Unknown | Unknown | PD | |
| EEA1 | SNV | Missense_Mutation | c.1252N>G | p.Gln418Glu | p.Q418E | Q15075 | protein_coding | deleterious(0.03) | probably_damaging(0.93) | TCGA-AC-A23H-01 | Breast | breast invasive carcinoma | Female | >=65 | I/II | Unknown | Unknown | PD | |
| EEA1 | SNV | Missense_Mutation | rs748549413 | c.2176G>A | p.Glu726Lys | p.E726K | Q15075 | protein_coding | tolerated(0.13) | probably_damaging(0.981) | TCGA-BH-A0BR-01 | Breast | breast invasive carcinoma | Female | <65 | I/II | Unknown | Unknown | SD |
| EEA1 | SNV | Missense_Mutation | c.1106A>G | p.Glu369Gly | p.E369G | Q15075 | protein_coding | deleterious(0) | probably_damaging(0.986) | TCGA-D8-A1XQ-01 | Breast | breast invasive carcinoma | Female | >=65 | I/II | Unknown | Unknown | SD | |
| EEA1 | SNV | Missense_Mutation | c.1820N>T | p.Ala607Val | p.A607V | Q15075 | protein_coding | tolerated(0.06) | probably_damaging(0.985) | TCGA-D8-A27G-01 | Breast | breast invasive carcinoma | Female | >=65 | I/II | Unknown | Unknown | SD | |
| EEA1 | SNV | Missense_Mutation | novel | c.661G>A | p.Glu221Lys | p.E221K | Q15075 | protein_coding | deleterious(0.01) | probably_damaging(0.98) | TCGA-E2-A573-01 | Breast | breast invasive carcinoma | Female | <65 | I/II | Chemotherapy | taxotere | CR |
| EEA1 | SNV | Missense_Mutation | novel | c.3995N>A | p.Arg1332Lys | p.R1332K | Q15075 | protein_coding | deleterious(0) | possibly_damaging(0.811) | TCGA-GM-A2D9-01 | Breast | breast invasive carcinoma | Female | >=65 | I/II | Hormone Therapy | arimidex | SD |
| Page: 1 2 3 4 5 6 7 8 9 10 11 12 13 14 15 |
Top |
Related drugs of malignant transformation related genes |
| Identification of chemicals and drugs interact with genes involved in malignant transfromation |
| (DGIdb 4.0) |
| Entrez ID | Symbol | Category | Interaction Types | Drug Claim Name | Drug Name | PMIDs |
| Page: 1 |

Copyright 2023-Present -The University of Texas Health Science Center at Houston |