
|
|||||
|
 | |
| |
| |
| |
| |
| |
|
Gene: EDN2 |
Gene summary for EDN2 |
| Gene information | Species | Human | Gene symbol | EDN2 | Gene ID | 1907 |
| Gene name | endothelin 2 | |
| Gene Alias | ET-2 | |
| Cytomap | 1p34.2 | |
| Gene Type | protein-coding | GO ID | GO:0001516 | UniProtAcc | P20800 |
Top |
Malignant transformation analysis |
| Identification of the aberrant gene expression in precancerous and cancerous lesions by comparing the gene expression of stem-like cells in diseased tissues with normal stem cells |
| Entrez ID | Symbol | Replicates | Species | Organ | Tissue | Adj P-value | Log2FC | Malignancy |
| 1907 | EDN2 | sample1 | Human | Cervix | CC | 2.90e-10 | 6.38e-01 | 0.0959 |
| 1907 | EDN2 | T1 | Human | Cervix | CC | 4.38e-17 | 6.37e-01 | 0.0918 |
| 1907 | EDN2 | LZE8T | Human | Esophagus | ESCC | 1.08e-02 | 5.21e-01 | 0.067 |
| 1907 | EDN2 | LZE20T | Human | Esophagus | ESCC | 1.21e-02 | 7.34e-01 | 0.0662 |
| 1907 | EDN2 | LZE24T | Human | Esophagus | ESCC | 2.80e-14 | 1.24e+00 | 0.0596 |
| 1907 | EDN2 | P1T-E | Human | Esophagus | ESCC | 3.89e-04 | 1.00e+00 | 0.0875 |
| 1907 | EDN2 | P4T-E | Human | Esophagus | ESCC | 1.46e-13 | 9.51e-01 | 0.1323 |
| 1907 | EDN2 | P10T-E | Human | Esophagus | ESCC | 1.35e-07 | 4.59e-01 | 0.116 |
| 1907 | EDN2 | P20T-E | Human | Esophagus | ESCC | 1.74e-05 | 1.11e+00 | 0.1124 |
| 1907 | EDN2 | P21T-E | Human | Esophagus | ESCC | 3.43e-32 | 1.48e+00 | 0.1617 |
| 1907 | EDN2 | P22T-E | Human | Esophagus | ESCC | 4.23e-02 | 1.68e-01 | 0.1236 |
| 1907 | EDN2 | P23T-E | Human | Esophagus | ESCC | 3.44e-04 | 1.04e+00 | 0.108 |
| 1907 | EDN2 | P26T-E | Human | Esophagus | ESCC | 1.06e-08 | 9.00e-01 | 0.1276 |
| 1907 | EDN2 | P27T-E | Human | Esophagus | ESCC | 1.27e-14 | 6.98e-01 | 0.1055 |
| 1907 | EDN2 | P31T-E | Human | Esophagus | ESCC | 2.18e-07 | 6.70e-01 | 0.1251 |
| 1907 | EDN2 | P37T-E | Human | Esophagus | ESCC | 1.66e-05 | 4.76e-01 | 0.1371 |
| 1907 | EDN2 | P42T-E | Human | Esophagus | ESCC | 1.52e-06 | 1.11e+00 | 0.1175 |
| 1907 | EDN2 | P48T-E | Human | Esophagus | ESCC | 1.09e-03 | 4.28e-01 | 0.0959 |
| 1907 | EDN2 | P52T-E | Human | Esophagus | ESCC | 3.03e-11 | 6.75e-01 | 0.1555 |
| 1907 | EDN2 | P54T-E | Human | Esophagus | ESCC | 3.44e-13 | 1.09e+00 | 0.0975 |
| Page: 1 2 |
| Tissue | Expression Dynamics | Abbreviation |
| Cervix | 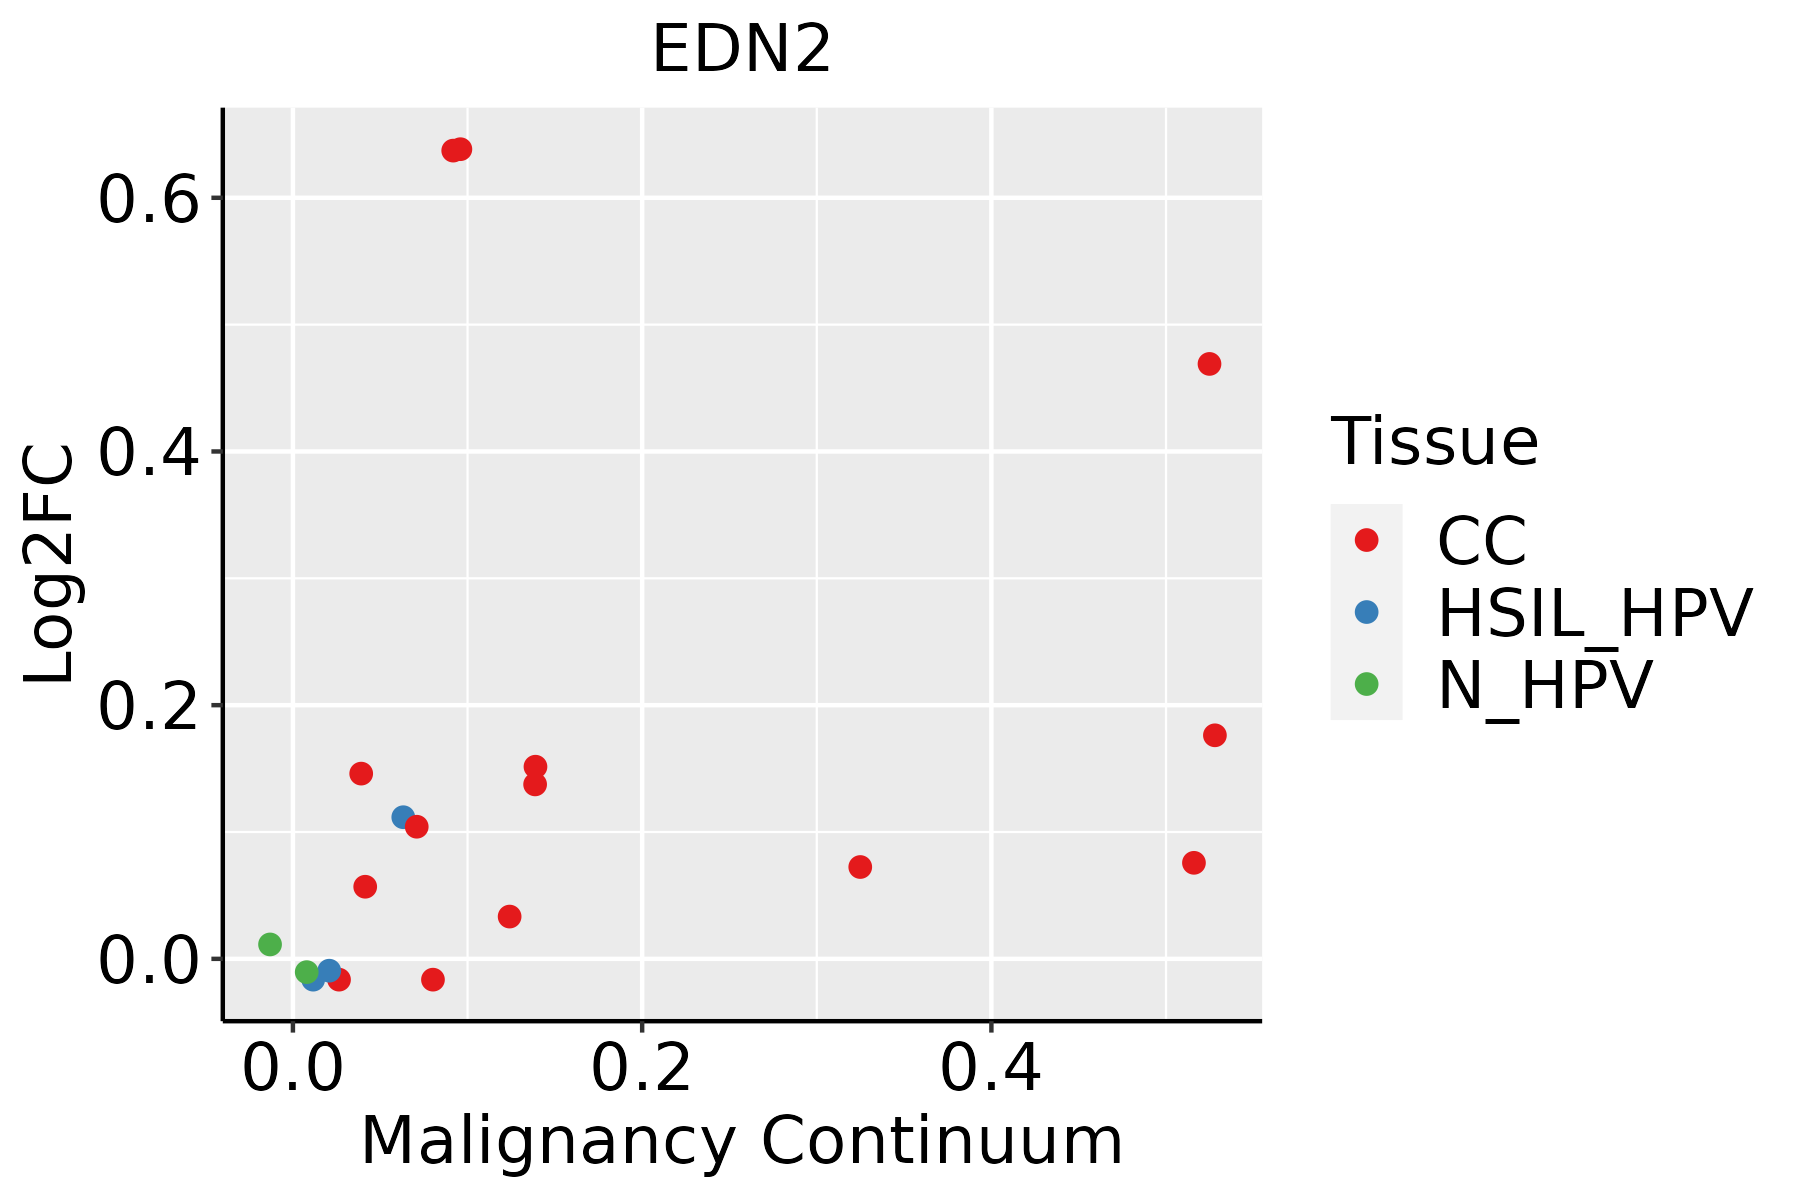 | CC: Cervix cancer |
| HSIL_HPV: HPV-infected high-grade squamous intraepithelial lesions | ||
| N_HPV: HPV-infected normal cervix | ||
| Esophagus |  | ESCC: Esophageal squamous cell carcinoma |
| HGIN: High-grade intraepithelial neoplasias | ||
| LGIN: Low-grade intraepithelial neoplasias | ||
| Oral Cavity | 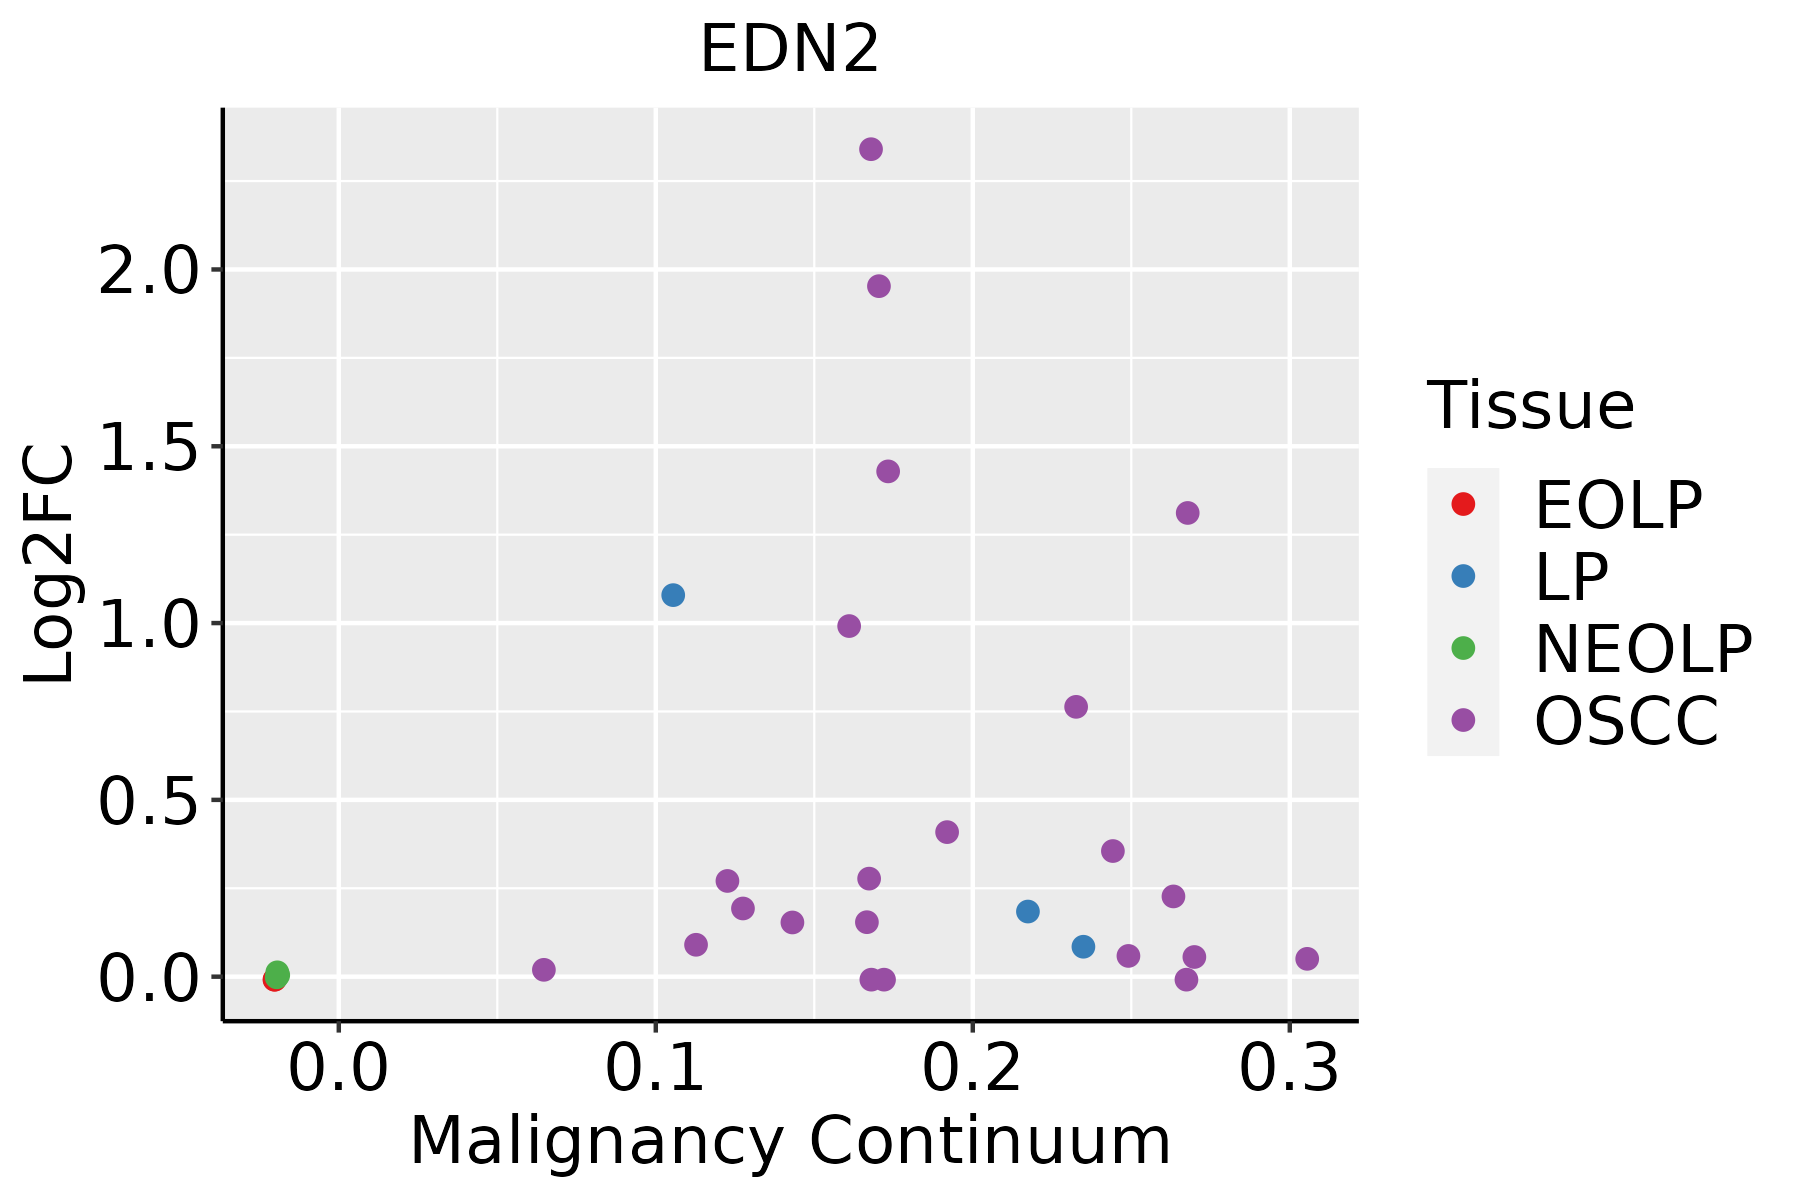 | EOLP: Erosive Oral lichen planus |
| LP: leukoplakia | ||
| NEOLP: Non-erosive oral lichen planus | ||
| OSCC: Oral squamous cell carcinoma |
| ∗log2FC in expression of this searched gene in stem-like cells from each diseased tissue sample relative to stem-like cells in normal samples in each tissue plotted against the malignancy continuum. Samples are colored based on if they are from different disease stage. |
Top |
Malignant transformation related pathway analysis |
| Find out the enriched GO biological processes and KEGG pathways involved in transition from healthy to precancer to cancer |
| Tissue | Disease Stage | Enriched GO biological Processes |
| Colorectum | AD |  |
| Colorectum | SER |  |
| Colorectum | MSS |  |
| Colorectum | MSI-H |  |
| Colorectum | FAP |  |
| ∗Top 15 enriched GO BP terms are showed in the bar plot of each disease state in each tissue. Each row represents a significant GO biological process which is colored according to the -log10(p.adjust). |
| Page: 1 2 3 4 5 6 7 8 9 |
| GO ID | Tissue | Disease Stage | Description | Gene Ratio | Bg Ratio | pvalue | p.adjust | Count |
| GO:00321035 | Cervix | CC | positive regulation of response to external stimulus | 95/2311 | 427/18723 | 5.44e-09 | 5.03e-07 | 95 |
| GO:00603267 | Cervix | CC | cell chemotaxis | 73/2311 | 310/18723 | 2.82e-08 | 1.96e-06 | 73 |
| GO:00975298 | Cervix | CC | myeloid leukocyte migration | 56/2311 | 220/18723 | 7.21e-08 | 4.15e-06 | 56 |
| GO:00305957 | Cervix | CC | leukocyte chemotaxis | 57/2311 | 230/18723 | 1.48e-07 | 7.07e-06 | 57 |
| GO:00716218 | Cervix | CC | granulocyte chemotaxis | 37/2311 | 125/18723 | 2.16e-07 | 9.56e-06 | 37 |
| GO:00509007 | Cervix | CC | leukocyte migration | 78/2311 | 369/18723 | 1.09e-06 | 3.80e-05 | 78 |
| GO:00975308 | Cervix | CC | granulocyte migration | 39/2311 | 148/18723 | 2.67e-06 | 7.87e-05 | 39 |
| GO:00026857 | Cervix | CC | regulation of leukocyte migration | 50/2311 | 210/18723 | 2.95e-06 | 8.31e-05 | 50 |
| GO:00026888 | Cervix | CC | regulation of leukocyte chemotaxis | 34/2311 | 122/18723 | 3.00e-06 | 8.38e-05 | 34 |
| GO:00305938 | Cervix | CC | neutrophil chemotaxis | 30/2311 | 103/18723 | 4.24e-06 | 1.09e-04 | 30 |
| GO:00509203 | Cervix | CC | regulation of chemotaxis | 51/2311 | 223/18723 | 8.03e-06 | 1.86e-04 | 51 |
| GO:00026878 | Cervix | CC | positive regulation of leukocyte migration | 35/2311 | 135/18723 | 1.25e-05 | 2.60e-04 | 35 |
| GO:19902666 | Cervix | CC | neutrophil migration | 32/2311 | 122/18723 | 2.25e-05 | 4.00e-04 | 32 |
| GO:00026906 | Cervix | CC | positive regulation of leukocyte chemotaxis | 26/2311 | 94/18723 | 4.85e-05 | 7.34e-04 | 26 |
| GO:00509213 | Cervix | CC | positive regulation of chemotaxis | 34/2311 | 141/18723 | 8.19e-05 | 1.11e-03 | 34 |
| GO:00482464 | Cervix | CC | macrophage chemotaxis | 14/2311 | 38/18723 | 9.80e-05 | 1.27e-03 | 14 |
| GO:00192213 | Cervix | CC | cytokine-mediated signaling pathway | 84/2311 | 472/18723 | 3.25e-04 | 3.44e-03 | 84 |
| GO:19055174 | Cervix | CC | macrophage migration | 16/2311 | 55/18723 | 7.23e-04 | 6.51e-03 | 16 |
| GO:00303245 | Cervix | CC | lung development | 36/2311 | 177/18723 | 1.64e-03 | 1.26e-02 | 36 |
| GO:00303235 | Cervix | CC | respiratory tube development | 36/2311 | 181/18723 | 2.46e-03 | 1.71e-02 | 36 |
| Page: 1 2 3 4 |
| Pathway ID | Tissue | Disease Stage | Description | Gene Ratio | Bg Ratio | pvalue | p.adjust | qvalue | Count |
| Page: 1 |
Top |
Cell-cell communication analysis |
| Identification of potential cell-cell interactions between two cell types and their ligand-receptor pairs for different disease states |
| Ligand | Receptor | LRpair | Pathway | Tissue | Disease Stage |
| EDN2 | EDNRA | EDN2_EDNRA | EDN | Cervix | CC |
| EDN2 | EDNRA | EDN2_EDNRA | EDN | Esophagus | ESCC |
| EDN2 | EDNRB | EDN2_EDNRB | EDN | Esophagus | ESCC |
| Page: 1 |
Top |
Single-cell gene regulatory network inference analysis |
| Find out the significant the regulons (TFs) and the target genes of each regulon across cell types for different disease states |
| TF | Cell Type | Tissue | Disease Stage | Target Gene | RSS | Regulon Activity |
| ∗The dot plots of a searched regulon are shown for all cell subpopulations in each disease state of each tissue based on the regulon specific score inferred using pySCENIC and by calculating the average expression. |
| Page: 1 |
Top |
Somatic mutation of malignant transformation related genes |
| Annotation of somatic variants for genes involved in malignant transformation |
| Hugo Symbol | Variant Class | Variant Classification | dbSNP RS | HGVSc | HGVSp | HGVSp Short | SWISSPROT | BIOTYPE | SIFT | PolyPhen | Tumor Sample Barcode | Tissue | Histology | Sex | Age | Stage | Therapy Types | Drugs | Outcome |
| EDN2 | SNV | Missense_Mutation | novel | c.196G>C | p.Asp66His | p.D66H | P20800 | protein_coding | deleterious(0) | probably_damaging(1) | TCGA-IR-A3LL-01 | Cervix | cervical & endocervical cancer | Female | <65 | I/II | Chemotherapy | cisplatin | CR |
| EDN2 | SNV | Missense_Mutation | c.491C>A | p.Ala164Asp | p.A164D | P20800 | protein_coding | tolerated(0.15) | benign(0.102) | TCGA-F5-6810-01 | Colorectum | rectum adenocarcinoma | Unknown | Unknown | I/II | Unknown | Unknown | Unknown | |
| EDN2 | SNV | Missense_Mutation | rs764912588 | c.496C>T | p.Arg166Trp | p.R166W | P20800 | protein_coding | deleterious(0) | benign(0) | TCGA-AX-A2HC-01 | Endometrium | uterine corpus endometrioid carcinoma | Female | <65 | III/IV | Chemotherapy | paclitaxel | PD |
| EDN2 | SNV | Missense_Mutation | c.475N>G | p.Lys159Glu | p.K159E | P20800 | protein_coding | tolerated(0.12) | benign(0) | TCGA-D1-A174-01 | Endometrium | uterine corpus endometrioid carcinoma | Female | <65 | I/II | Unknown | Unknown | SD | |
| EDN2 | SNV | Missense_Mutation | novel | c.311C>A | p.Pro104His | p.P104H | P20800 | protein_coding | tolerated(0.15) | benign(0.007) | TCGA-DD-AADD-01 | Liver | liver hepatocellular carcinoma | Male | <65 | I/II | Unknown | Unknown | SD |
| EDN2 | SNV | Missense_Mutation | c.260N>T | p.Arg87Leu | p.R87L | P20800 | protein_coding | deleterious(0) | probably_damaging(0.98) | TCGA-55-1595-01 | Lung | lung adenocarcinoma | Female | >=65 | I/II | Unknown | Unknown | SD | |
| EDN2 | SNV | Missense_Mutation | rs759554381 | c.349N>C | p.Glu117Gln | p.E117Q | P20800 | protein_coding | tolerated(0.47) | benign(0.011) | TCGA-CN-4723-01 | Oral cavity | head & neck squamous cell carcinoma | Male | >=65 | I/II | Unknown | Unknown | SD |
| EDN2 | SNV | Missense_Mutation | c.242T>A | p.Leu81Gln | p.L81Q | P20800 | protein_coding | deleterious(0) | probably_damaging(0.994) | TCGA-CH-5754-01 | Prostate | prostate adenocarcinoma | Male | >=65 | 9 | Unknown | Unknown | SD | |
| EDN2 | SNV | Missense_Mutation | c.167N>G | p.Asp56Gly | p.D56G | P20800 | protein_coding | deleterious(0) | probably_damaging(1) | TCGA-BR-8680-01 | Stomach | stomach adenocarcinoma | Male | <65 | III/IV | Chemotherapy | oxaliplatin | CR | |
| EDN2 | SNV | Missense_Mutation | rs764912588 | c.496N>T | p.Arg166Trp | p.R166W | P20800 | protein_coding | deleterious(0) | benign(0) | TCGA-VQ-AA6D-01 | Stomach | stomach adenocarcinoma | Female | <65 | III/IV | Chemotherapy | fluorouracil | CR |
| Page: 1 |
Top |
Related drugs of malignant transformation related genes |
| Identification of chemicals and drugs interact with genes involved in malignant transfromation |
| (DGIdb 4.0) |
| Entrez ID | Symbol | Category | Interaction Types | Drug Claim Name | Drug Name | PMIDs |
| Page: 1 |

Copyright 2023-Present -The University of Texas Health Science Center at Houston |