
|
|||||
|
 | |
| |
| |
| |
| |
| |
|
Gene: EDN1 |
Gene summary for EDN1 |
| Gene information | Species | Human | Gene symbol | EDN1 | Gene ID | 1906 |
| Gene name | endothelin 1 | |
| Gene Alias | ARCND3 | |
| Cytomap | 6p24.1 | |
| Gene Type | protein-coding | GO ID | GO:0000003 | UniProtAcc | P05305 |
Top |
Malignant transformation analysis |
| Identification of the aberrant gene expression in precancerous and cancerous lesions by comparing the gene expression of stem-like cells in diseased tissues with normal stem cells |
| Entrez ID | Symbol | Replicates | Species | Organ | Tissue | Adj P-value | Log2FC | Malignancy |
| 1906 | EDN1 | HTA11_1938_2000001011 | Human | Colorectum | AD | 1.20e-08 | 6.73e-01 | -0.0811 |
| 1906 | EDN1 | HTA11_347_2000001011 | Human | Colorectum | AD | 1.64e-08 | 3.18e-01 | -0.1954 |
| 1906 | EDN1 | HTA11_6818_2000001021 | Human | Colorectum | AD | 3.11e-04 | 3.55e-01 | 0.0588 |
| 1906 | EDN1 | HTA11_99999965104_69814 | Human | Colorectum | MSS | 7.92e-16 | 7.07e-01 | 0.281 |
| 1906 | EDN1 | HTA11_99999971662_82457 | Human | Colorectum | MSS | 2.37e-02 | 1.20e-01 | 0.3859 |
| 1906 | EDN1 | A002-C-203 | Human | Colorectum | FAP | 3.23e-04 | 2.57e-01 | 0.2786 |
| 1906 | EDN1 | A001-C-108 | Human | Colorectum | FAP | 1.25e-09 | 4.49e-01 | -0.0272 |
| 1906 | EDN1 | A001-C-104 | Human | Colorectum | FAP | 2.57e-10 | 4.46e-01 | 0.0184 |
| 1906 | EDN1 | A001-C-014 | Human | Colorectum | FAP | 1.01e-02 | 1.82e-01 | 0.0135 |
| 1906 | EDN1 | A001-C-203 | Human | Colorectum | FAP | 8.84e-07 | 3.38e-01 | -0.0481 |
| 1906 | EDN1 | A008-E-015 | Human | Colorectum | FAP | 5.76e-04 | 1.90e-01 | 0.0177 |
| 1906 | EDN1 | LZE4T | Human | Esophagus | ESCC | 2.68e-17 | 1.08e+00 | 0.0811 |
| 1906 | EDN1 | LZE7T | Human | Esophagus | ESCC | 3.83e-09 | 1.57e+00 | 0.0667 |
| 1906 | EDN1 | LZE22T | Human | Esophagus | ESCC | 2.92e-02 | 1.55e+00 | 0.068 |
| 1906 | EDN1 | LZE24T | Human | Esophagus | ESCC | 2.82e-15 | 1.54e+00 | 0.0596 |
| 1906 | EDN1 | P4T-E | Human | Esophagus | ESCC | 1.02e-06 | 7.29e-01 | 0.1323 |
| 1906 | EDN1 | P5T-E | Human | Esophagus | ESCC | 9.20e-18 | 1.02e+00 | 0.1327 |
| 1906 | EDN1 | P8T-E | Human | Esophagus | ESCC | 2.00e-19 | 1.13e+00 | 0.0889 |
| 1906 | EDN1 | P9T-E | Human | Esophagus | ESCC | 2.01e-24 | 1.31e+00 | 0.1131 |
| 1906 | EDN1 | P10T-E | Human | Esophagus | ESCC | 5.95e-14 | 4.31e-01 | 0.116 |
| Page: 1 2 3 4 5 |
| Tissue | Expression Dynamics | Abbreviation |
| Colorectum (GSE201348) |  | FAP: Familial adenomatous polyposis |
| CRC: Colorectal cancer | ||
| Colorectum (HTA11) |  | AD: Adenomas |
| SER: Sessile serrated lesions | ||
| MSI-H: Microsatellite-high colorectal cancer | ||
| MSS: Microsatellite stable colorectal cancer | ||
| Esophagus | 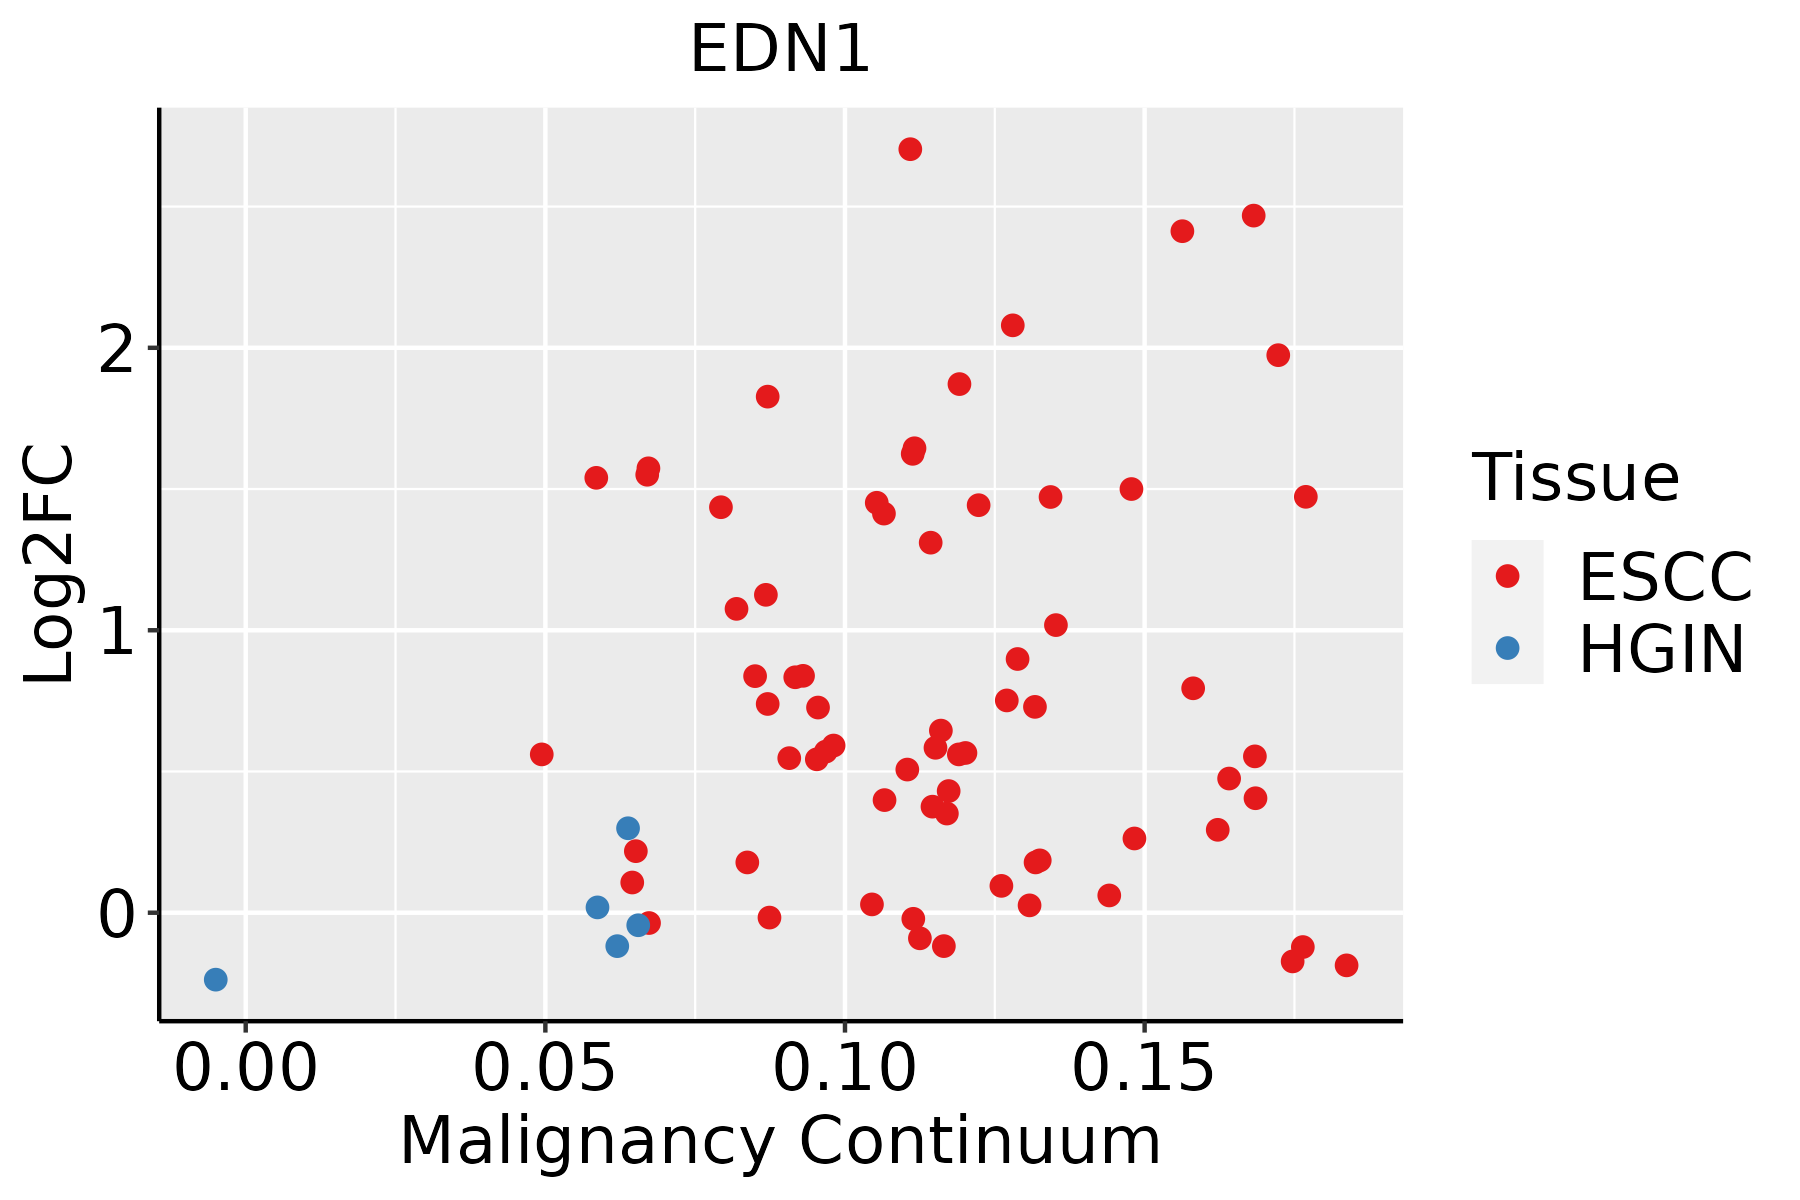 | ESCC: Esophageal squamous cell carcinoma |
| HGIN: High-grade intraepithelial neoplasias | ||
| LGIN: Low-grade intraepithelial neoplasias | ||
| Liver | 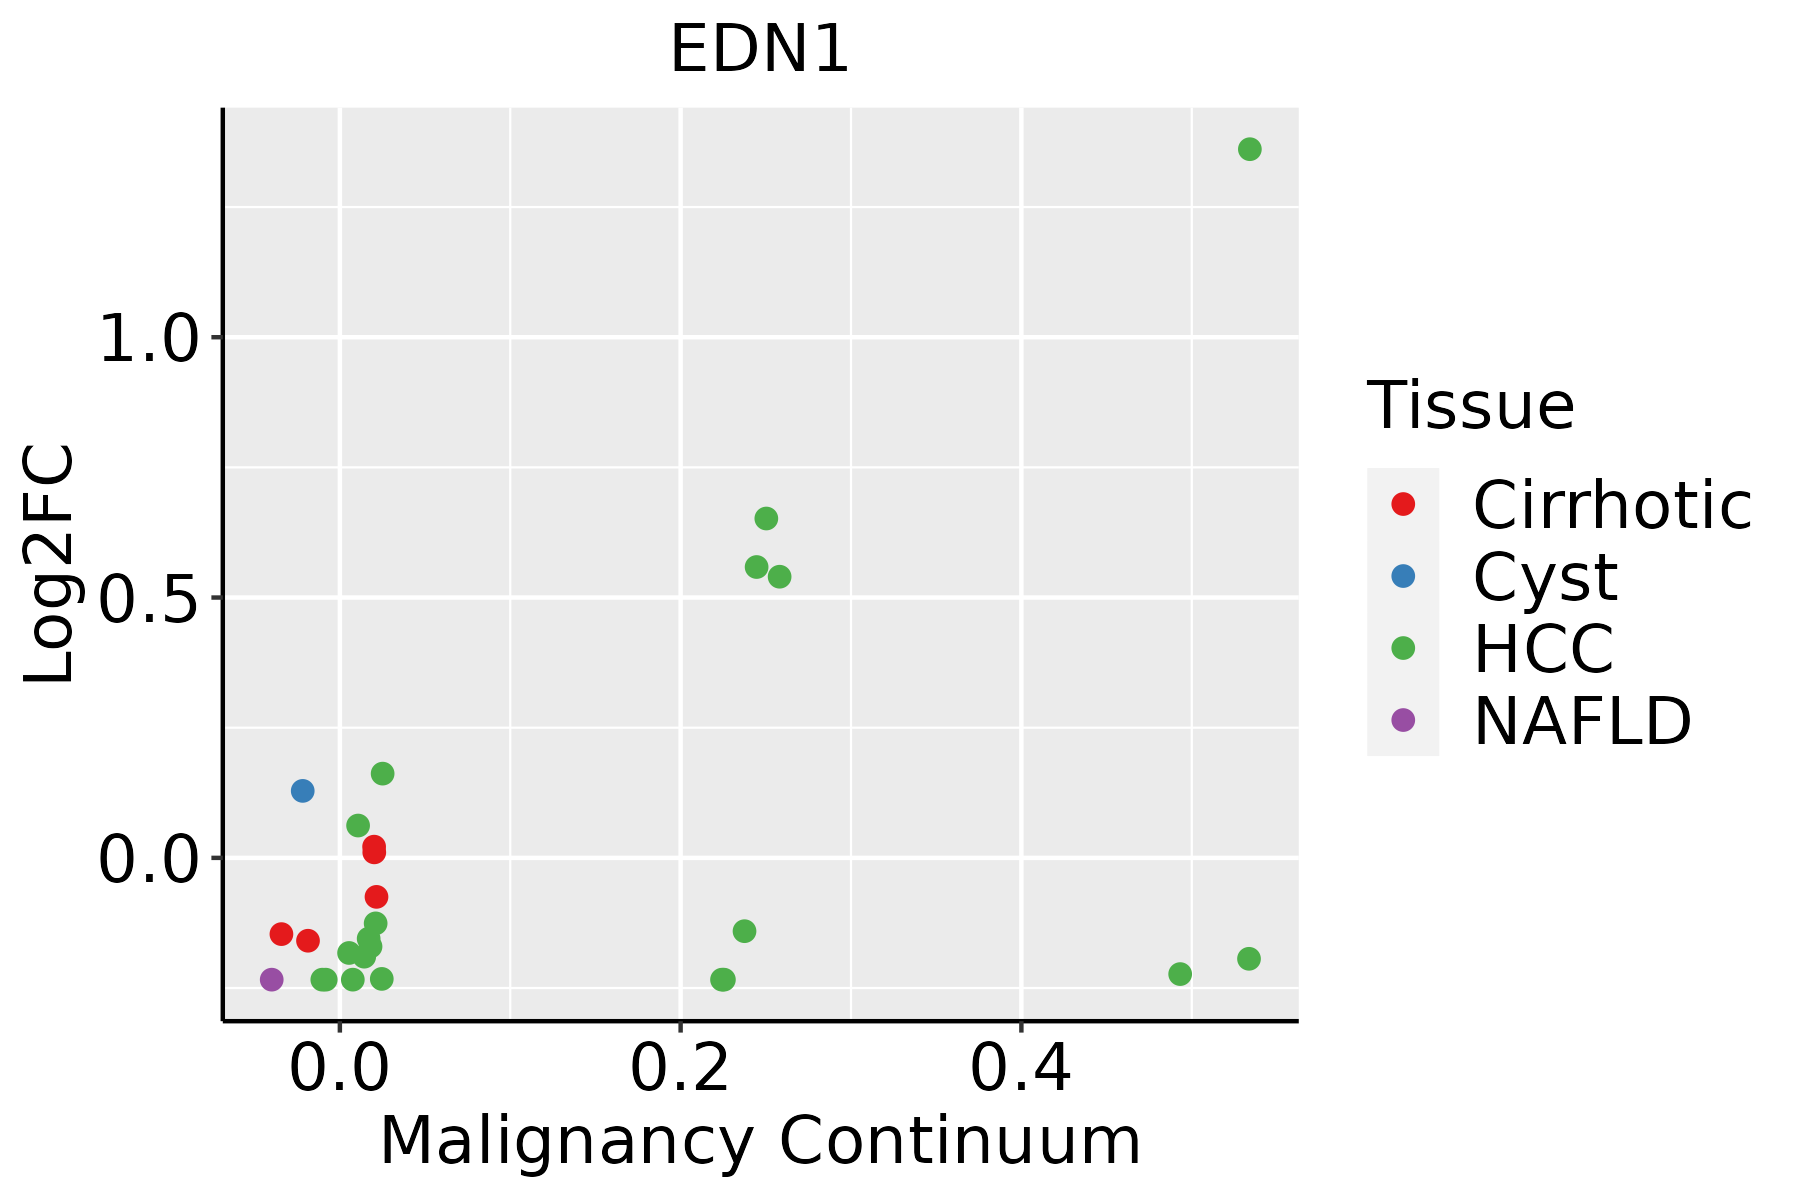 | HCC: Hepatocellular carcinoma |
| NAFLD: Non-alcoholic fatty liver disease | ||
| Lung | 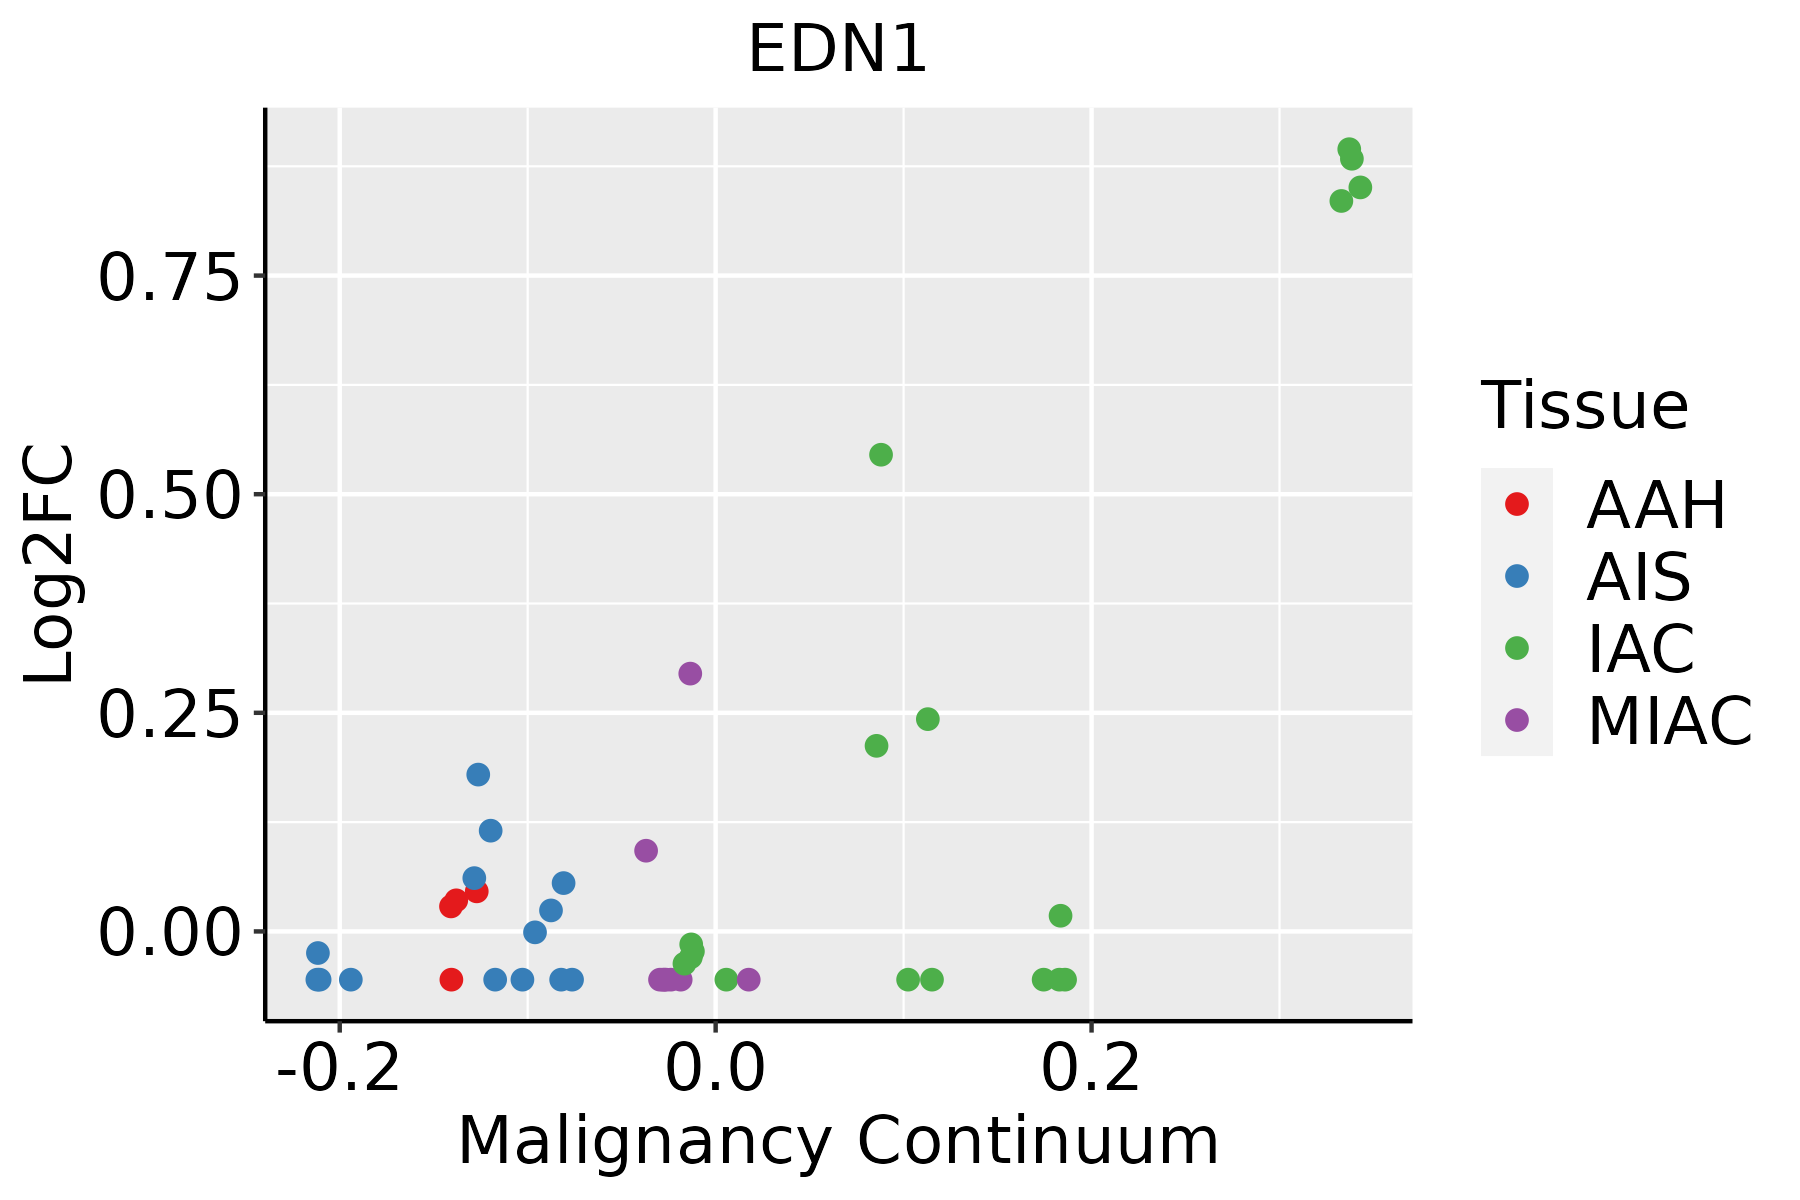 | AAH: Atypical adenomatous hyperplasia |
| AIS: Adenocarcinoma in situ | ||
| IAC: Invasive lung adenocarcinoma | ||
| MIA: Minimally invasive adenocarcinoma | ||
| Oral Cavity | 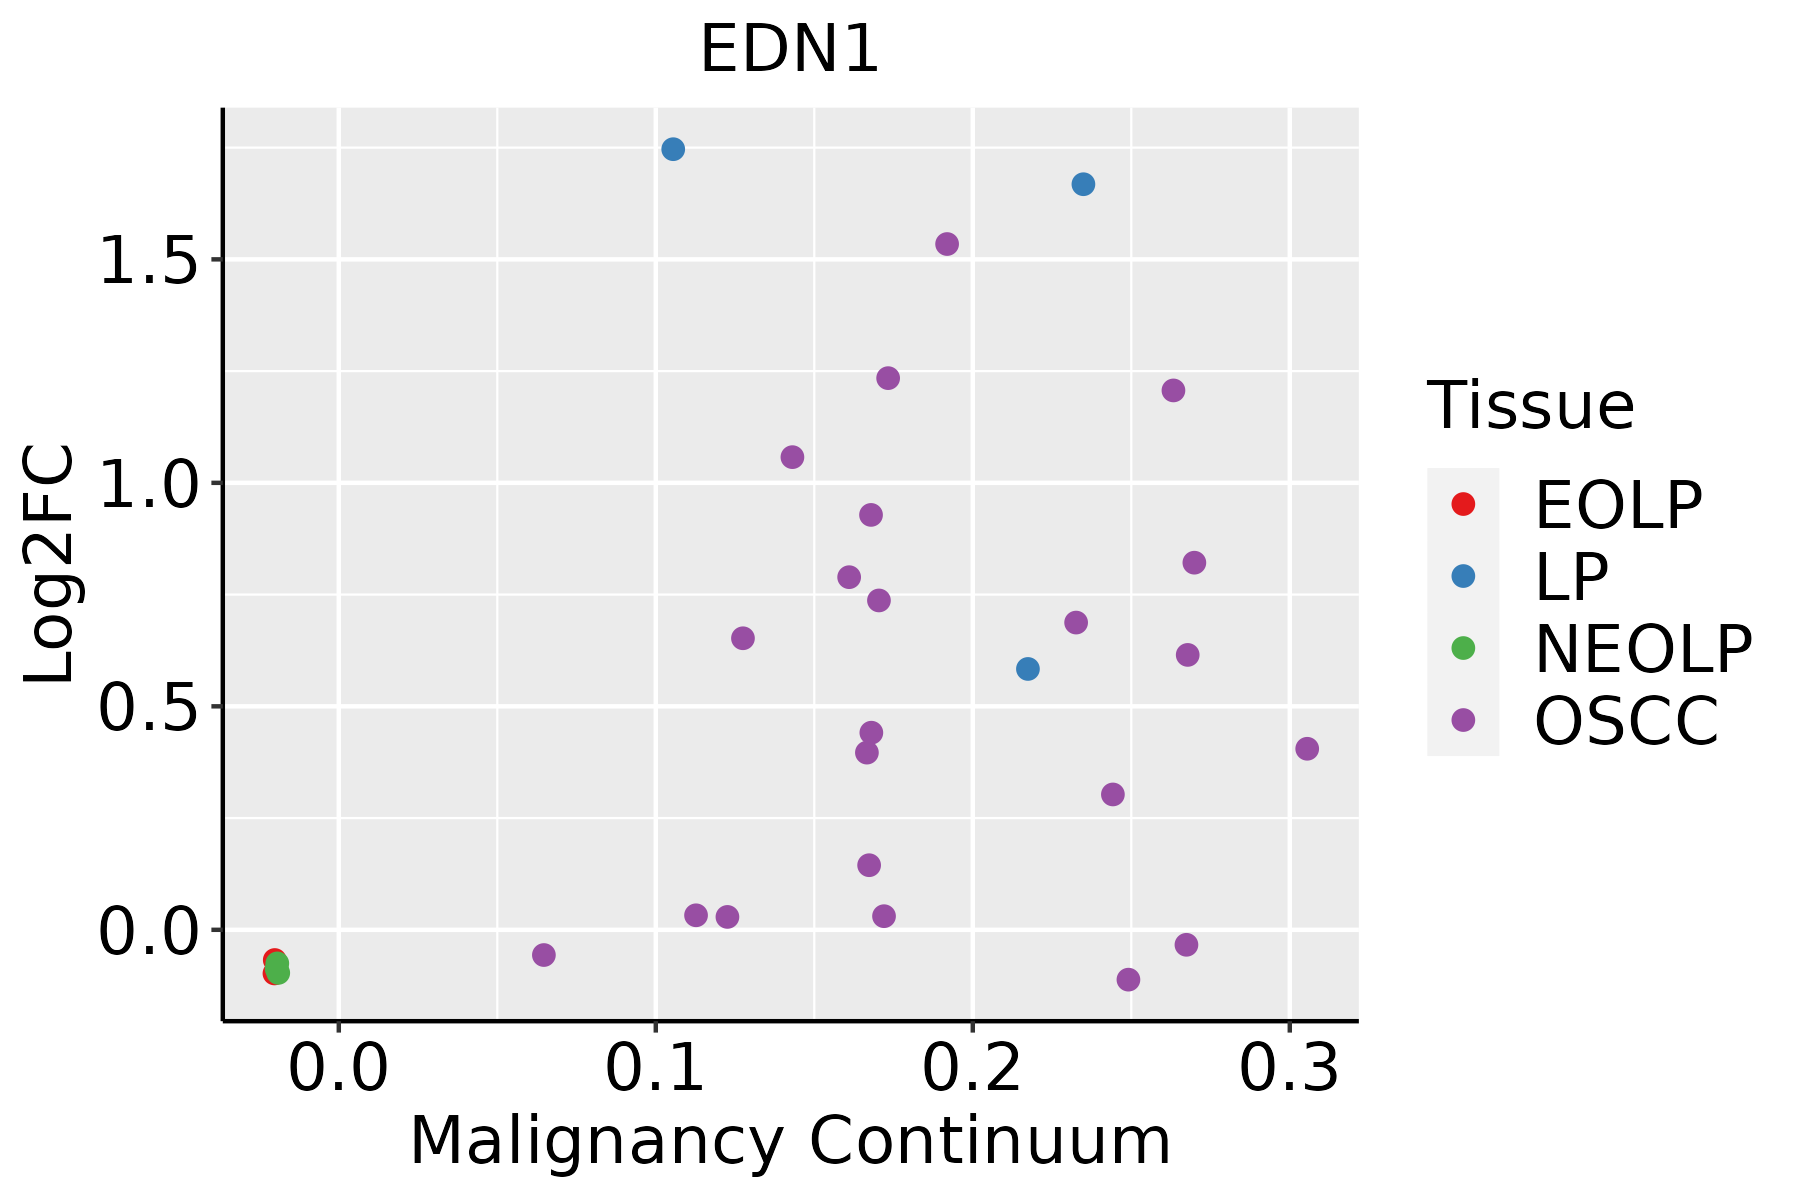 | EOLP: Erosive Oral lichen planus |
| LP: leukoplakia | ||
| NEOLP: Non-erosive oral lichen planus | ||
| OSCC: Oral squamous cell carcinoma | ||
| Prostate | 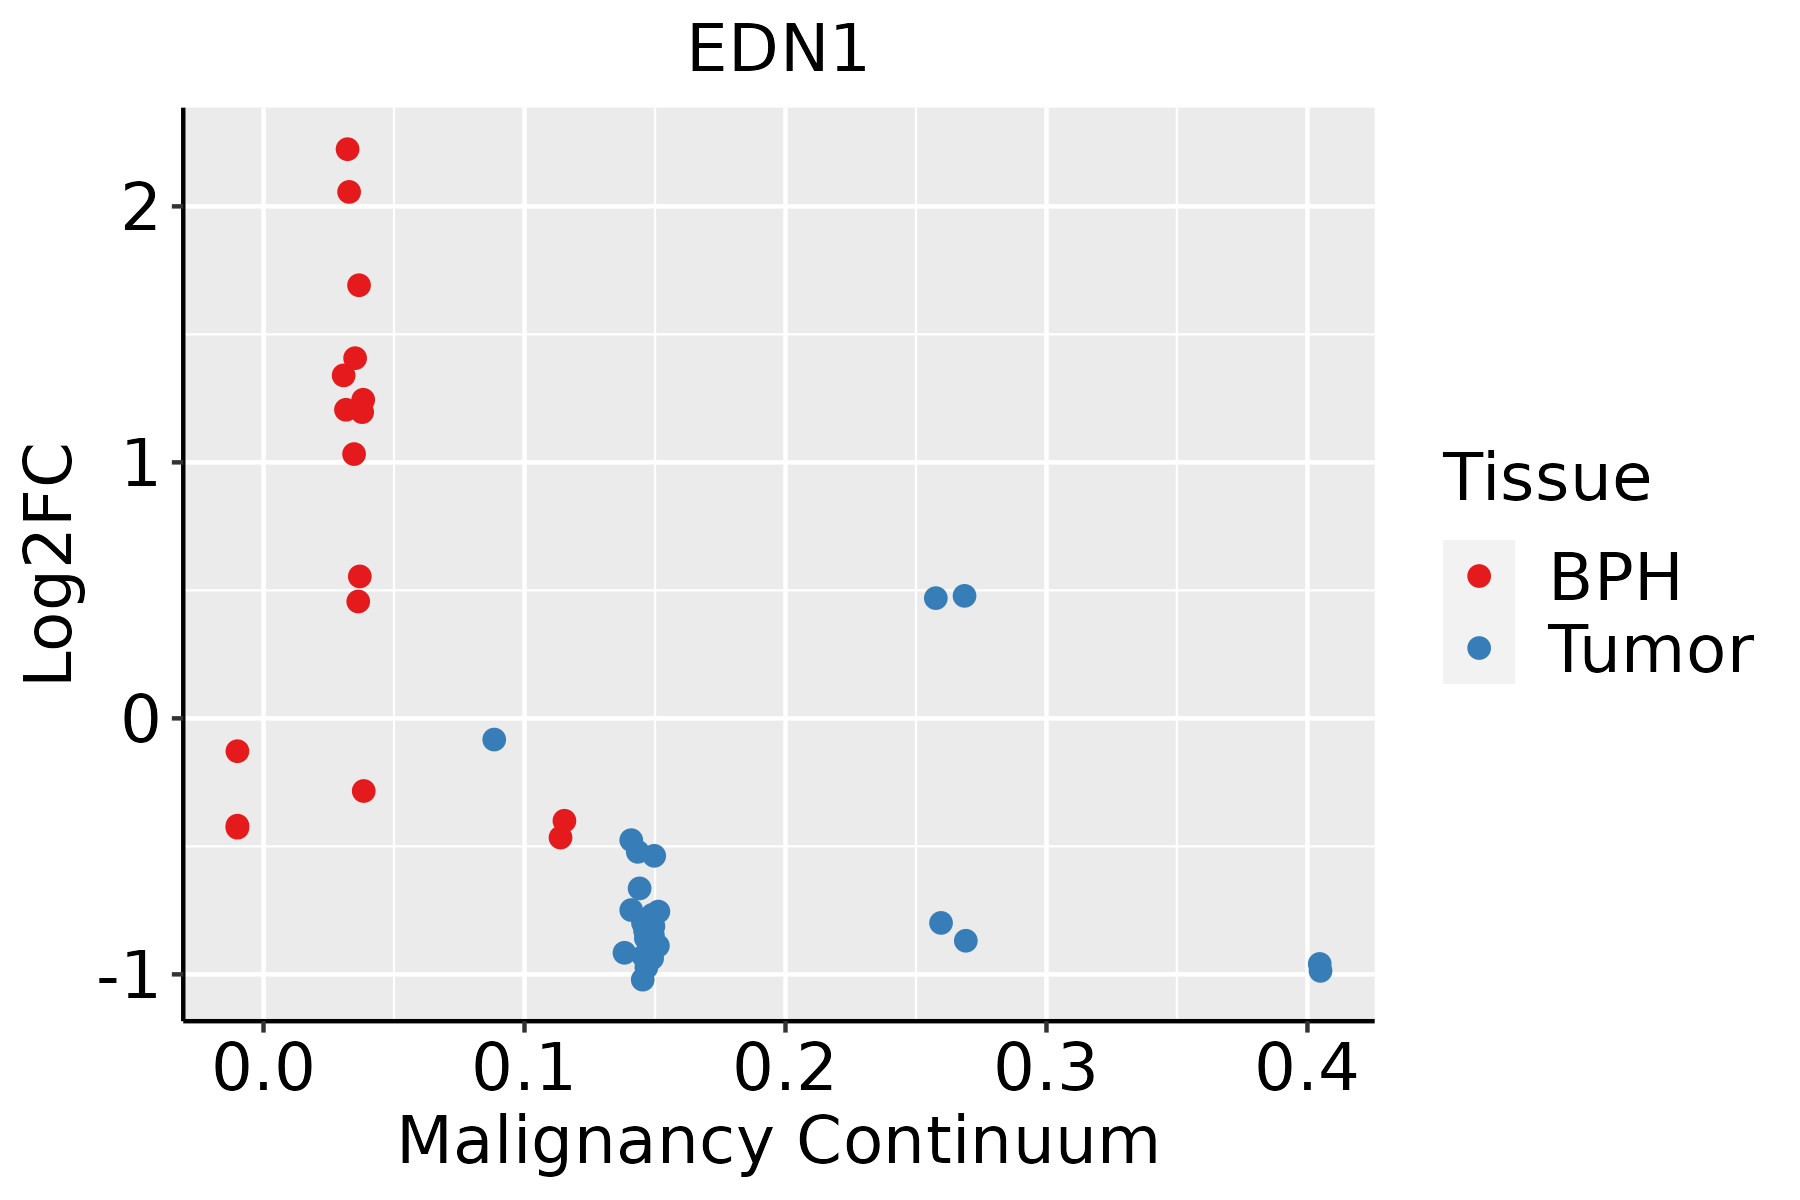 | BPH: Benign Prostatic Hyperplasia |
| ∗log2FC in expression of this searched gene in stem-like cells from each diseased tissue sample relative to stem-like cells in normal samples in each tissue plotted against the malignancy continuum. Samples are colored based on if they are from different disease stage. |
Top |
Malignant transformation related pathway analysis |
| Find out the enriched GO biological processes and KEGG pathways involved in transition from healthy to precancer to cancer |
| Tissue | Disease Stage | Enriched GO biological Processes |
| Colorectum | AD |  |
| Colorectum | SER |  |
| Colorectum | MSS |  |
| Colorectum | MSI-H |  |
| Colorectum | FAP |  |
| ∗Top 15 enriched GO BP terms are showed in the bar plot of each disease state in each tissue. Each row represents a significant GO biological process which is colored according to the -log10(p.adjust). |
| Page: 1 2 3 4 5 6 7 8 9 |
| GO ID | Tissue | Disease Stage | Description | Gene Ratio | Bg Ratio | pvalue | p.adjust | Count |
| GO:0032535 | Colorectum | AD | regulation of cellular component size | 142/3918 | 383/18723 | 1.74e-13 | 3.41e-11 | 142 |
| GO:1902903 | Colorectum | AD | regulation of supramolecular fiber organization | 139/3918 | 383/18723 | 2.01e-12 | 3.19e-10 | 139 |
| GO:0032970 | Colorectum | AD | regulation of actin filament-based process | 142/3918 | 397/18723 | 4.05e-12 | 5.90e-10 | 142 |
| GO:1902905 | Colorectum | AD | positive regulation of supramolecular fiber organization | 85/3918 | 209/18723 | 5.95e-11 | 6.33e-09 | 85 |
| GO:0032956 | Colorectum | AD | regulation of actin cytoskeleton organization | 127/3918 | 358/18723 | 1.03e-10 | 1.04e-08 | 127 |
| GO:0051495 | Colorectum | AD | positive regulation of cytoskeleton organization | 89/3918 | 226/18723 | 1.61e-10 | 1.56e-08 | 89 |
| GO:0006979 | Colorectum | AD | response to oxidative stress | 145/3918 | 446/18723 | 5.16e-09 | 3.23e-07 | 145 |
| GO:0000302 | Colorectum | AD | response to reactive oxygen species | 78/3918 | 222/18723 | 6.17e-07 | 2.21e-05 | 78 |
| GO:0071383 | Colorectum | AD | cellular response to steroid hormone stimulus | 73/3918 | 204/18723 | 6.31e-07 | 2.24e-05 | 73 |
| GO:1901653 | Colorectum | AD | cellular response to peptide | 114/3918 | 359/18723 | 8.32e-07 | 2.88e-05 | 114 |
| GO:0071375 | Colorectum | AD | cellular response to peptide hormone stimulus | 95/3918 | 290/18723 | 1.50e-06 | 4.66e-05 | 95 |
| GO:0043434 | Colorectum | AD | response to peptide hormone | 126/3918 | 414/18723 | 2.70e-06 | 7.86e-05 | 126 |
| GO:0042060 | Colorectum | AD | wound healing | 128/3918 | 422/18723 | 2.73e-06 | 7.89e-05 | 128 |
| GO:0016049 | Colorectum | AD | cell growth | 143/3918 | 482/18723 | 2.83e-06 | 8.09e-05 | 143 |
| GO:0001558 | Colorectum | AD | regulation of cell growth | 124/3918 | 414/18723 | 7.67e-06 | 1.86e-04 | 124 |
| GO:0048545 | Colorectum | AD | response to steroid hormone | 104/3918 | 339/18723 | 1.33e-05 | 2.90e-04 | 104 |
| GO:0001667 | Colorectum | AD | ameboidal-type cell migration | 137/3918 | 475/18723 | 2.17e-05 | 4.33e-04 | 137 |
| GO:0001701 | Colorectum | AD | in utero embryonic development | 110/3918 | 367/18723 | 2.36e-05 | 4.62e-04 | 110 |
| GO:0031032 | Colorectum | AD | actomyosin structure organization | 65/3918 | 196/18723 | 4.17e-05 | 7.37e-04 | 65 |
| GO:0006631 | Colorectum | AD | fatty acid metabolic process | 114/3918 | 390/18723 | 5.58e-05 | 9.44e-04 | 114 |
| Page: 1 2 3 4 5 6 7 8 9 10 11 12 13 14 15 16 17 18 19 20 21 22 23 24 25 26 27 28 29 30 31 32 33 34 35 36 37 38 39 40 41 42 43 44 45 46 47 48 49 50 51 52 53 54 55 56 57 |
| Pathway ID | Tissue | Disease Stage | Description | Gene Ratio | Bg Ratio | pvalue | p.adjust | qvalue | Count |
| hsa04066 | Colorectum | AD | HIF-1 signaling pathway | 48/2092 | 109/8465 | 7.25e-06 | 7.84e-05 | 5.00e-05 | 48 |
| hsa05418 | Colorectum | AD | Fluid shear stress and atherosclerosis | 54/2092 | 139/8465 | 1.41e-04 | 1.16e-03 | 7.37e-04 | 54 |
| hsa040661 | Colorectum | AD | HIF-1 signaling pathway | 48/2092 | 109/8465 | 7.25e-06 | 7.84e-05 | 5.00e-05 | 48 |
| hsa054181 | Colorectum | AD | Fluid shear stress and atherosclerosis | 54/2092 | 139/8465 | 1.41e-04 | 1.16e-03 | 7.37e-04 | 54 |
| hsa054184 | Colorectum | MSS | Fluid shear stress and atherosclerosis | 51/1875 | 139/8465 | 6.06e-05 | 5.80e-04 | 3.55e-04 | 51 |
| hsa040664 | Colorectum | MSS | HIF-1 signaling pathway | 39/1875 | 109/8465 | 7.61e-04 | 5.00e-03 | 3.06e-03 | 39 |
| hsa04926 | Colorectum | MSS | Relaxin signaling pathway | 40/1875 | 129/8465 | 1.18e-02 | 3.99e-02 | 2.44e-02 | 40 |
| hsa054185 | Colorectum | MSS | Fluid shear stress and atherosclerosis | 51/1875 | 139/8465 | 6.06e-05 | 5.80e-04 | 3.55e-04 | 51 |
| hsa040665 | Colorectum | MSS | HIF-1 signaling pathway | 39/1875 | 109/8465 | 7.61e-04 | 5.00e-03 | 3.06e-03 | 39 |
| hsa049261 | Colorectum | MSS | Relaxin signaling pathway | 40/1875 | 129/8465 | 1.18e-02 | 3.99e-02 | 2.44e-02 | 40 |
| hsa040666 | Colorectum | FAP | HIF-1 signaling pathway | 38/1404 | 109/8465 | 2.43e-06 | 4.28e-05 | 2.60e-05 | 38 |
| hsa054188 | Colorectum | FAP | Fluid shear stress and atherosclerosis | 45/1404 | 139/8465 | 3.05e-06 | 4.63e-05 | 2.81e-05 | 45 |
| hsa04933 | Colorectum | FAP | AGE-RAGE signaling pathway in diabetic complications | 27/1404 | 100/8465 | 5.55e-03 | 2.15e-02 | 1.31e-02 | 27 |
| hsa04024 | Colorectum | FAP | cAMP signaling pathway | 51/1404 | 225/8465 | 1.02e-02 | 3.68e-02 | 2.24e-02 | 51 |
| hsa04270 | Colorectum | FAP | Vascular smooth muscle contraction | 33/1404 | 134/8465 | 1.05e-02 | 3.74e-02 | 2.28e-02 | 33 |
| hsa040667 | Colorectum | FAP | HIF-1 signaling pathway | 38/1404 | 109/8465 | 2.43e-06 | 4.28e-05 | 2.60e-05 | 38 |
| hsa054189 | Colorectum | FAP | Fluid shear stress and atherosclerosis | 45/1404 | 139/8465 | 3.05e-06 | 4.63e-05 | 2.81e-05 | 45 |
| hsa049331 | Colorectum | FAP | AGE-RAGE signaling pathway in diabetic complications | 27/1404 | 100/8465 | 5.55e-03 | 2.15e-02 | 1.31e-02 | 27 |
| hsa040241 | Colorectum | FAP | cAMP signaling pathway | 51/1404 | 225/8465 | 1.02e-02 | 3.68e-02 | 2.24e-02 | 51 |
| hsa042701 | Colorectum | FAP | Vascular smooth muscle contraction | 33/1404 | 134/8465 | 1.05e-02 | 3.74e-02 | 2.28e-02 | 33 |
| Page: 1 2 3 4 5 |
Top |
Cell-cell communication analysis |
| Identification of potential cell-cell interactions between two cell types and their ligand-receptor pairs for different disease states |
| Ligand | Receptor | LRpair | Pathway | Tissue | Disease Stage |
| EDN1 | EDNRA | EDN1_EDNRA | EDN | Breast | ADJ |
| EDN1 | EDNRB | EDN1_EDNRB | EDN | Breast | ADJ |
| EDN1 | EDNRA | EDN1_EDNRA | EDN | Breast | DCIS |
| EDN1 | EDNRB | EDN1_EDNRB | EDN | Breast | DCIS |
| EDN1 | EDNRA | EDN1_EDNRA | EDN | Breast | Healthy |
| EDN1 | EDNRB | EDN1_EDNRB | EDN | Breast | Healthy |
| EDN1 | EDNRA | EDN1_EDNRA | EDN | Breast | Precancer |
| EDN1 | EDNRB | EDN1_EDNRB | EDN | Breast | Precancer |
| EDN1 | EDNRA | EDN1_EDNRA | EDN | Cervix | ADJ |
| EDN1 | EDNRA | EDN1_EDNRA | EDN | Cervix | CC |
| EDN1 | EDNRA | EDN1_EDNRA | EDN | CRC | MSI-H |
| EDN1 | EDNRA | EDN1_EDNRA | EDN | Endometrium | ADJ |
| EDN1 | EDNRB | EDN1_EDNRB | EDN | Endometrium | ADJ |
| EDN1 | EDNRA | EDN1_EDNRA | EDN | Endometrium | AEH |
| EDN1 | EDNRB | EDN1_EDNRB | EDN | Endometrium | AEH |
| EDN1 | EDNRA | EDN1_EDNRA | EDN | Endometrium | EEC |
| EDN1 | EDNRB | EDN1_EDNRB | EDN | Endometrium | EEC |
| EDN1 | EDNRA | EDN1_EDNRA | EDN | Endometrium | Healthy |
| EDN1 | EDNRB | EDN1_EDNRB | EDN | Endometrium | Healthy |
| EDN1 | EDNRA | EDN1_EDNRA | EDN | Esophagus | ESCC |
| Page: 1 2 3 |
Top |
Single-cell gene regulatory network inference analysis |
| Find out the significant the regulons (TFs) and the target genes of each regulon across cell types for different disease states |
| TF | Cell Type | Tissue | Disease Stage | Target Gene | RSS | Regulon Activity |
| EDN1 | BAS | Lung | Healthy | KRT17,CXCL1,IER3, etc. | 1.53e-01 |  |
| ∗The dot plots of a searched regulon are shown for all cell subpopulations in each disease state of each tissue based on the regulon specific score inferred using pySCENIC and by calculating the average expression. |
| Page: 1 |
Top |
Somatic mutation of malignant transformation related genes |
| Annotation of somatic variants for genes involved in malignant transformation |
| Hugo Symbol | Variant Class | Variant Classification | dbSNP RS | HGVSc | HGVSp | HGVSp Short | SWISSPROT | BIOTYPE | SIFT | PolyPhen | Tumor Sample Barcode | Tissue | Histology | Sex | Age | Stage | Therapy Types | Drugs | Outcome |
| EDN1 | SNV | Missense_Mutation | c.346N>T | p.Asp116Tyr | p.D116Y | P05305 | protein_coding | deleterious(0) | probably_damaging(0.999) | TCGA-A8-A06X-01 | Breast | breast invasive carcinoma | Female | >=65 | I/II | Unknown | Unknown | SD | |
| EDN1 | SNV | Missense_Mutation | rs777308039 | c.446C>A | p.Ser149Tyr | p.S149Y | P05305 | protein_coding | tolerated(0.07) | benign(0.121) | TCGA-AN-A046-01 | Breast | breast invasive carcinoma | Female | >=65 | I/II | Unknown | Unknown | SD |
| EDN1 | SNV | Missense_Mutation | c.557T>A | p.Val186Asp | p.V186D | P05305 | protein_coding | deleterious(0) | possibly_damaging(0.559) | TCGA-AO-A0JF-01 | Breast | breast invasive carcinoma | Female | >=65 | I/II | Chemotherapy | doxorubicin | SD | |
| EDN1 | insertion | Frame_Shift_Ins | novel | c.155_156insTAACTTATCGTTTTATTATTATTATTCCATTATGTGTTTC | p.Cys53AsnfsTer22 | p.C53Nfs*22 | P05305 | protein_coding | TCGA-A8-A0A4-01 | Breast | breast invasive carcinoma | Female | >=65 | I/II | Hormone Therapy | tamoxiphen | CR | ||
| EDN1 | deletion | Frame_Shift_Del | c.457delN | p.Lys154SerfsTer7 | p.K154Sfs*7 | P05305 | protein_coding | TCGA-AN-A0AK-01 | Breast | breast invasive carcinoma | Female | >=65 | I/II | Unknown | Unknown | SD | |||
| EDN1 | SNV | Missense_Mutation | c.285N>T | p.Glu95Asp | p.E95D | P05305 | protein_coding | tolerated(0.09) | benign(0.104) | TCGA-AA-3510-01 | Colorectum | colon adenocarcinoma | Male | >=65 | I/II | Unknown | Unknown | SD | |
| EDN1 | SNV | Missense_Mutation | novel | c.221N>G | p.Val74Gly | p.V74G | P05305 | protein_coding | deleterious(0) | probably_damaging(0.952) | TCGA-AA-3984-01 | Colorectum | colon adenocarcinoma | Female | <65 | I/II | Unknown | Unknown | SD |
| EDN1 | deletion | Frame_Shift_Del | c.457delN | p.Lys154SerfsTer7 | p.K154Sfs*7 | P05305 | protein_coding | TCGA-A6-2672-01 | Colorectum | colon adenocarcinoma | Female | >=65 | III/IV | Unknown | Unknown | SD | |||
| EDN1 | SNV | Missense_Mutation | rs368802545 | c.143N>A | p.Arg48His | p.R48H | P05305 | protein_coding | tolerated(0.07) | benign(0.031) | TCGA-AP-A0LM-01 | Endometrium | uterine corpus endometrioid carcinoma | Female | <65 | III/IV | Chemotherapy | cisplatin | SD |
| EDN1 | SNV | Missense_Mutation | c.285N>T | p.Glu95Asp | p.E95D | P05305 | protein_coding | tolerated(0.09) | benign(0.104) | TCGA-B5-A0JY-01 | Endometrium | uterine corpus endometrioid carcinoma | Female | <65 | III/IV | Chemotherapy | doxorubicin | SD |
| Page: 1 2 3 |
Top |
Related drugs of malignant transformation related genes |
| Identification of chemicals and drugs interact with genes involved in malignant transfromation |
| (DGIdb 4.0) |
| Entrez ID | Symbol | Category | Interaction Types | Drug Claim Name | Drug Name | PMIDs |
| 1906 | EDN1 | HORMONE ACTIVITY, DRUGGABLE GENOME | muraglitazar | MURAGLITAZAR | 18794727 | |
| 1906 | EDN1 | HORMONE ACTIVITY, DRUGGABLE GENOME | ANTICONVULSANT | 7509966 | ||
| 1906 | EDN1 | HORMONE ACTIVITY, DRUGGABLE GENOME | OXYGEN THERAPY | 9736447 | ||
| 1906 | EDN1 | HORMONE ACTIVITY, DRUGGABLE GENOME | ANTIPLATELET AGENT | 15253106 | ||
| 1906 | EDN1 | HORMONE ACTIVITY, DRUGGABLE GENOME | TAMOXIFEN | TAMOXIFEN | 8425178 | |
| 1906 | EDN1 | HORMONE ACTIVITY, DRUGGABLE GENOME | NORETHISTERONE ACETATE | 11915588 | ||
| 1906 | EDN1 | HORMONE ACTIVITY, DRUGGABLE GENOME | CANDESARTAN CILEXETIL | 10029562 | ||
| 1906 | EDN1 | HORMONE ACTIVITY, DRUGGABLE GENOME | INSULIN | INSULIN | 11600523 | |
| 1906 | EDN1 | HORMONE ACTIVITY, DRUGGABLE GENOME | THIOURACIL | THIOURACIL | 10967532 | |
| 1906 | EDN1 | HORMONE ACTIVITY, DRUGGABLE GENOME | CELECOXIB | CELECOXIB | 15539607 |
| Page: 1 2 |

Copyright 2023-Present -The University of Texas Health Science Center at Houston |