
|
|||||
|
 | |
| |
| |
| |
| |
| |
|
Gene: EDIL3 |
Gene summary for EDIL3 |
| Gene information | Species | Human | Gene symbol | EDIL3 | Gene ID | 10085 |
| Gene name | EGF like repeats and discoidin domains 3 | |
| Gene Alias | DEL1 | |
| Cytomap | 5q14.3 | |
| Gene Type | protein-coding | GO ID | GO:0007155 | UniProtAcc | O43854 |
Top |
Malignant transformation analysis |
| Identification of the aberrant gene expression in precancerous and cancerous lesions by comparing the gene expression of stem-like cells in diseased tissues with normal stem cells |
| Entrez ID | Symbol | Replicates | Species | Organ | Tissue | Adj P-value | Log2FC | Malignancy |
| 10085 | EDIL3 | HTA11_3410_2000001011 | Human | Colorectum | AD | 2.24e-45 | -1.13e+00 | 0.0155 |
| 10085 | EDIL3 | HTA11_2487_2000001011 | Human | Colorectum | SER | 3.18e-22 | -9.77e-01 | -0.1808 |
| 10085 | EDIL3 | HTA11_2951_2000001011 | Human | Colorectum | AD | 1.87e-11 | -1.22e+00 | 0.0216 |
| 10085 | EDIL3 | HTA11_1938_2000001011 | Human | Colorectum | AD | 6.60e-18 | -9.75e-01 | -0.0811 |
| 10085 | EDIL3 | HTA11_78_2000001011 | Human | Colorectum | AD | 2.35e-25 | -9.84e-01 | -0.1088 |
| 10085 | EDIL3 | HTA11_2112_2000001011 | Human | Colorectum | SER | 9.44e-05 | -1.01e+00 | -0.2196 |
| 10085 | EDIL3 | HTA11_3361_2000001011 | Human | Colorectum | AD | 1.88e-21 | -1.04e+00 | -0.1207 |
| 10085 | EDIL3 | HTA11_83_2000001011 | Human | Colorectum | SER | 1.15e-17 | -1.06e+00 | -0.1526 |
| 10085 | EDIL3 | HTA11_696_2000001011 | Human | Colorectum | AD | 5.34e-36 | -8.71e-01 | -0.1464 |
| 10085 | EDIL3 | HTA11_866_2000001011 | Human | Colorectum | AD | 1.37e-28 | -8.77e-01 | -0.1001 |
| 10085 | EDIL3 | HTA11_1391_2000001011 | Human | Colorectum | AD | 5.03e-38 | -1.11e+00 | -0.059 |
| 10085 | EDIL3 | HTA11_2992_2000001011 | Human | Colorectum | SER | 4.57e-05 | -8.18e-01 | -0.1706 |
| 10085 | EDIL3 | HTA11_5212_2000001011 | Human | Colorectum | AD | 1.22e-05 | -8.16e-01 | -0.2061 |
| 10085 | EDIL3 | HTA11_5216_2000001011 | Human | Colorectum | SER | 4.47e-05 | -8.03e-01 | -0.1462 |
| 10085 | EDIL3 | HTA11_546_2000001011 | Human | Colorectum | AD | 1.10e-08 | -8.44e-01 | -0.0842 |
| 10085 | EDIL3 | HTA11_866_3004761011 | Human | Colorectum | AD | 4.51e-50 | -1.21e+00 | 0.096 |
| 10085 | EDIL3 | HTA11_4255_2000001011 | Human | Colorectum | SER | 2.80e-03 | -8.03e-01 | 0.0446 |
| 10085 | EDIL3 | HTA11_9408_2000001011 | Human | Colorectum | AD | 3.99e-06 | -1.14e+00 | 0.0451 |
| 10085 | EDIL3 | HTA11_8622_2000001021 | Human | Colorectum | SER | 4.19e-10 | -1.01e+00 | 0.0528 |
| 10085 | EDIL3 | HTA11_10623_2000001011 | Human | Colorectum | AD | 7.99e-03 | -5.27e-01 | -0.0177 |
| Page: 1 2 3 4 5 |
| Tissue | Expression Dynamics | Abbreviation |
| Colorectum (GSE201348) |  | FAP: Familial adenomatous polyposis |
| CRC: Colorectal cancer | ||
| Colorectum (HTA11) | 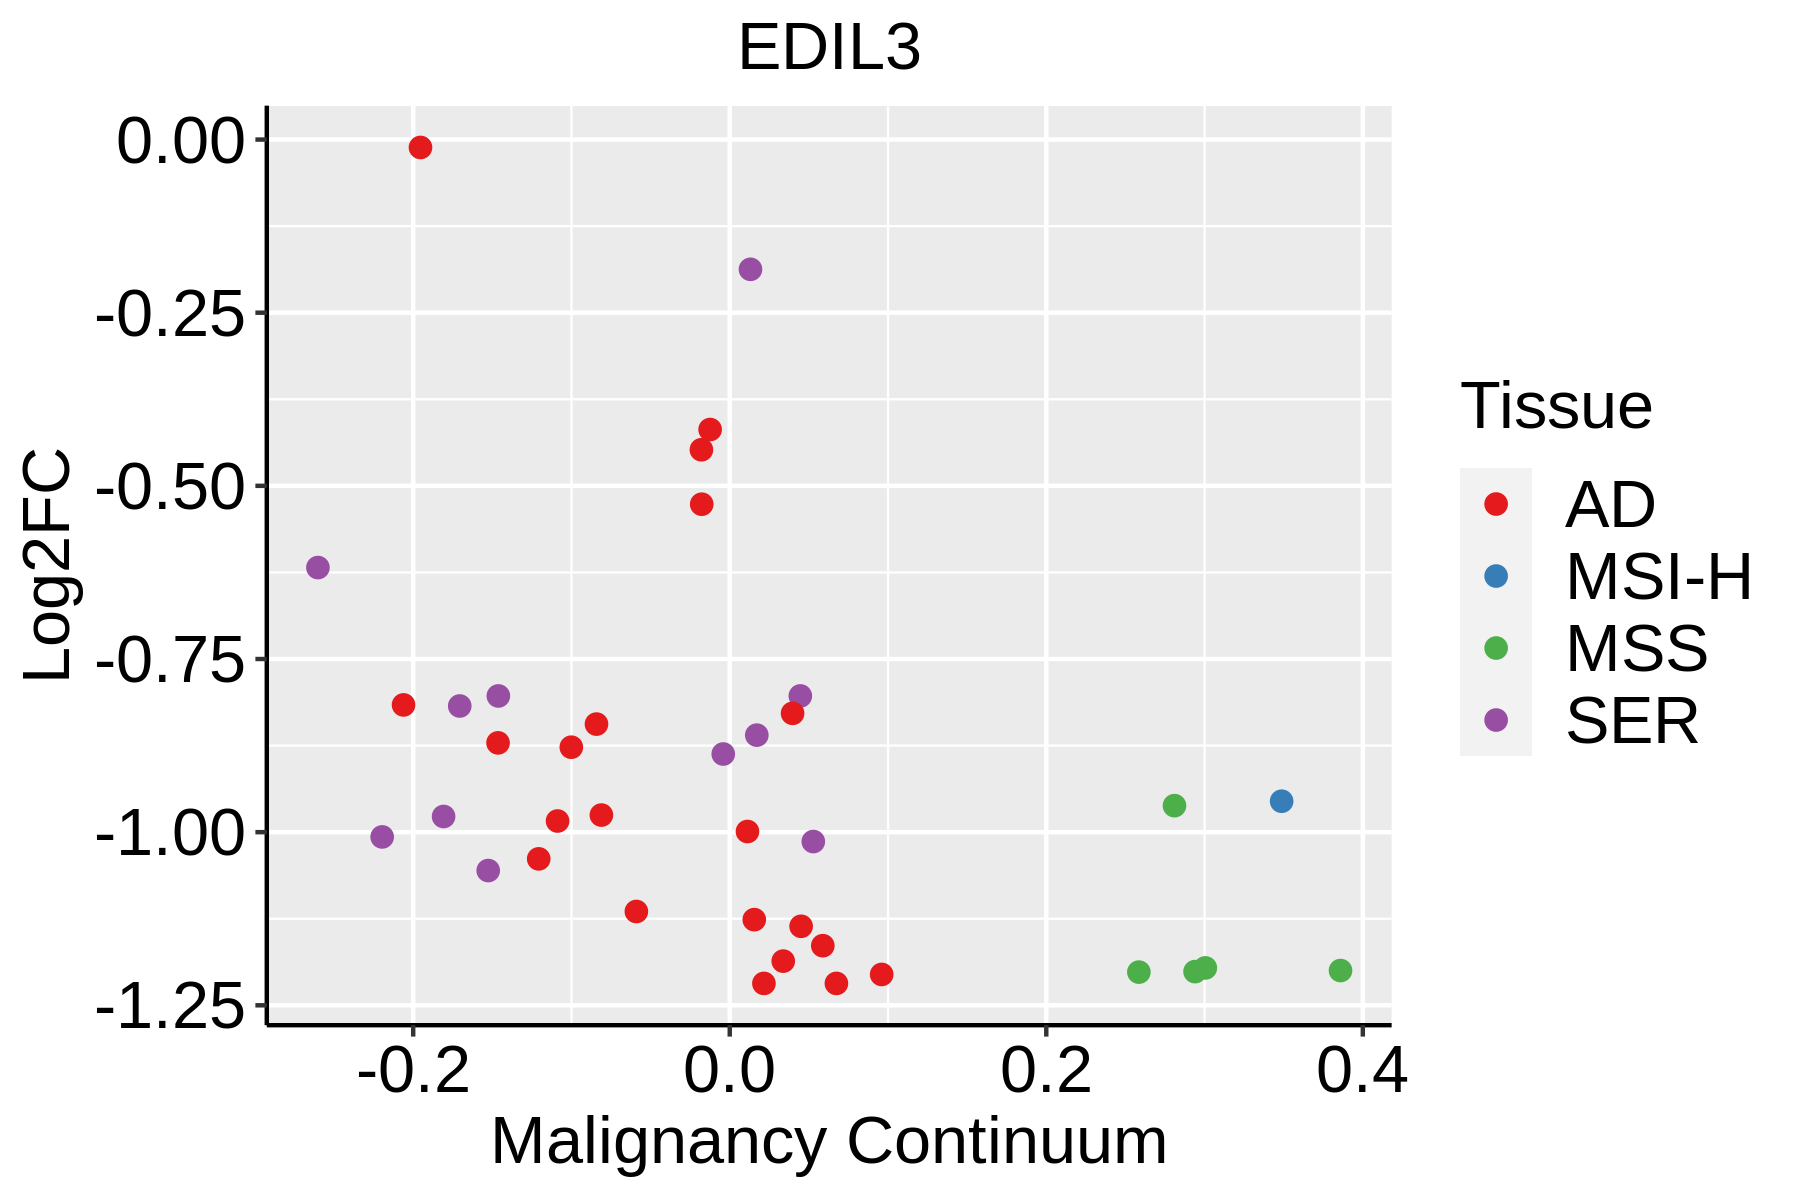 | AD: Adenomas |
| SER: Sessile serrated lesions | ||
| MSI-H: Microsatellite-high colorectal cancer | ||
| MSS: Microsatellite stable colorectal cancer | ||
| Esophagus | 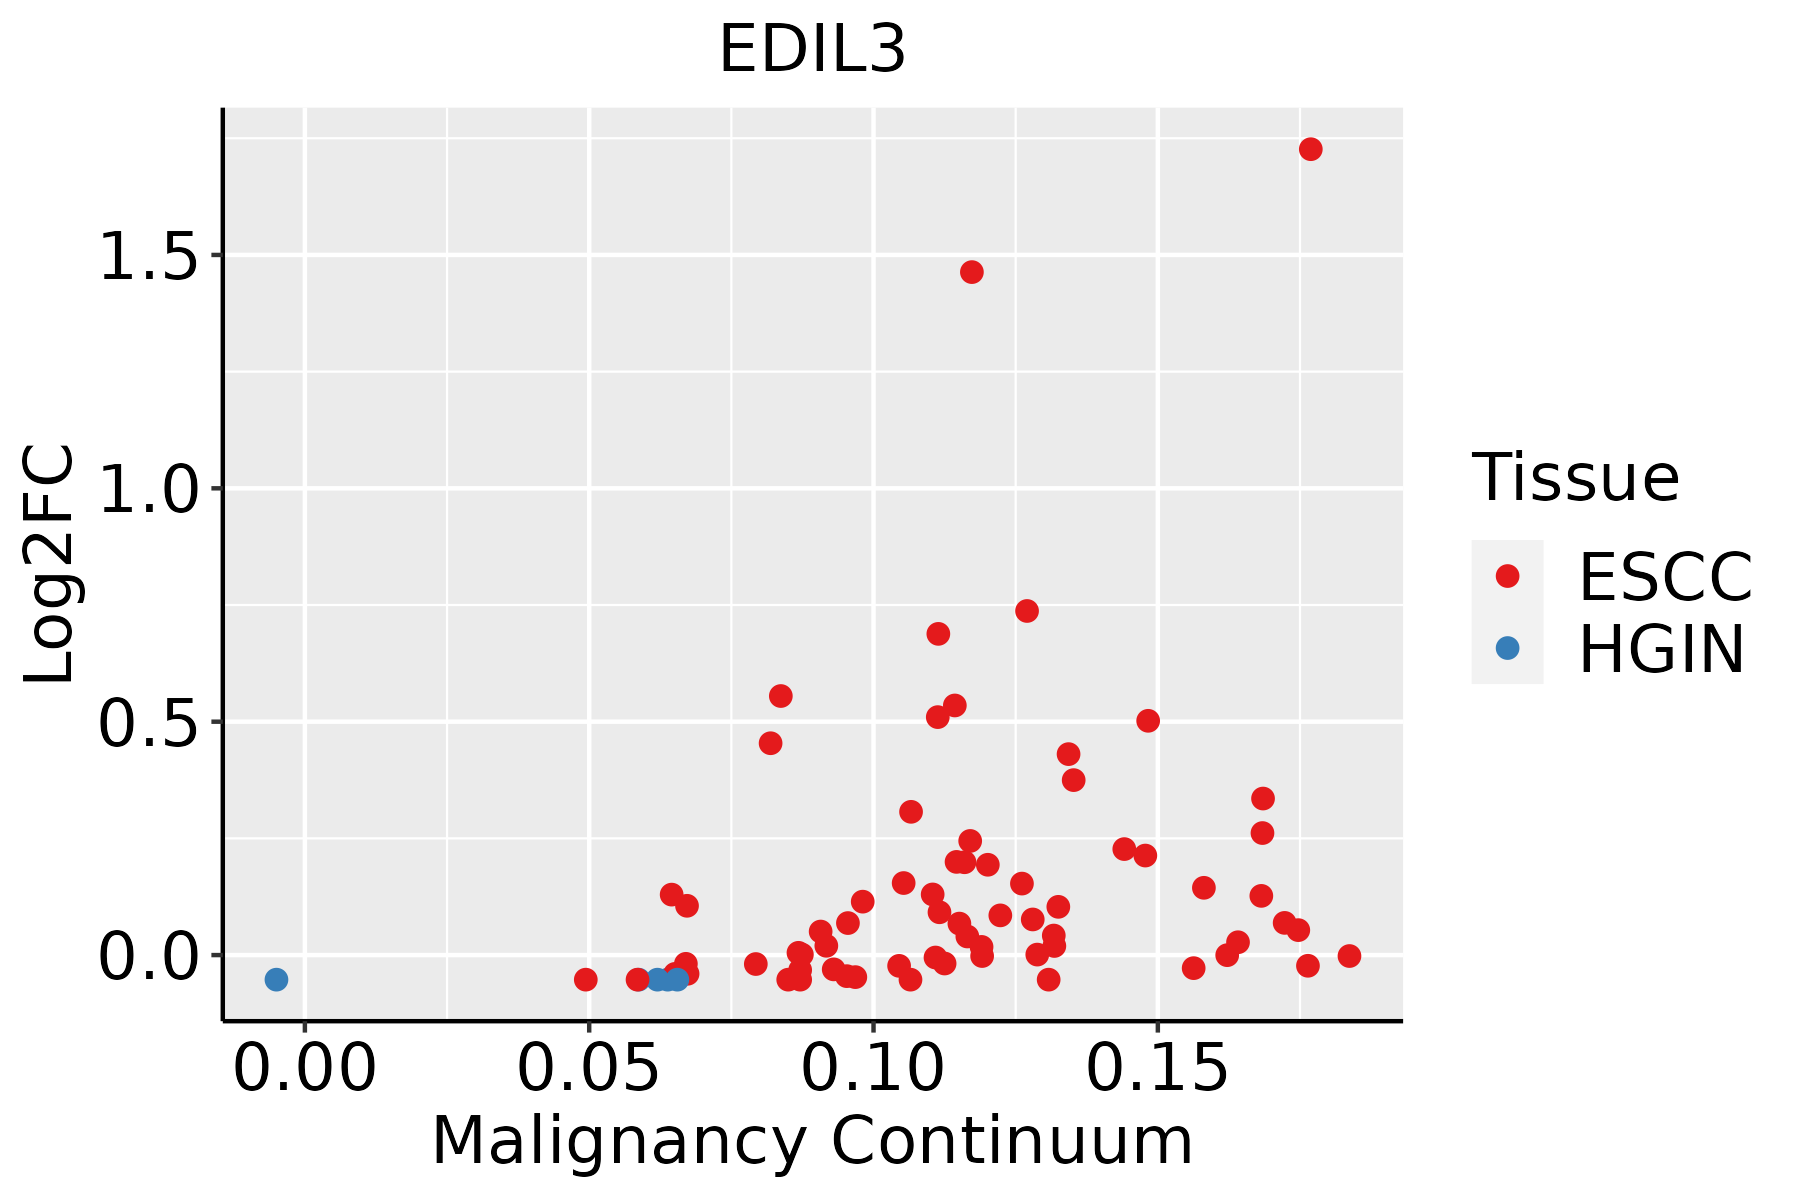 | ESCC: Esophageal squamous cell carcinoma |
| HGIN: High-grade intraepithelial neoplasias | ||
| LGIN: Low-grade intraepithelial neoplasias | ||
| Thyroid | 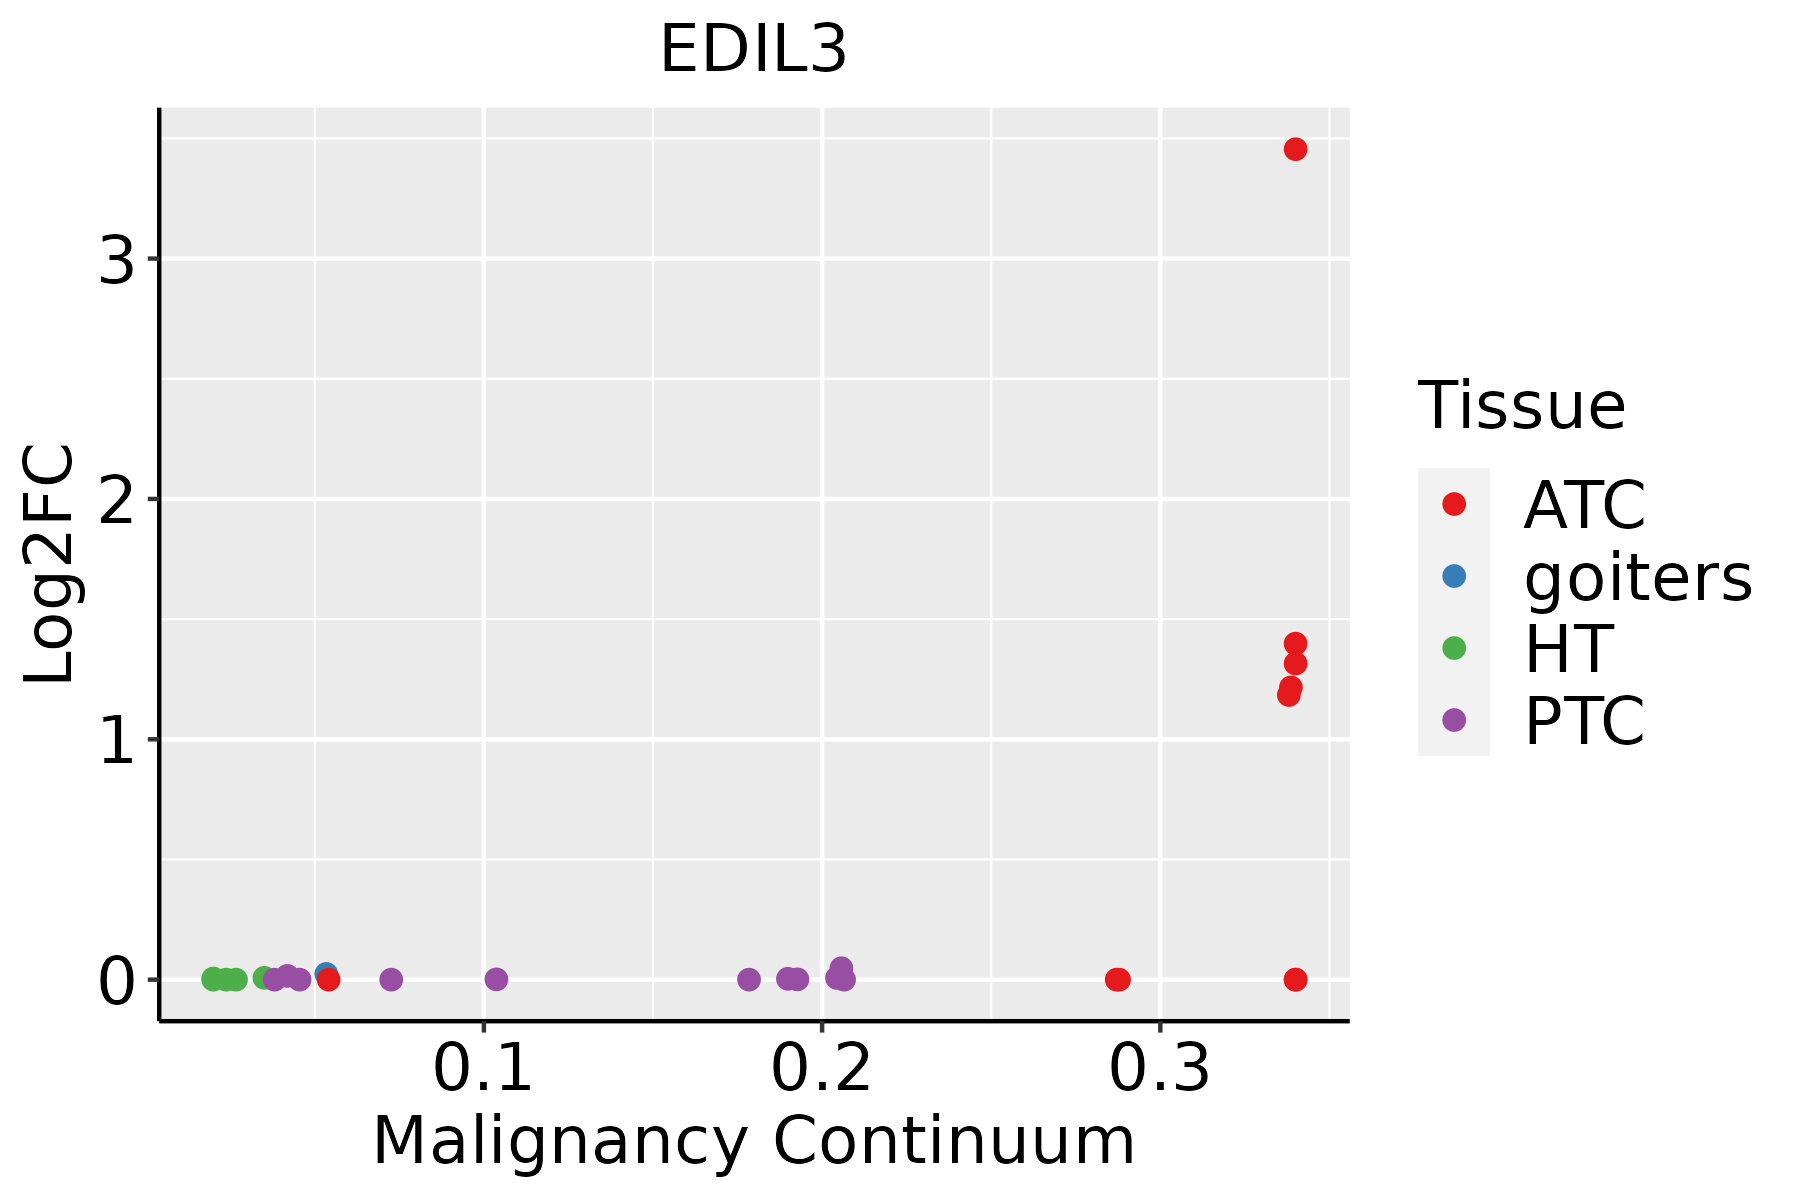 | ATC: Anaplastic thyroid cancer |
| HT: Hashimoto's thyroiditis | ||
| PTC: Papillary thyroid cancer |
| ∗log2FC in expression of this searched gene in stem-like cells from each diseased tissue sample relative to stem-like cells in normal samples in each tissue plotted against the malignancy continuum. Samples are colored based on if they are from different disease stage. |
Top |
Malignant transformation related pathway analysis |
| Find out the enriched GO biological processes and KEGG pathways involved in transition from healthy to precancer to cancer |
| Tissue | Disease Stage | Enriched GO biological Processes |
| Colorectum | AD |  |
| Colorectum | SER |  |
| Colorectum | MSS |  |
| Colorectum | MSI-H |  |
| Colorectum | FAP |  |
| ∗Top 15 enriched GO BP terms are showed in the bar plot of each disease state in each tissue. Each row represents a significant GO biological process which is colored according to the -log10(p.adjust). |
| Page: 1 2 3 4 5 6 7 8 9 |
| GO ID | Tissue | Disease Stage | Description | Gene Ratio | Bg Ratio | pvalue | p.adjust | Count |
| GO:0010811 | Colorectum | AD | positive regulation of cell-substrate adhesion | 53/3918 | 123/18723 | 2.30e-08 | 1.27e-06 | 53 |
| GO:0010810 | Colorectum | AD | regulation of cell-substrate adhesion | 81/3918 | 221/18723 | 4.80e-08 | 2.55e-06 | 81 |
| GO:0031589 | Colorectum | AD | cell-substrate adhesion | 116/3918 | 363/18723 | 4.68e-07 | 1.76e-05 | 116 |
| GO:0045785 | Colorectum | AD | positive regulation of cell adhesion | 122/3918 | 437/18723 | 2.65e-04 | 3.28e-03 | 122 |
| GO:00108101 | Colorectum | SER | regulation of cell-substrate adhesion | 64/2897 | 221/18723 | 2.34e-07 | 1.29e-05 | 64 |
| GO:00108111 | Colorectum | SER | positive regulation of cell-substrate adhesion | 41/2897 | 123/18723 | 6.52e-07 | 3.15e-05 | 41 |
| GO:00315891 | Colorectum | SER | cell-substrate adhesion | 86/2897 | 363/18723 | 2.36e-05 | 6.64e-04 | 86 |
| GO:00457851 | Colorectum | SER | positive regulation of cell adhesion | 93/2897 | 437/18723 | 6.78e-04 | 9.04e-03 | 93 |
| GO:00108102 | Colorectum | MSS | regulation of cell-substrate adhesion | 73/3467 | 221/18723 | 1.56e-07 | 7.16e-06 | 73 |
| GO:00108112 | Colorectum | MSS | positive regulation of cell-substrate adhesion | 47/3467 | 123/18723 | 2.28e-07 | 9.79e-06 | 47 |
| GO:00315892 | Colorectum | MSS | cell-substrate adhesion | 104/3467 | 363/18723 | 1.35e-06 | 4.51e-05 | 104 |
| GO:00457852 | Colorectum | MSS | positive regulation of cell adhesion | 110/3467 | 437/18723 | 2.94e-04 | 3.87e-03 | 110 |
| GO:00108104 | Colorectum | FAP | regulation of cell-substrate adhesion | 68/2622 | 221/18723 | 9.67e-11 | 2.96e-08 | 68 |
| GO:00315893 | Colorectum | FAP | cell-substrate adhesion | 93/2622 | 363/18723 | 2.48e-09 | 4.61e-07 | 93 |
| GO:00108114 | Colorectum | FAP | positive regulation of cell-substrate adhesion | 43/2622 | 123/18723 | 3.82e-09 | 6.33e-07 | 43 |
| GO:00457854 | Colorectum | FAP | positive regulation of cell adhesion | 92/2622 | 437/18723 | 3.09e-05 | 7.04e-04 | 92 |
| GO:00108105 | Colorectum | CRC | regulation of cell-substrate adhesion | 57/2078 | 221/18723 | 6.94e-10 | 2.60e-07 | 57 |
| GO:00315894 | Colorectum | CRC | cell-substrate adhesion | 78/2078 | 363/18723 | 6.22e-09 | 1.49e-06 | 78 |
| GO:00108115 | Colorectum | CRC | positive regulation of cell-substrate adhesion | 37/2078 | 123/18723 | 8.34e-09 | 1.85e-06 | 37 |
| GO:00457855 | Colorectum | CRC | positive regulation of cell adhesion | 81/2078 | 437/18723 | 2.28e-06 | 1.10e-04 | 81 |
| Page: 1 2 |
| Pathway ID | Tissue | Disease Stage | Description | Gene Ratio | Bg Ratio | pvalue | p.adjust | qvalue | Count |
| Page: 1 |
Top |
Cell-cell communication analysis |
| Identification of potential cell-cell interactions between two cell types and their ligand-receptor pairs for different disease states |
| Ligand | Receptor | LRpair | Pathway | Tissue | Disease Stage |
| Page: 1 |
Top |
Single-cell gene regulatory network inference analysis |
| Find out the significant the regulons (TFs) and the target genes of each regulon across cell types for different disease states |
| TF | Cell Type | Tissue | Disease Stage | Target Gene | RSS | Regulon Activity |
| ∗The dot plots of a searched regulon are shown for all cell subpopulations in each disease state of each tissue based on the regulon specific score inferred using pySCENIC and by calculating the average expression. |
| Page: 1 |
Top |
Somatic mutation of malignant transformation related genes |
| Annotation of somatic variants for genes involved in malignant transformation |
| Hugo Symbol | Variant Class | Variant Classification | dbSNP RS | HGVSc | HGVSp | HGVSp Short | SWISSPROT | BIOTYPE | SIFT | PolyPhen | Tumor Sample Barcode | Tissue | Histology | Sex | Age | Stage | Therapy Types | Drugs | Outcome |
| EDIL3 | SNV | Missense_Mutation | rs368525977 | c.815N>A | p.Arg272His | p.R272H | O43854 | protein_coding | tolerated(0.12) | benign(0.003) | TCGA-A8-A09Z-01 | Breast | breast invasive carcinoma | Female | >=65 | I/II | Unknown | Unknown | SD |
| EDIL3 | SNV | Missense_Mutation | c.208N>A | p.Glu70Lys | p.E70K | O43854 | protein_coding | tolerated_low_confidence(0.68) | benign(0.003) | TCGA-AC-A23H-01 | Breast | breast invasive carcinoma | Female | >=65 | I/II | Unknown | Unknown | PD | |
| EDIL3 | insertion | Frame_Shift_Ins | novel | c.982_983insCAAATGCTCTCCTAATCAATCAATT | p.Gly328AlafsTer54 | p.G328Afs*54 | O43854 | protein_coding | TCGA-AO-A128-01 | Breast | breast invasive carcinoma | Female | <65 | I/II | Chemotherapy | doxorubicin | SD | ||
| EDIL3 | SNV | Missense_Mutation | rs765088380 | c.905N>A | p.Arg302Gln | p.R302Q | O43854 | protein_coding | tolerated(0.12) | probably_damaging(0.971) | TCGA-DR-A0ZM-01 | Cervix | cervical & endocervical cancer | Female | <65 | III/IV | Unspecific | Cisplatin | SD |
| EDIL3 | SNV | Missense_Mutation | c.143N>A | p.Cys48Tyr | p.C48Y | O43854 | protein_coding | deleterious(0) | probably_damaging(1) | TCGA-EA-A50E-01 | Cervix | cervical & endocervical cancer | Female | <65 | I/II | Unknown | Unknown | PD | |
| EDIL3 | SNV | Missense_Mutation | c.1403C>A | p.Thr468Lys | p.T468K | O43854 | protein_coding | deleterious(0) | probably_damaging(0.996) | TCGA-RA-A741-01 | Cervix | cervical & endocervical cancer | Female | <65 | I/II | Chemotherapy | cisplatin | SD | |
| EDIL3 | SNV | Missense_Mutation | c.1319A>G | p.Asp440Gly | p.D440G | O43854 | protein_coding | deleterious(0.04) | benign(0.281) | TCGA-5M-AATE-01 | Colorectum | colon adenocarcinoma | Male | >=65 | I/II | Unknown | Unknown | PD | |
| EDIL3 | SNV | Missense_Mutation | c.1228C>G | p.Leu410Val | p.L410V | O43854 | protein_coding | tolerated(1) | benign(0.003) | TCGA-A6-6782-01 | Colorectum | colon adenocarcinoma | Male | >=65 | I/II | Unknown | Unknown | SD | |
| EDIL3 | SNV | Missense_Mutation | c.583N>T | p.Arg195Cys | p.R195C | O43854 | protein_coding | deleterious(0) | probably_damaging(1) | TCGA-AA-3495-01 | Colorectum | colon adenocarcinoma | Male | >=65 | I/II | Unknown | Unknown | SD | |
| EDIL3 | SNV | Missense_Mutation | c.616N>G | p.Thr206Ala | p.T206A | O43854 | protein_coding | deleterious(0.01) | possibly_damaging(0.9) | TCGA-AA-3510-01 | Colorectum | colon adenocarcinoma | Male | >=65 | I/II | Unknown | Unknown | SD |
| Page: 1 2 3 4 5 6 7 8 9 10 11 |
Top |
Related drugs of malignant transformation related genes |
| Identification of chemicals and drugs interact with genes involved in malignant transfromation |
| (DGIdb 4.0) |
| Entrez ID | Symbol | Category | Interaction Types | Drug Claim Name | Drug Name | PMIDs |
| Page: 1 |

Copyright 2023-Present -The University of Texas Health Science Center at Houston |