
|
|||||
|
 | |
| |
| |
| |
| |
| |
|
Gene: EDF1 |
Gene summary for EDF1 |
| Gene information | Species | Human | Gene symbol | EDF1 | Gene ID | 8721 |
| Gene name | endothelial differentiation related factor 1 | |
| Gene Alias | CFAP280 | |
| Cytomap | 9q34.3 | |
| Gene Type | protein-coding | GO ID | GO:0003158 | UniProtAcc | O60869 |
Top |
Malignant transformation analysis |
| Identification of the aberrant gene expression in precancerous and cancerous lesions by comparing the gene expression of stem-like cells in diseased tissues with normal stem cells |
| Entrez ID | Symbol | Replicates | Species | Organ | Tissue | Adj P-value | Log2FC | Malignancy |
| 8721 | EDF1 | GSM4909280 | Human | Breast | Precancer | 3.38e-04 | -3.93e-01 | 0.0305 |
| 8721 | EDF1 | GSM4909282 | Human | Breast | IDC | 4.32e-08 | -3.48e-01 | -0.0288 |
| 8721 | EDF1 | GSM4909285 | Human | Breast | IDC | 1.79e-09 | -2.59e-01 | 0.21 |
| 8721 | EDF1 | GSM4909286 | Human | Breast | IDC | 5.75e-14 | -2.00e-01 | 0.1081 |
| 8721 | EDF1 | GSM4909287 | Human | Breast | IDC | 3.22e-07 | -3.94e-01 | 0.2057 |
| 8721 | EDF1 | GSM4909288 | Human | Breast | IDC | 3.44e-04 | 1.57e-02 | 0.0988 |
| 8721 | EDF1 | GSM4909293 | Human | Breast | IDC | 1.94e-04 | -1.96e-01 | 0.1581 |
| 8721 | EDF1 | GSM4909294 | Human | Breast | IDC | 2.12e-08 | -3.15e-01 | 0.2022 |
| 8721 | EDF1 | GSM4909296 | Human | Breast | IDC | 1.55e-13 | 8.47e-02 | 0.1524 |
| 8721 | EDF1 | GSM4909297 | Human | Breast | IDC | 1.72e-30 | -3.01e-01 | 0.1517 |
| 8721 | EDF1 | GSM4909298 | Human | Breast | IDC | 4.38e-06 | -2.43e-01 | 0.1551 |
| 8721 | EDF1 | GSM4909302 | Human | Breast | IDC | 6.06e-06 | -1.32e-01 | 0.1545 |
| 8721 | EDF1 | GSM4909309 | Human | Breast | IDC | 6.03e-04 | -1.26e-01 | 0.0483 |
| 8721 | EDF1 | GSM4909311 | Human | Breast | IDC | 8.91e-54 | -2.58e-01 | 0.1534 |
| 8721 | EDF1 | GSM4909312 | Human | Breast | IDC | 6.11e-10 | -2.28e-01 | 0.1552 |
| 8721 | EDF1 | GSM4909313 | Human | Breast | IDC | 6.46e-06 | -1.84e-01 | 0.0391 |
| 8721 | EDF1 | GSM4909315 | Human | Breast | IDC | 4.98e-03 | 4.03e-02 | 0.21 |
| 8721 | EDF1 | GSM4909316 | Human | Breast | IDC | 2.67e-10 | 3.78e-02 | 0.21 |
| 8721 | EDF1 | GSM4909318 | Human | Breast | IDC | 1.07e-04 | 1.45e-01 | 0.2031 |
| 8721 | EDF1 | GSM4909319 | Human | Breast | IDC | 3.04e-74 | -6.90e-01 | 0.1563 |
| Page: 1 2 3 4 5 6 7 8 9 10 11 12 13 14 15 16 |
| Tissue | Expression Dynamics | Abbreviation |
| Breast | 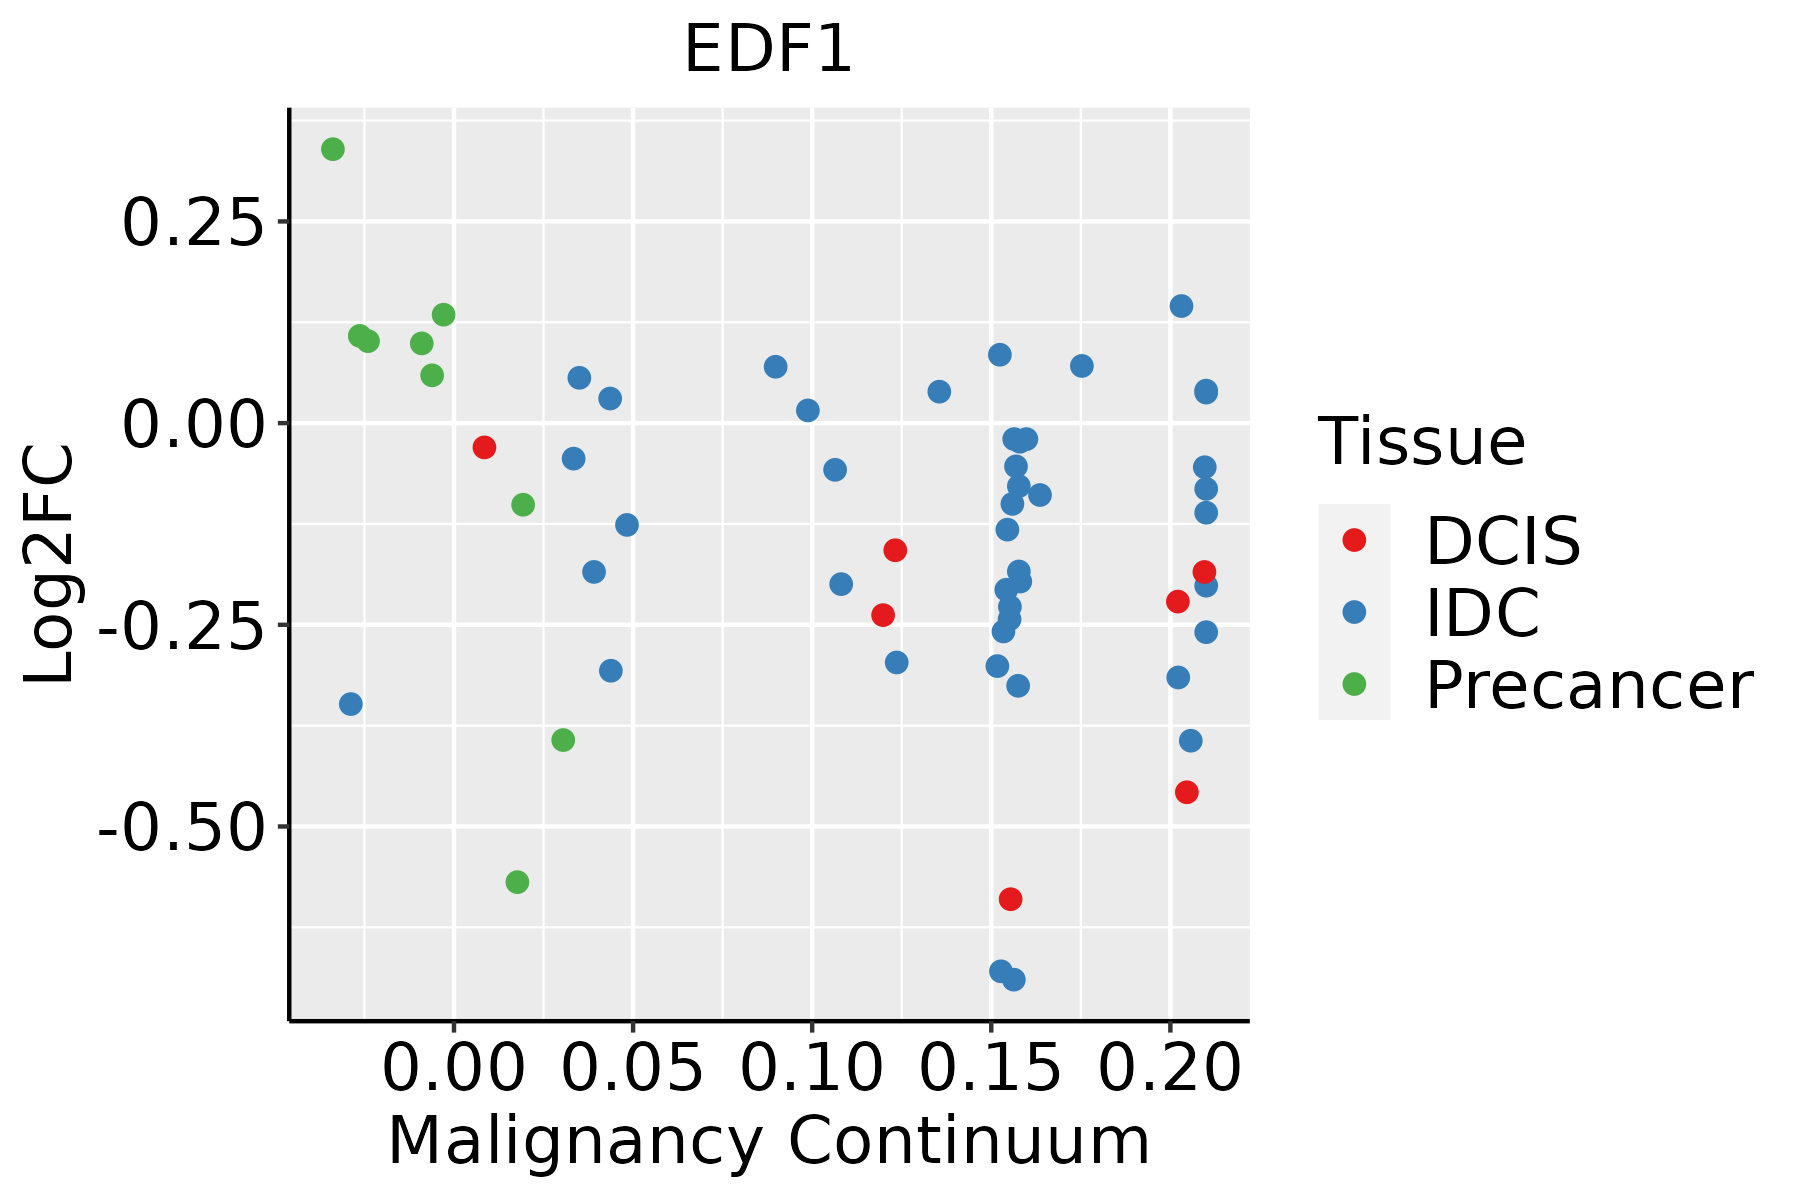 | IDC: Invasive ductal carcinoma |
| DCIS: Ductal carcinoma in situ | ||
| Precancer(BRCA1-mut): Precancerous lesion from BRCA1 mutation carriers | ||
| Cervix | 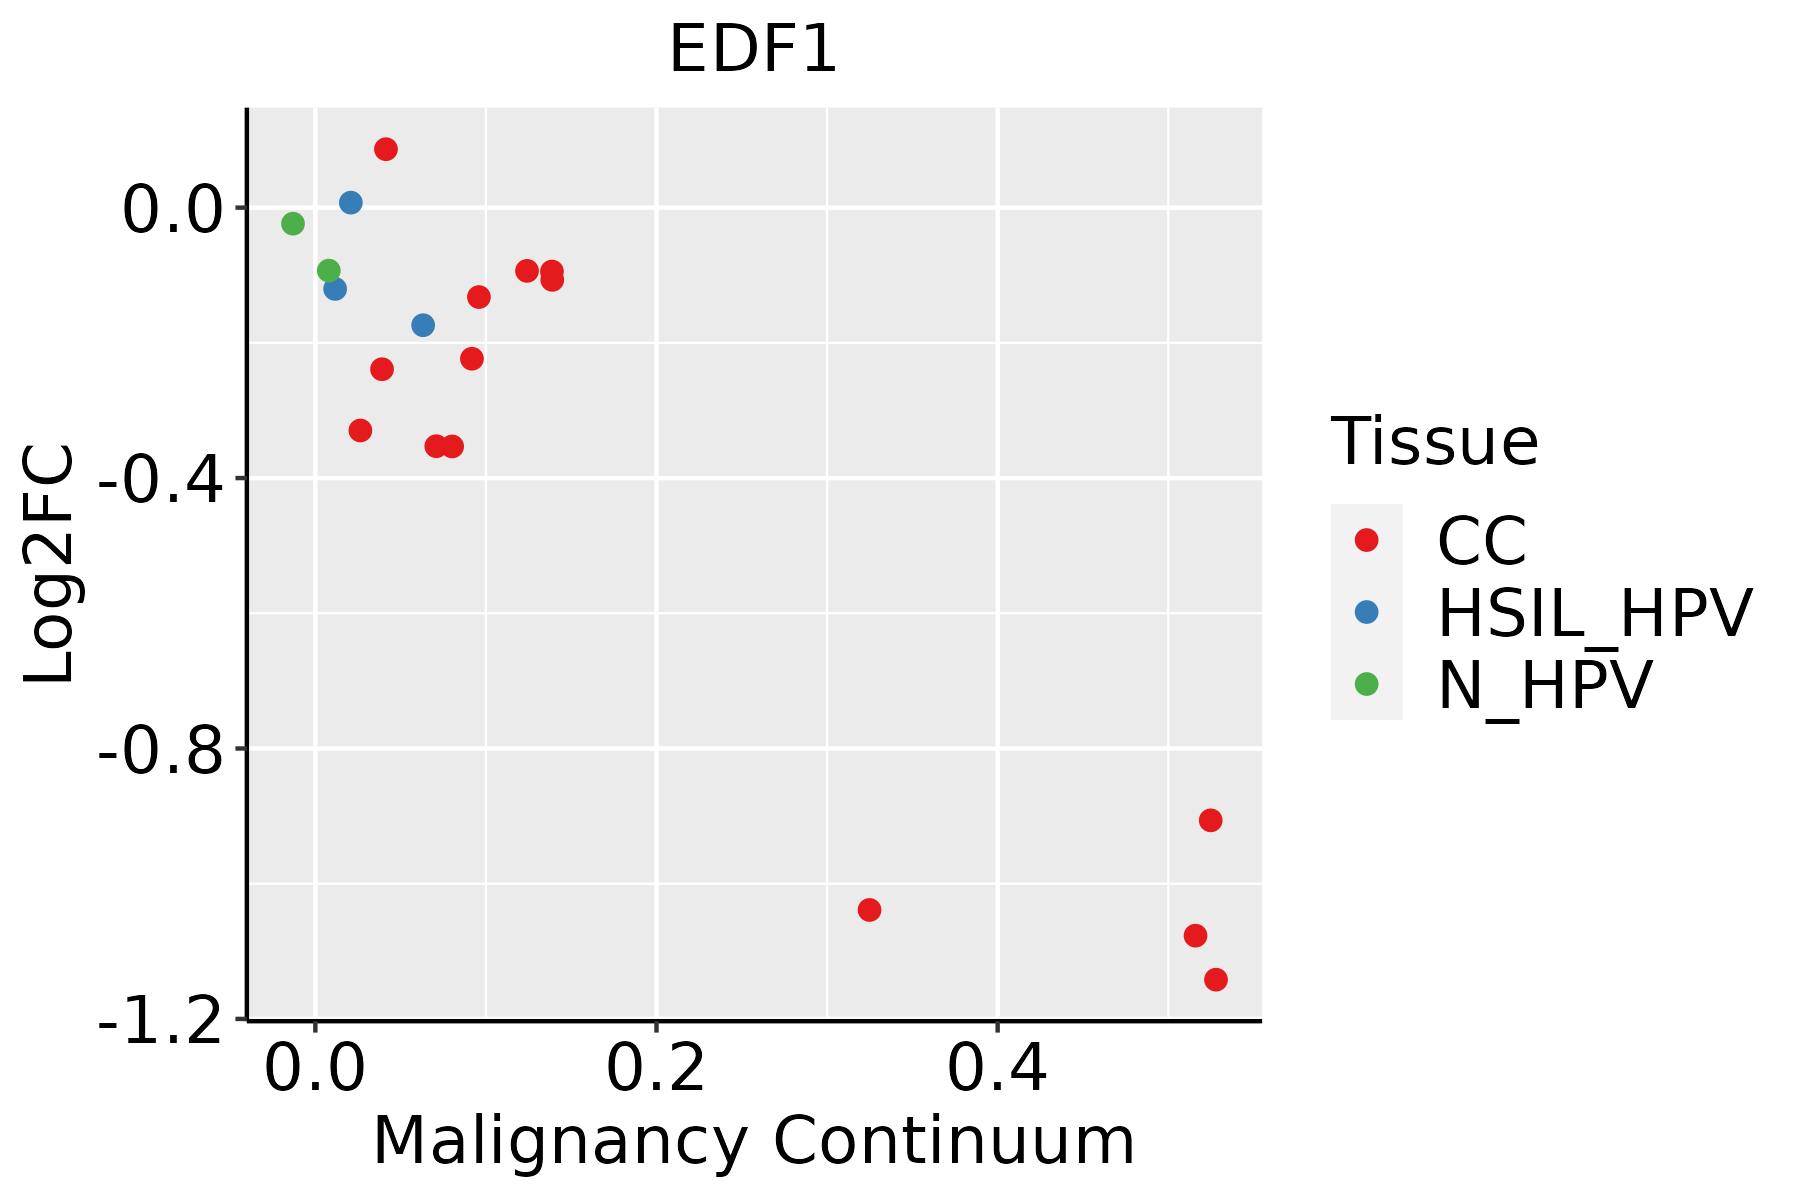 | CC: Cervix cancer |
| HSIL_HPV: HPV-infected high-grade squamous intraepithelial lesions | ||
| N_HPV: HPV-infected normal cervix | ||
| Colorectum (GSE201348) |  | FAP: Familial adenomatous polyposis |
| CRC: Colorectal cancer | ||
| Colorectum (HTA11) | 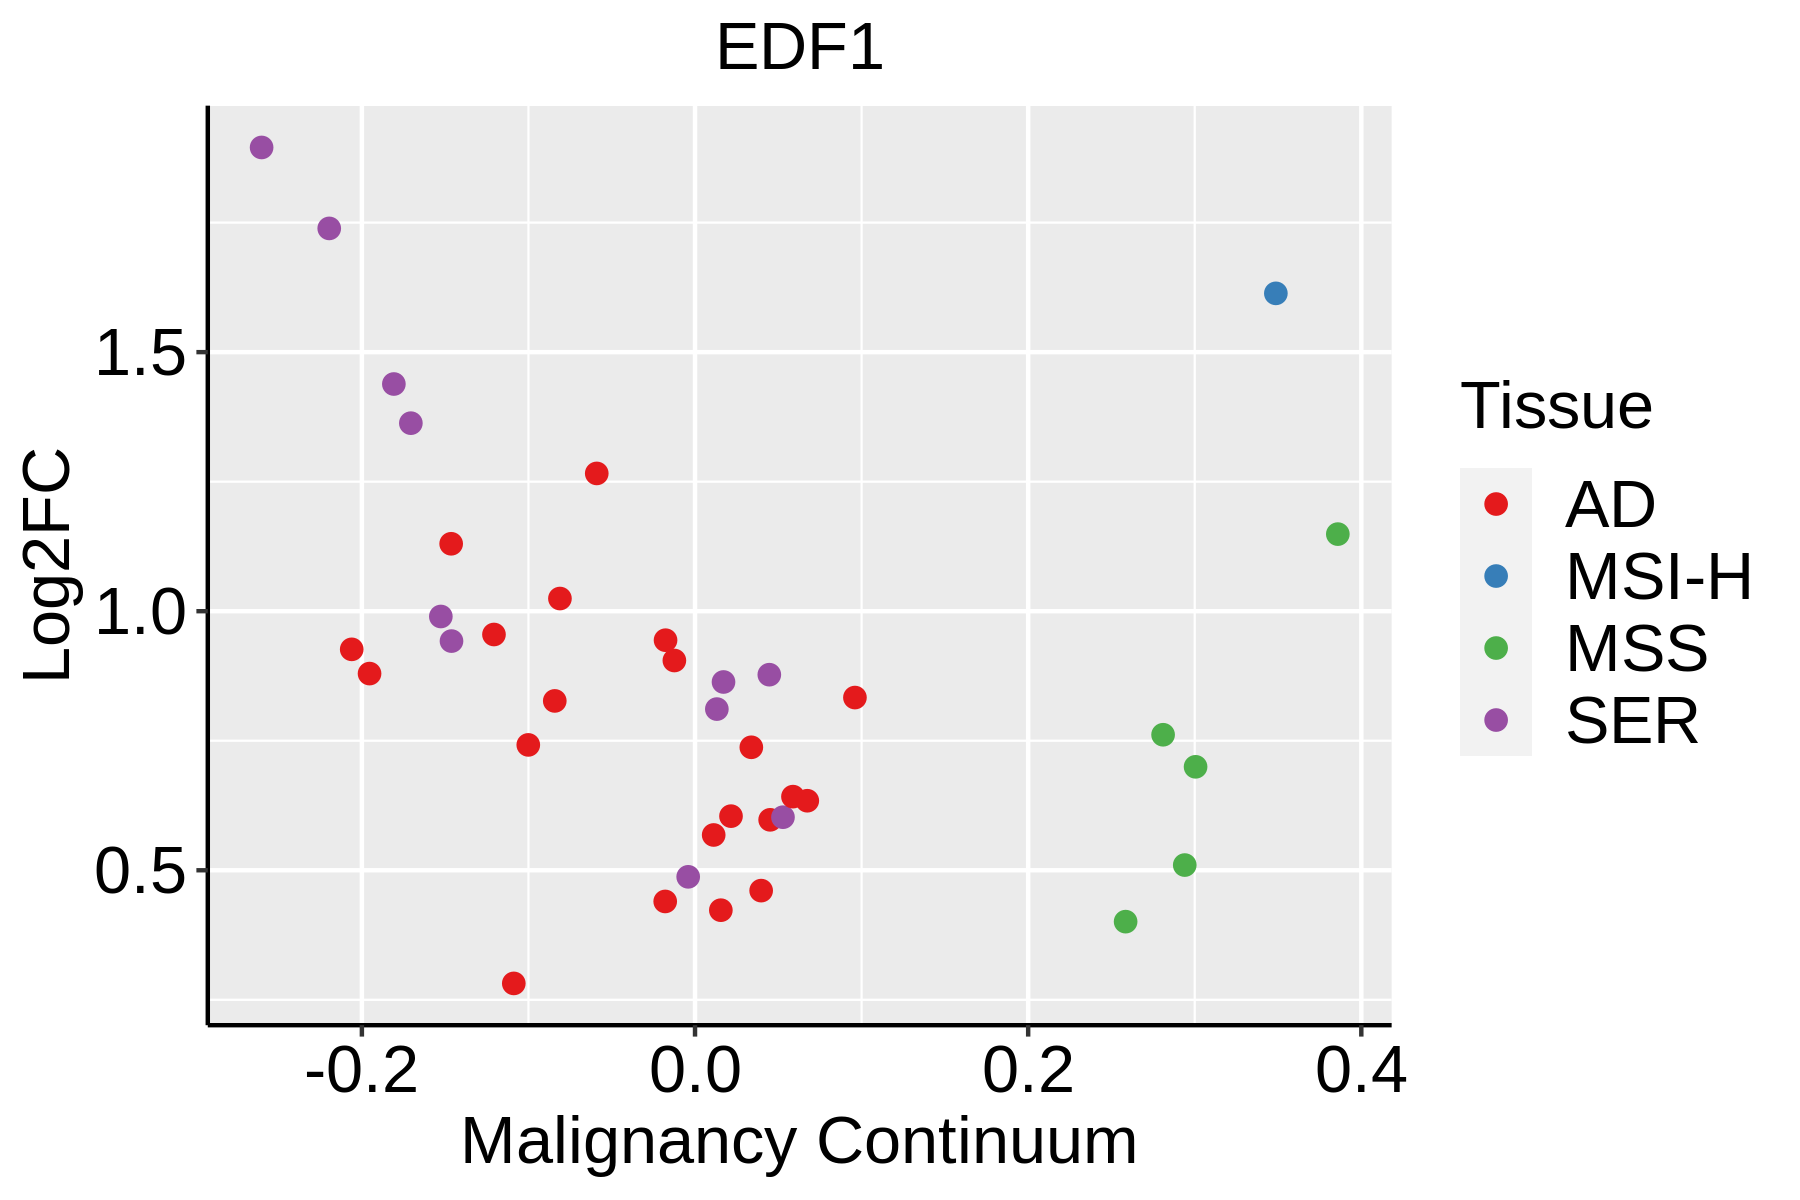 | AD: Adenomas |
| SER: Sessile serrated lesions | ||
| MSI-H: Microsatellite-high colorectal cancer | ||
| MSS: Microsatellite stable colorectal cancer | ||
| Endometrium | 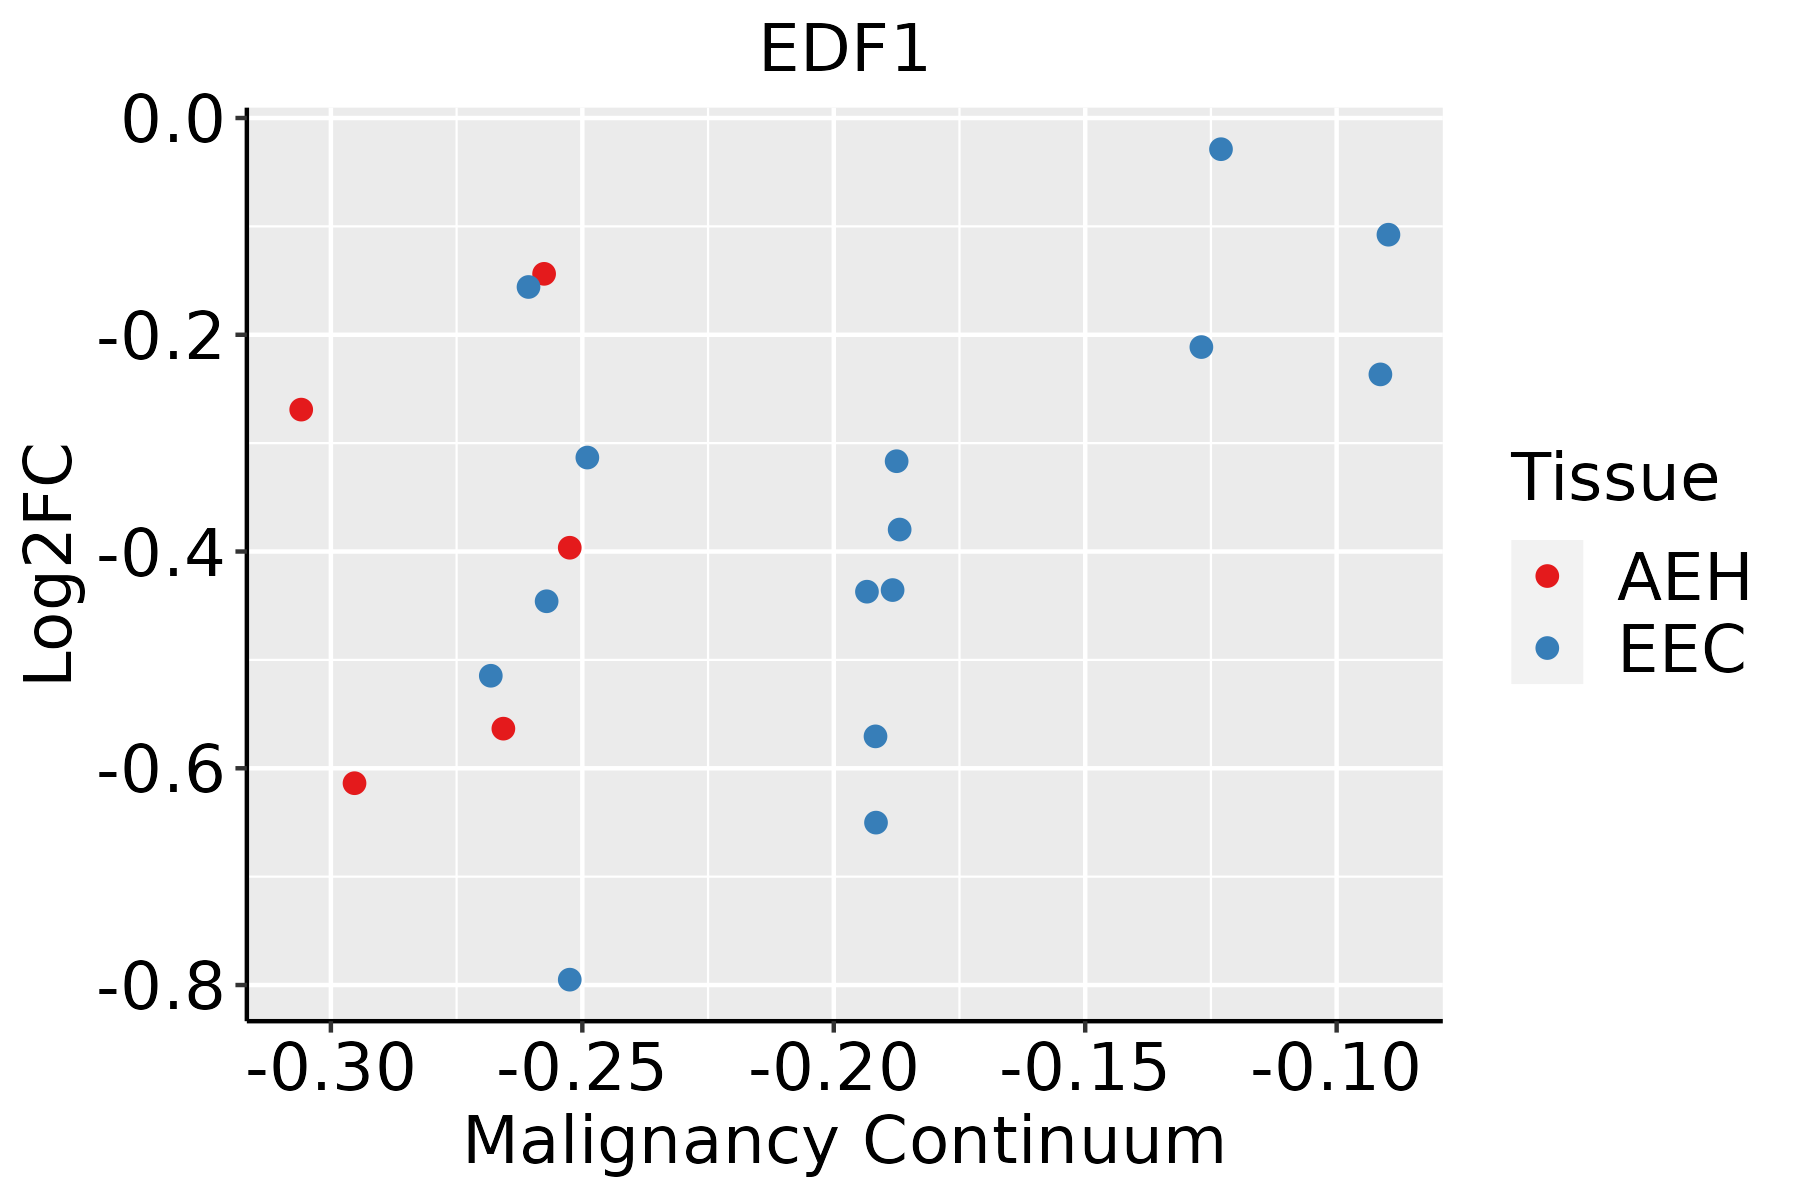 | AEH: Atypical endometrial hyperplasia |
| EEC: Endometrioid Cancer | ||
| Esophagus | 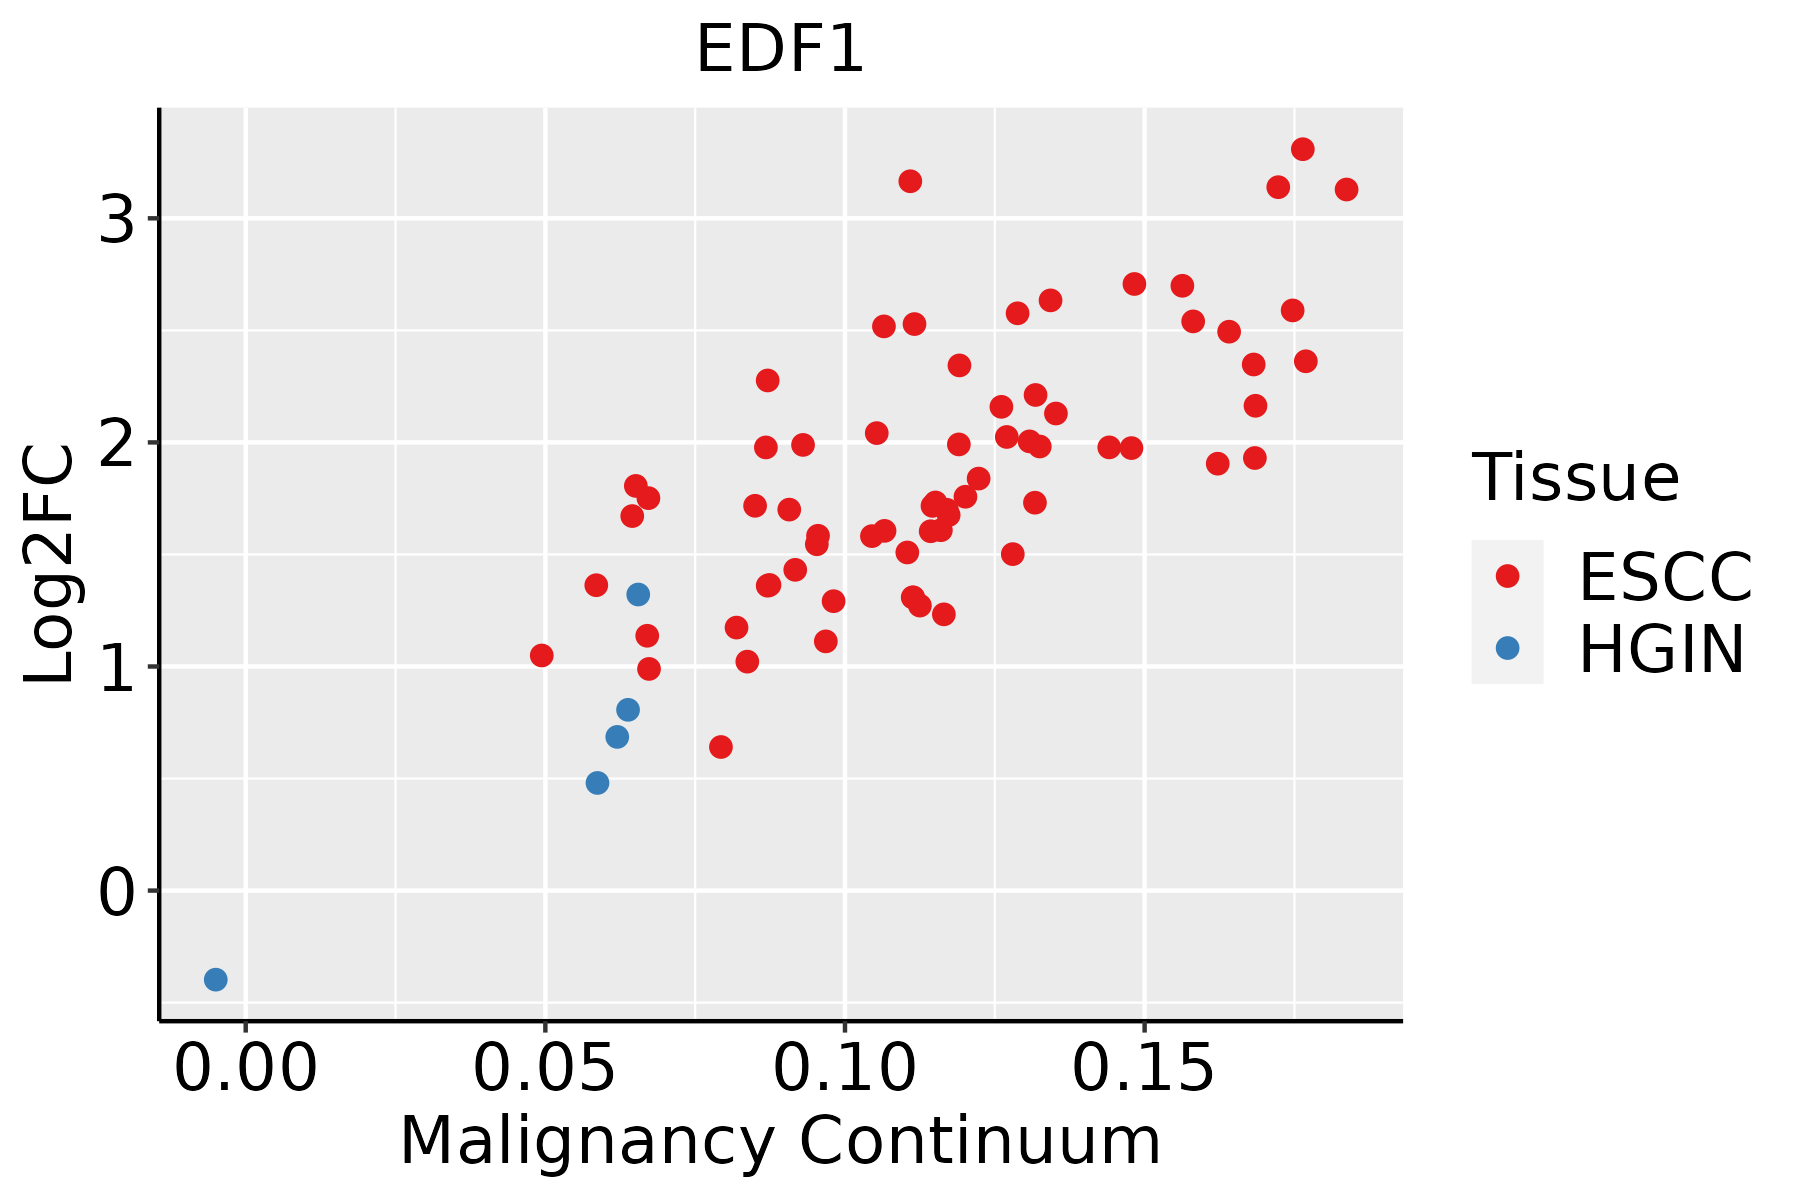 | ESCC: Esophageal squamous cell carcinoma |
| HGIN: High-grade intraepithelial neoplasias | ||
| LGIN: Low-grade intraepithelial neoplasias | ||
| GC | 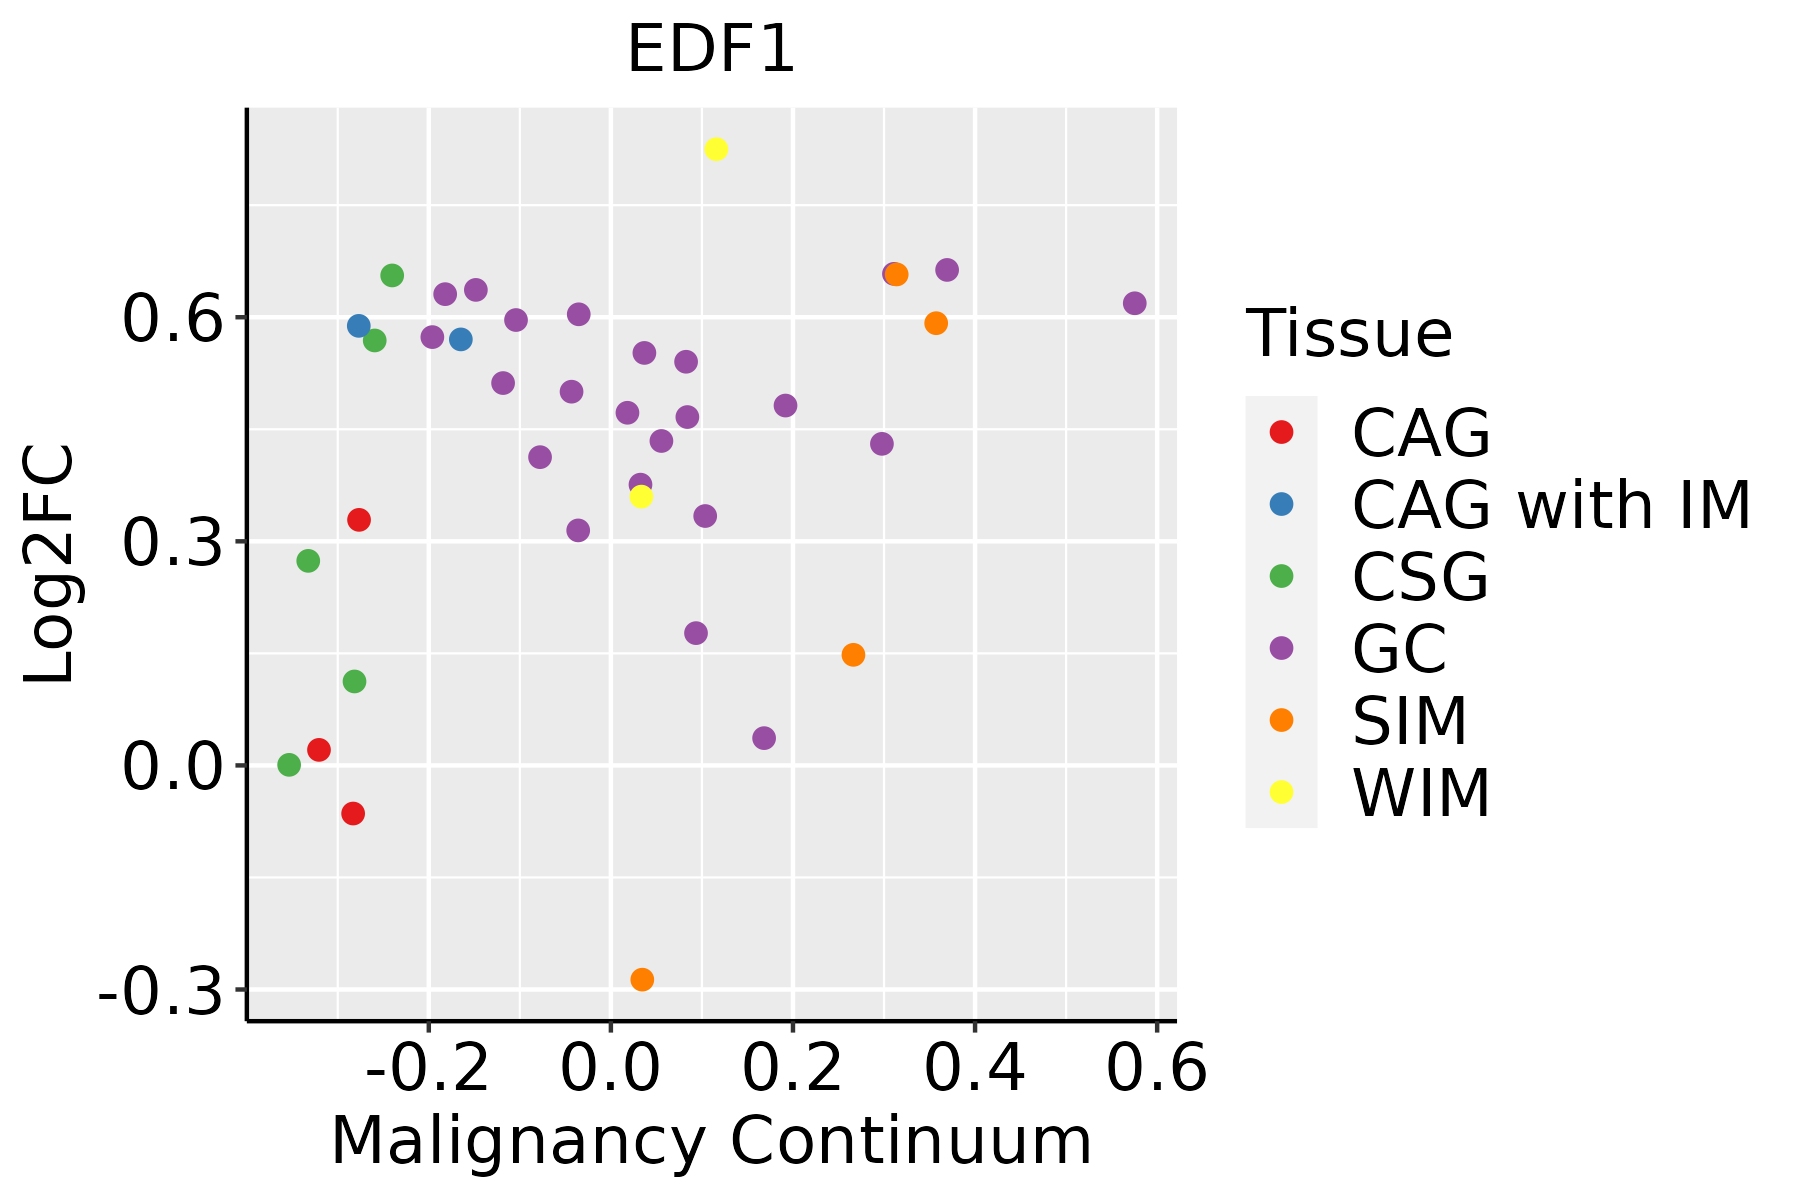 | CAG: Chronic atrophic gastritis |
| CAG with IM: Chronic atrophic gastritis with intestinal metaplasia | ||
| CSG: Chronic superficial gastritis | ||
| GC: Gastric cancer | ||
| SIM: Severe intestinal metaplasia | ||
| WIM: Wild intestinal metaplasia | ||
| Liver | 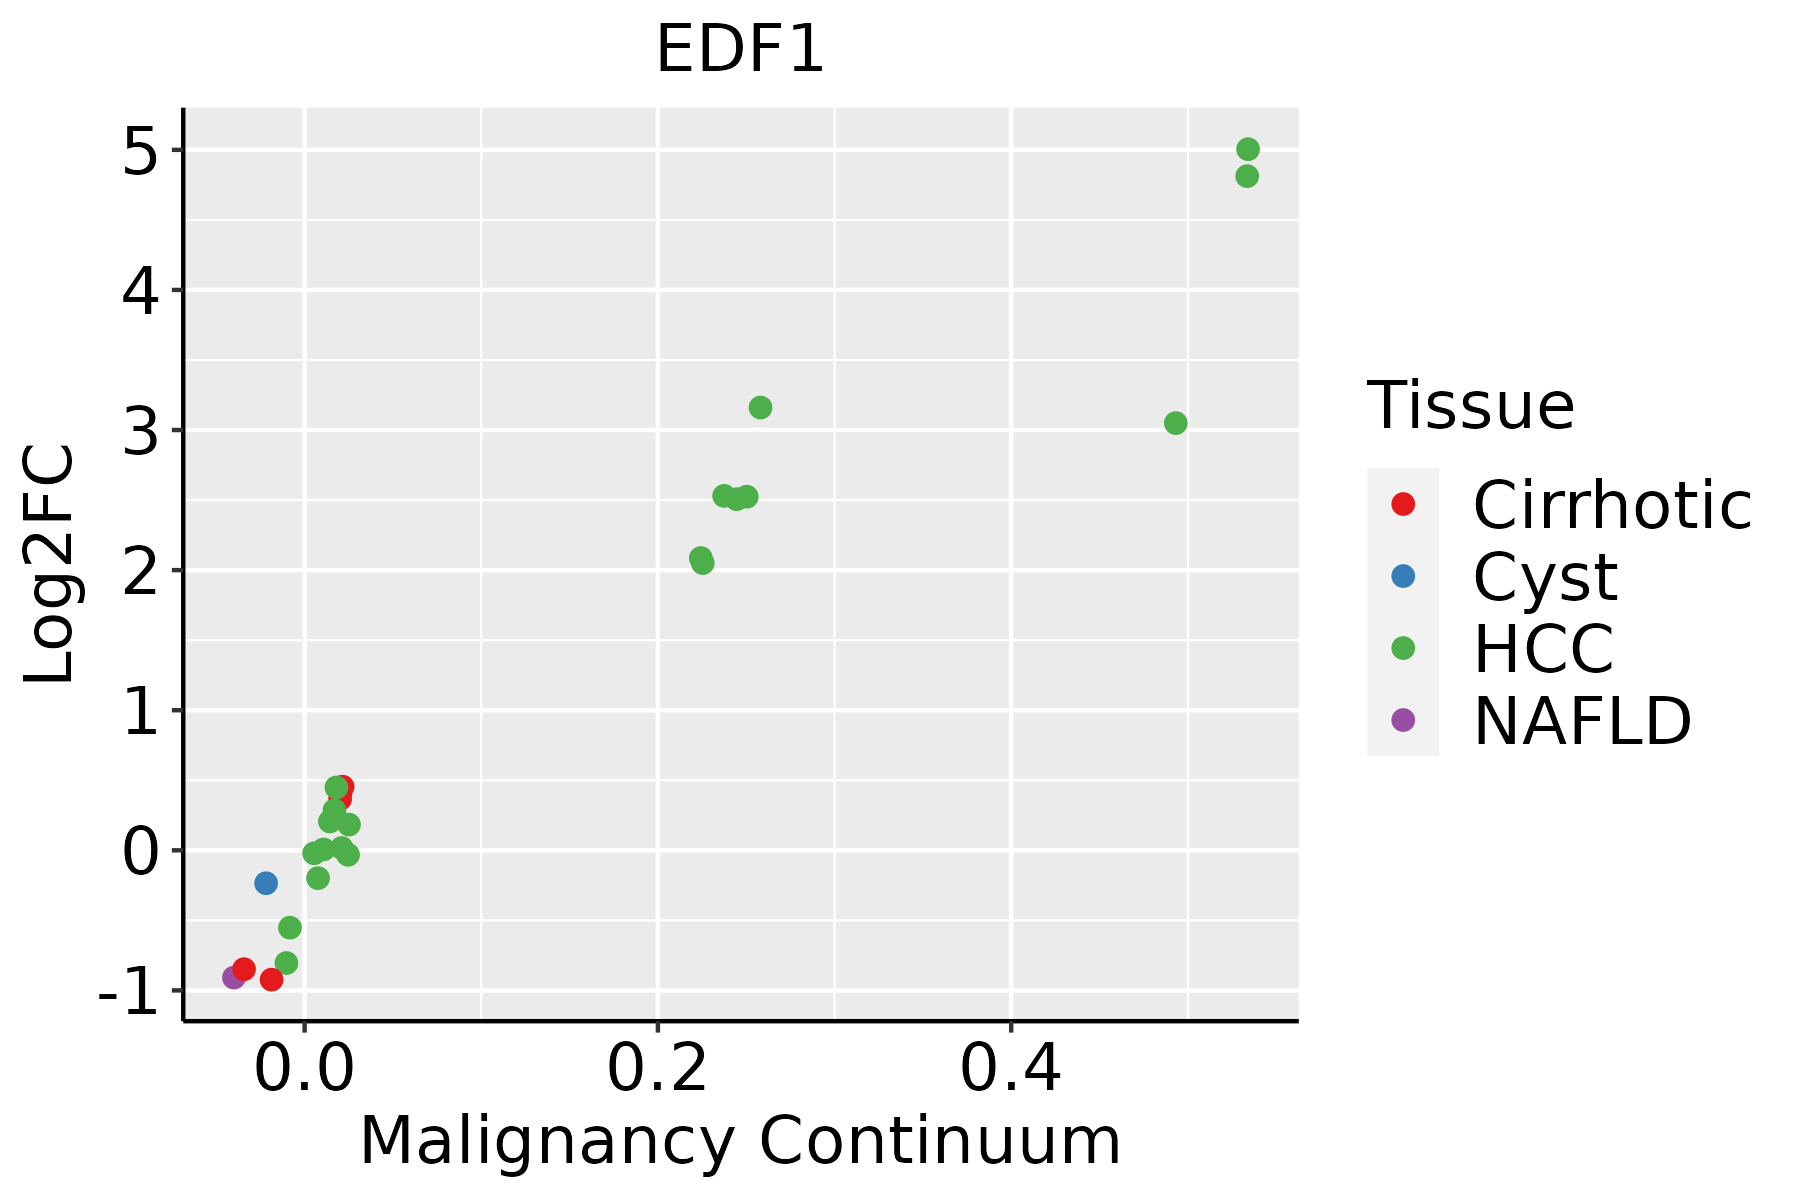 | HCC: Hepatocellular carcinoma |
| NAFLD: Non-alcoholic fatty liver disease | ||
| Oral Cavity |  | EOLP: Erosive Oral lichen planus |
| LP: leukoplakia | ||
| NEOLP: Non-erosive oral lichen planus | ||
| OSCC: Oral squamous cell carcinoma | ||
| Prostate | 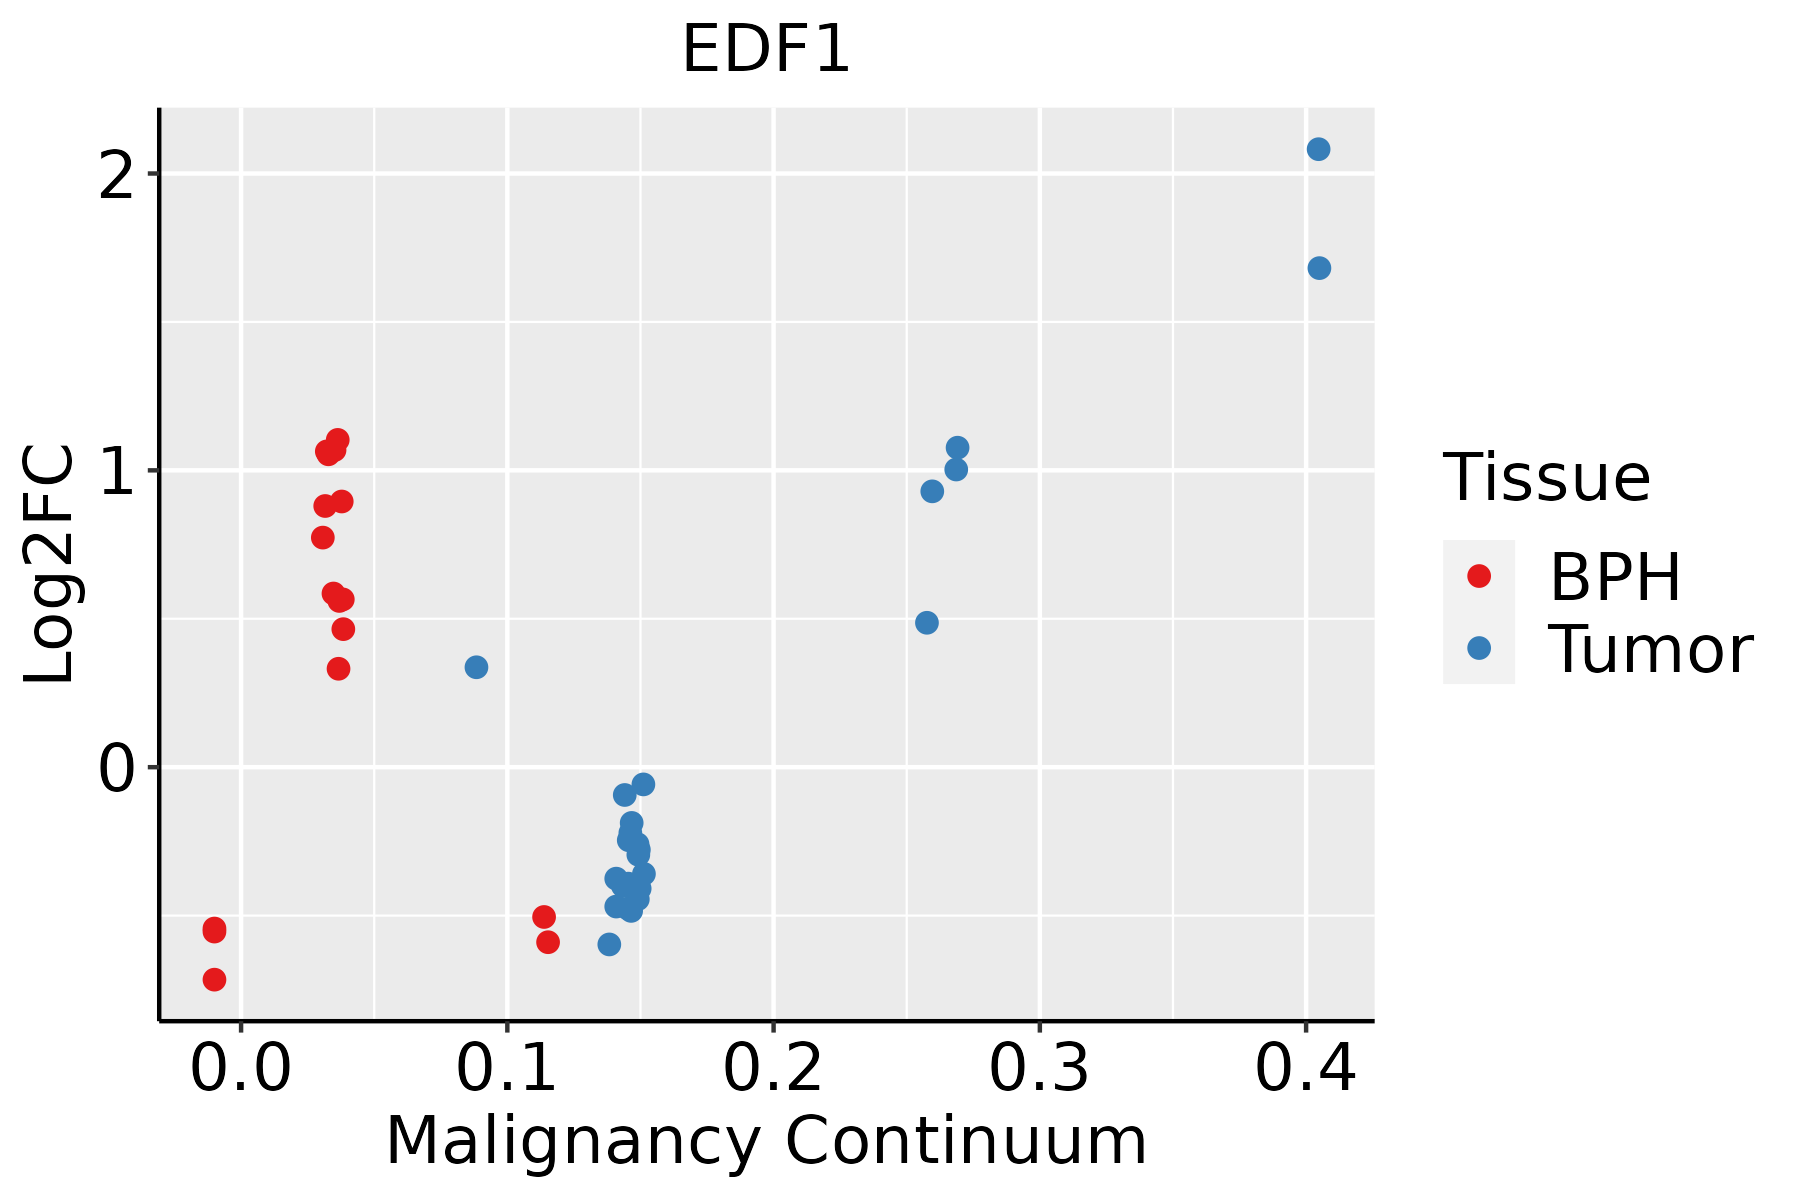 | BPH: Benign Prostatic Hyperplasia |
| Skin | 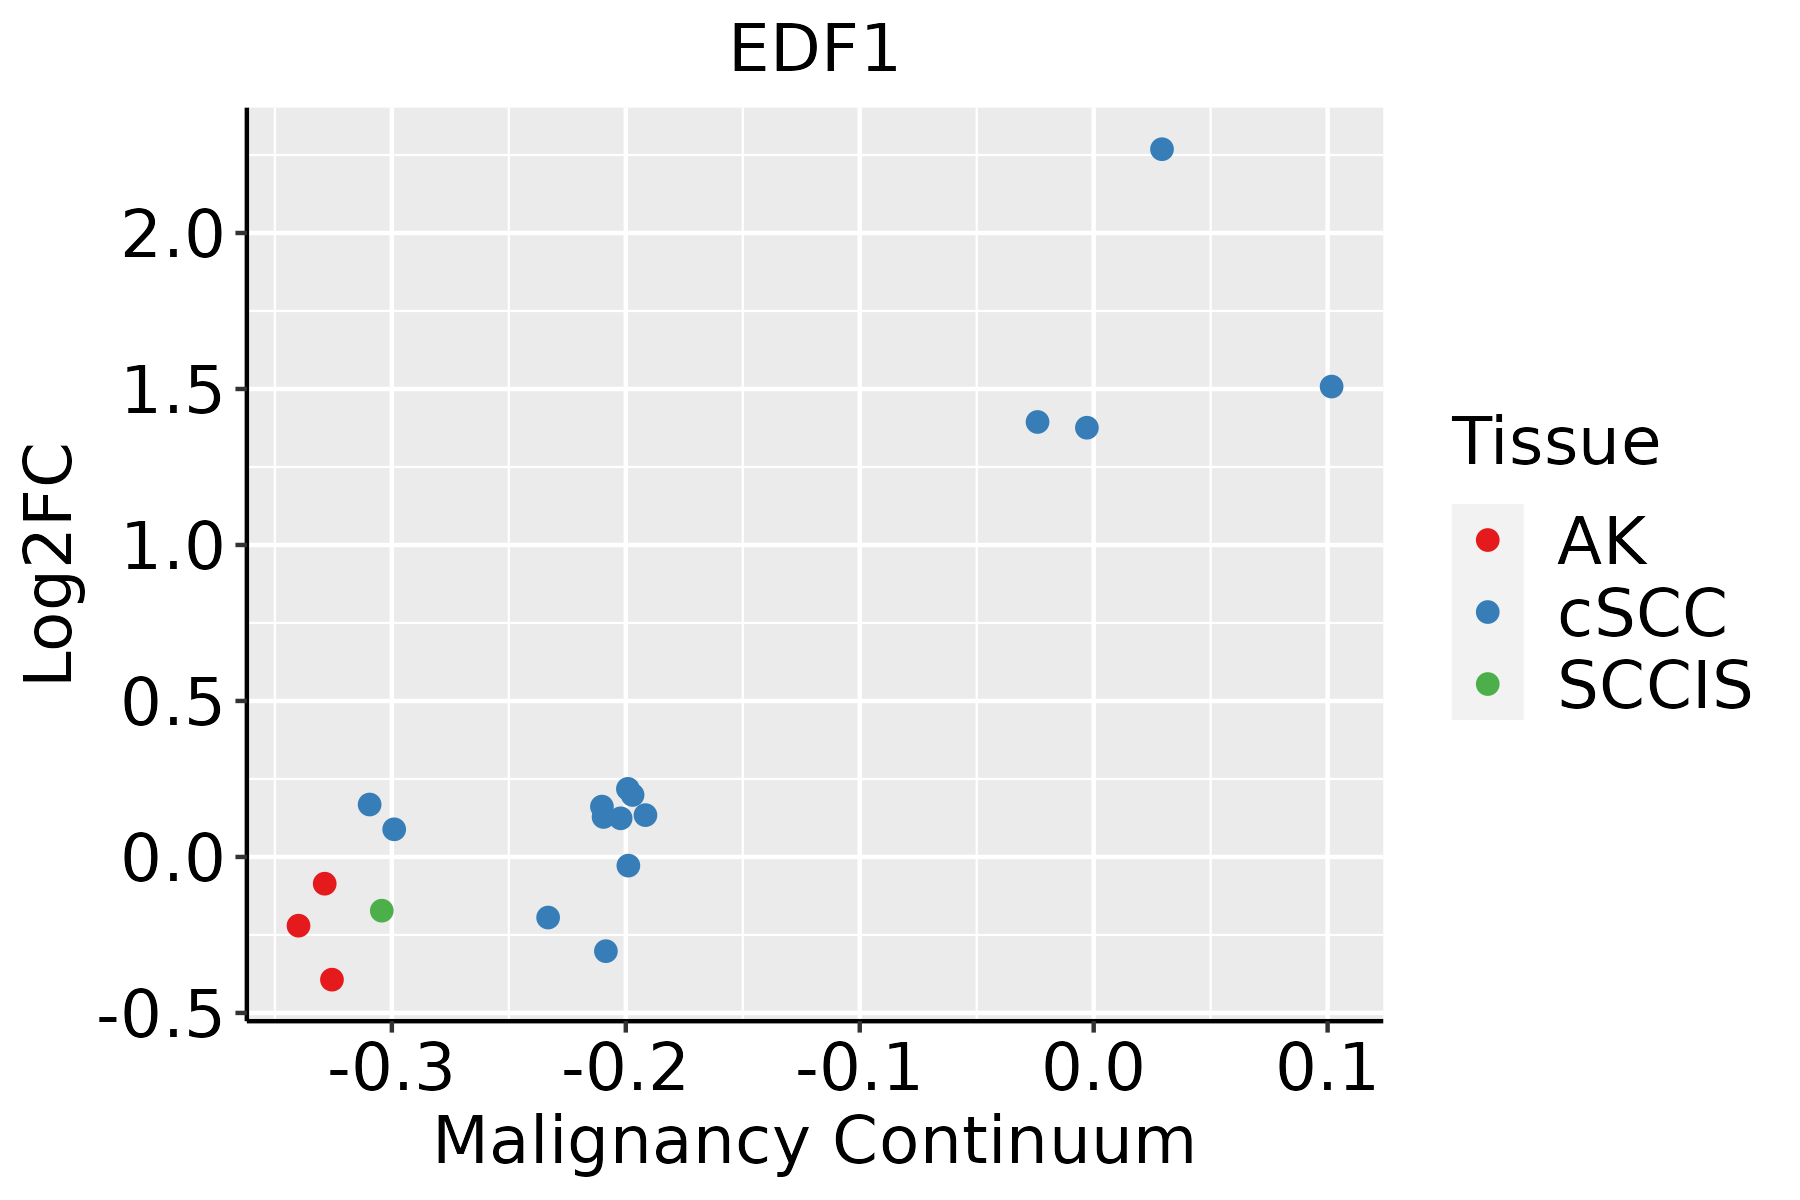 | AK: Actinic keratosis |
| cSCC: Cutaneous squamous cell carcinoma | ||
| SCCIS:squamous cell carcinoma in situ | ||
| Thyroid |  | ATC: Anaplastic thyroid cancer |
| HT: Hashimoto's thyroiditis | ||
| PTC: Papillary thyroid cancer |
| ∗log2FC in expression of this searched gene in stem-like cells from each diseased tissue sample relative to stem-like cells in normal samples in each tissue plotted against the malignancy continuum. Samples are colored based on if they are from different disease stage. |
Top |
Malignant transformation related pathway analysis |
| Find out the enriched GO biological processes and KEGG pathways involved in transition from healthy to precancer to cancer |
| Tissue | Disease Stage | Enriched GO biological Processes |
| Colorectum | AD |  |
| Colorectum | SER |  |
| Colorectum | MSS |  |
| Colorectum | MSI-H |  |
| Colorectum | FAP |  |
| ∗Top 15 enriched GO BP terms are showed in the bar plot of each disease state in each tissue. Each row represents a significant GO biological process which is colored according to the -log10(p.adjust). |
| Page: 1 2 3 4 5 6 7 8 9 |
| GO ID | Tissue | Disease Stage | Description | Gene Ratio | Bg Ratio | pvalue | p.adjust | Count |
| GO:00511019 | Breast | Precancer | regulation of DNA binding | 22/1080 | 118/18723 | 9.28e-07 | 3.71e-05 | 22 |
| GO:00433887 | Breast | Precancer | positive regulation of DNA binding | 14/1080 | 56/18723 | 2.46e-06 | 8.35e-05 | 14 |
| GO:00510989 | Breast | Precancer | regulation of binding | 44/1080 | 363/18723 | 2.59e-06 | 8.65e-05 | 44 |
| GO:00510999 | Breast | Precancer | positive regulation of binding | 23/1080 | 173/18723 | 1.58e-04 | 2.68e-03 | 23 |
| GO:00192164 | Breast | Precancer | regulation of lipid metabolic process | 34/1080 | 331/18723 | 8.14e-04 | 9.55e-03 | 34 |
| GO:005109814 | Breast | IDC | regulation of binding | 57/1434 | 363/18723 | 1.59e-07 | 8.76e-06 | 57 |
| GO:005110114 | Breast | IDC | regulation of DNA binding | 26/1434 | 118/18723 | 7.42e-07 | 3.40e-05 | 26 |
| GO:005109914 | Breast | IDC | positive regulation of binding | 30/1434 | 173/18723 | 1.96e-05 | 4.86e-04 | 30 |
| GO:004338812 | Breast | IDC | positive regulation of DNA binding | 14/1434 | 56/18723 | 6.11e-05 | 1.27e-03 | 14 |
| GO:001921612 | Breast | IDC | regulation of lipid metabolic process | 45/1434 | 331/18723 | 1.21e-04 | 2.24e-03 | 45 |
| GO:005109823 | Breast | DCIS | regulation of binding | 55/1390 | 363/18723 | 3.14e-07 | 1.48e-05 | 55 |
| GO:005110123 | Breast | DCIS | regulation of DNA binding | 26/1390 | 118/18723 | 4.09e-07 | 1.87e-05 | 26 |
| GO:004338822 | Breast | DCIS | positive regulation of DNA binding | 14/1390 | 56/18723 | 4.34e-05 | 9.14e-04 | 14 |
| GO:005109923 | Breast | DCIS | positive regulation of binding | 28/1390 | 173/18723 | 7.50e-05 | 1.47e-03 | 28 |
| GO:001921621 | Breast | DCIS | regulation of lipid metabolic process | 43/1390 | 331/18723 | 2.37e-04 | 3.71e-03 | 43 |
| GO:00031588 | Breast | DCIS | endothelium development | 19/1390 | 136/18723 | 5.61e-03 | 4.07e-02 | 19 |
| GO:005109810 | Cervix | CC | regulation of binding | 80/2311 | 363/18723 | 1.32e-07 | 6.42e-06 | 80 |
| GO:005109910 | Cervix | CC | positive regulation of binding | 42/2311 | 173/18723 | 1.07e-05 | 2.33e-04 | 42 |
| GO:005110110 | Cervix | CC | regulation of DNA binding | 31/2311 | 118/18723 | 2.91e-05 | 4.81e-04 | 31 |
| GO:00433888 | Cervix | CC | positive regulation of DNA binding | 15/2311 | 56/18723 | 2.60e-03 | 1.80e-02 | 15 |
| Page: 1 2 3 4 5 6 7 8 9 |
| Pathway ID | Tissue | Disease Stage | Description | Gene Ratio | Bg Ratio | pvalue | p.adjust | qvalue | Count |
| Page: 1 |
Top |
Cell-cell communication analysis |
| Identification of potential cell-cell interactions between two cell types and their ligand-receptor pairs for different disease states |
| Ligand | Receptor | LRpair | Pathway | Tissue | Disease Stage |
| Page: 1 |
Top |
Single-cell gene regulatory network inference analysis |
| Find out the significant the regulons (TFs) and the target genes of each regulon across cell types for different disease states |
| TF | Cell Type | Tissue | Disease Stage | Target Gene | RSS | Regulon Activity |
| ∗The dot plots of a searched regulon are shown for all cell subpopulations in each disease state of each tissue based on the regulon specific score inferred using pySCENIC and by calculating the average expression. |
| Page: 1 |
Top |
Somatic mutation of malignant transformation related genes |
| Annotation of somatic variants for genes involved in malignant transformation |
| Hugo Symbol | Variant Class | Variant Classification | dbSNP RS | HGVSc | HGVSp | HGVSp Short | SWISSPROT | BIOTYPE | SIFT | PolyPhen | Tumor Sample Barcode | Tissue | Histology | Sex | Age | Stage | Therapy Types | Drugs | Outcome |
| EDF1 | SNV | Missense_Mutation | c.196N>A | p.Glu66Lys | p.E66K | O60869 | protein_coding | deleterious(0) | probably_damaging(0.969) | TCGA-IR-A3LA-01 | Cervix | cervical & endocervical cancer | Female | <65 | I/II | Chemotherapy | cisplatin | CR | |
| EDF1 | SNV | Missense_Mutation | rs201413596 | c.319G>A | p.Ala107Thr | p.A107T | O60869 | protein_coding | tolerated(0.65) | benign(0.007) | TCGA-AZ-6598-01 | Colorectum | colon adenocarcinoma | Female | >=65 | I/II | Unknown | Unknown | SD |
| EDF1 | SNV | Missense_Mutation | novel | c.109N>T | p.Asp37Tyr | p.D37Y | O60869 | protein_coding | deleterious(0.04) | benign(0.436) | TCGA-DF-A2KU-01 | Endometrium | uterine corpus endometrioid carcinoma | Female | Unknown | I/II | Unknown | Unknown | SD |
| EDF1 | SNV | Missense_Mutation | novel | c.258N>T | p.Gln86His | p.Q86H | O60869 | protein_coding | deleterious(0.03) | probably_damaging(0.93) | TCGA-FI-A2D5-01 | Endometrium | uterine corpus endometrioid carcinoma | Female | <65 | III/IV | Chemotherapy | carboplatinum | PD |
| EDF1 | insertion | Frame_Shift_Ins | novel | c.271_272insA | p.Thr91AsnfsTer11 | p.T91Nfs*11 | O60869 | protein_coding | TCGA-A5-A2K3-01 | Endometrium | uterine corpus endometrioid carcinoma | Female | >=65 | I/II | Chemotherapy | carboplatin | SD | ||
| EDF1 | SNV | Missense_Mutation | novel | c.299A>T | p.Asn100Ile | p.N100I | O60869 | protein_coding | deleterious(0) | probably_damaging(0.965) | TCGA-22-5479-01 | Lung | lung squamous cell carcinoma | Male | <65 | I/II | Chemotherapy | carboplatin | SD |
| EDF1 | SNV | Missense_Mutation | c.406G>A | p.Asp136Asn | p.D136N | O60869 | protein_coding | tolerated(0.27) | benign(0.007) | TCGA-58-A46M-01 | Lung | lung squamous cell carcinoma | Male | <65 | I/II | Unknown | Unknown | SD | |
| EDF1 | SNV | Missense_Mutation | novel | c.373G>C | p.Glu125Gln | p.E125Q | O60869 | protein_coding | deleterious(0.02) | probably_damaging(1) | TCGA-CQ-5331-01 | Oral cavity | head & neck squamous cell carcinoma | Female | >=65 | I/II | Unknown | Unknown | SD |
| EDF1 | SNV | Missense_Mutation | novel | c.49C>A | p.Pro17Thr | p.P17T | O60869 | protein_coding | deleterious(0.01) | possibly_damaging(0.474) | TCGA-VP-A879-01 | Prostate | prostate adenocarcinoma | Male | >=65 | 9 | Unknown | Unknown | SD |
| EDF1 | SNV | Missense_Mutation | rs139723037 | c.187C>T | p.Arg63Trp | p.R63W | O60869 | protein_coding | deleterious(0.02) | probably_damaging(0.973) | TCGA-BR-4256-01 | Stomach | stomach adenocarcinoma | Male | >=65 | I/II | Unknown | Unknown | SD |
| Page: 1 2 |
Top |
Related drugs of malignant transformation related genes |
| Identification of chemicals and drugs interact with genes involved in malignant transfromation |
| (DGIdb 4.0) |
| Entrez ID | Symbol | Category | Interaction Types | Drug Claim Name | Drug Name | PMIDs |
| Page: 1 |

Copyright 2023-Present -The University of Texas Health Science Center at Houston |