
|
|||||
|
 | |
| |
| |
| |
| |
| |
|
Gene: EDEM3 |
Gene summary for EDEM3 |
| Gene information | Species | Human | Gene symbol | EDEM3 | Gene ID | 80267 |
| Gene name | ER degradation enhancing alpha-mannosidase like protein 3 | |
| Gene Alias | C1orf22 | |
| Cytomap | 1q25.3 | |
| Gene Type | protein-coding | GO ID | GO:0005975 | UniProtAcc | Q9BZQ6 |
Top |
Malignant transformation analysis |
| Identification of the aberrant gene expression in precancerous and cancerous lesions by comparing the gene expression of stem-like cells in diseased tissues with normal stem cells |
| Entrez ID | Symbol | Replicates | Species | Organ | Tissue | Adj P-value | Log2FC | Malignancy |
| 80267 | EDEM3 | LZE4T | Human | Esophagus | ESCC | 4.43e-14 | 2.85e-01 | 0.0811 |
| 80267 | EDEM3 | LZE7T | Human | Esophagus | ESCC | 5.64e-12 | 5.23e-01 | 0.0667 |
| 80267 | EDEM3 | LZE8T | Human | Esophagus | ESCC | 6.74e-04 | 1.65e-01 | 0.067 |
| 80267 | EDEM3 | LZE20T | Human | Esophagus | ESCC | 5.45e-03 | 1.39e-01 | 0.0662 |
| 80267 | EDEM3 | LZE22T | Human | Esophagus | ESCC | 4.44e-03 | 3.72e-01 | 0.068 |
| 80267 | EDEM3 | LZE24T | Human | Esophagus | ESCC | 8.45e-11 | 3.23e-01 | 0.0596 |
| 80267 | EDEM3 | LZE21T | Human | Esophagus | ESCC | 2.08e-03 | 2.31e-01 | 0.0655 |
| 80267 | EDEM3 | P1T-E | Human | Esophagus | ESCC | 1.86e-09 | 3.30e-01 | 0.0875 |
| 80267 | EDEM3 | P2T-E | Human | Esophagus | ESCC | 2.72e-26 | 3.79e-01 | 0.1177 |
| 80267 | EDEM3 | P4T-E | Human | Esophagus | ESCC | 2.42e-23 | 4.76e-01 | 0.1323 |
| 80267 | EDEM3 | P5T-E | Human | Esophagus | ESCC | 1.92e-11 | 2.42e-01 | 0.1327 |
| 80267 | EDEM3 | P8T-E | Human | Esophagus | ESCC | 7.51e-22 | 3.08e-01 | 0.0889 |
| 80267 | EDEM3 | P9T-E | Human | Esophagus | ESCC | 1.27e-17 | 4.21e-01 | 0.1131 |
| 80267 | EDEM3 | P10T-E | Human | Esophagus | ESCC | 7.63e-32 | 5.23e-01 | 0.116 |
| 80267 | EDEM3 | P11T-E | Human | Esophagus | ESCC | 2.36e-12 | 3.20e-01 | 0.1426 |
| 80267 | EDEM3 | P12T-E | Human | Esophagus | ESCC | 4.71e-18 | 2.74e-01 | 0.1122 |
| 80267 | EDEM3 | P15T-E | Human | Esophagus | ESCC | 6.19e-22 | 4.30e-01 | 0.1149 |
| 80267 | EDEM3 | P16T-E | Human | Esophagus | ESCC | 1.28e-25 | 4.23e-01 | 0.1153 |
| 80267 | EDEM3 | P19T-E | Human | Esophagus | ESCC | 2.95e-03 | 2.45e-01 | 0.1662 |
| 80267 | EDEM3 | P20T-E | Human | Esophagus | ESCC | 8.62e-12 | 3.59e-01 | 0.1124 |
| Page: 1 2 3 4 5 |
| Tissue | Expression Dynamics | Abbreviation |
| Esophagus | 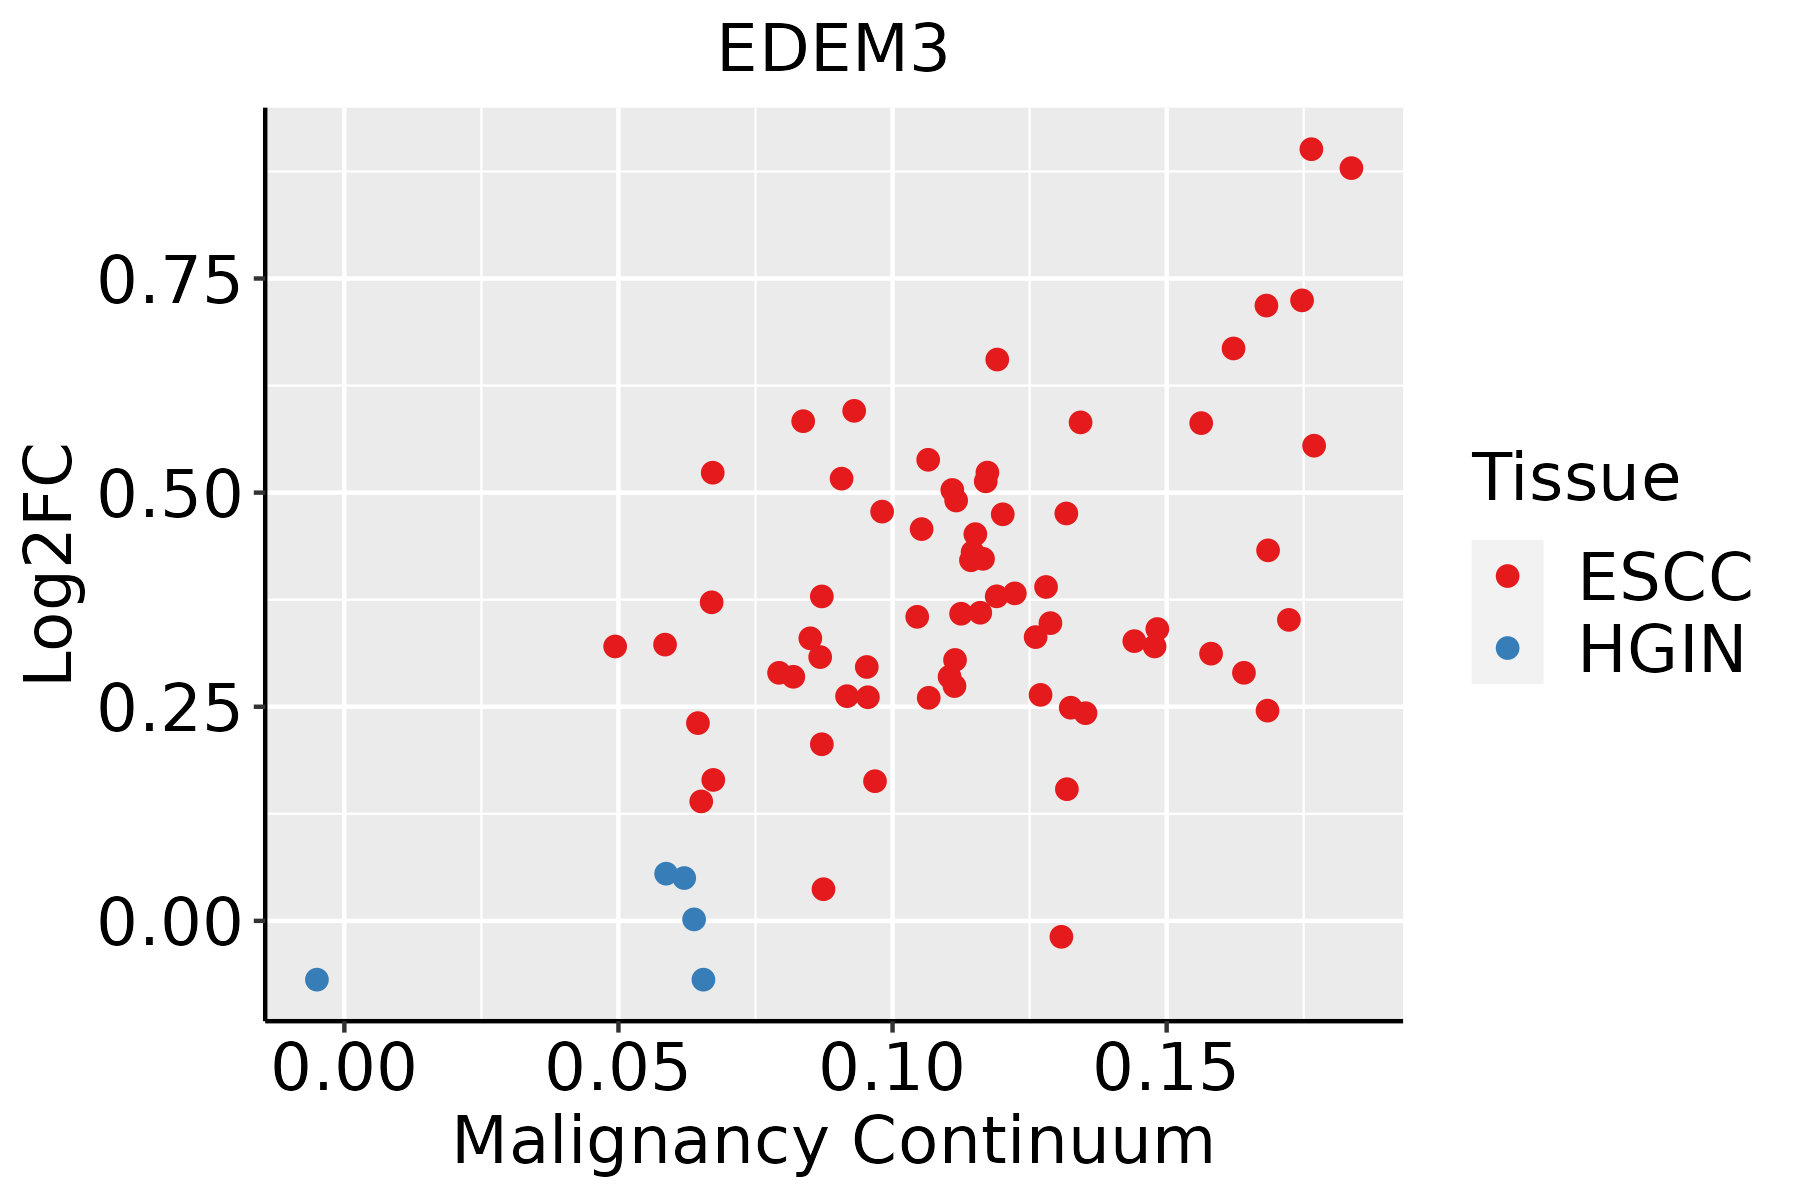 | ESCC: Esophageal squamous cell carcinoma |
| HGIN: High-grade intraepithelial neoplasias | ||
| LGIN: Low-grade intraepithelial neoplasias | ||
| Liver |  | HCC: Hepatocellular carcinoma |
| NAFLD: Non-alcoholic fatty liver disease | ||
| Prostate |  | BPH: Benign Prostatic Hyperplasia |
| Thyroid | 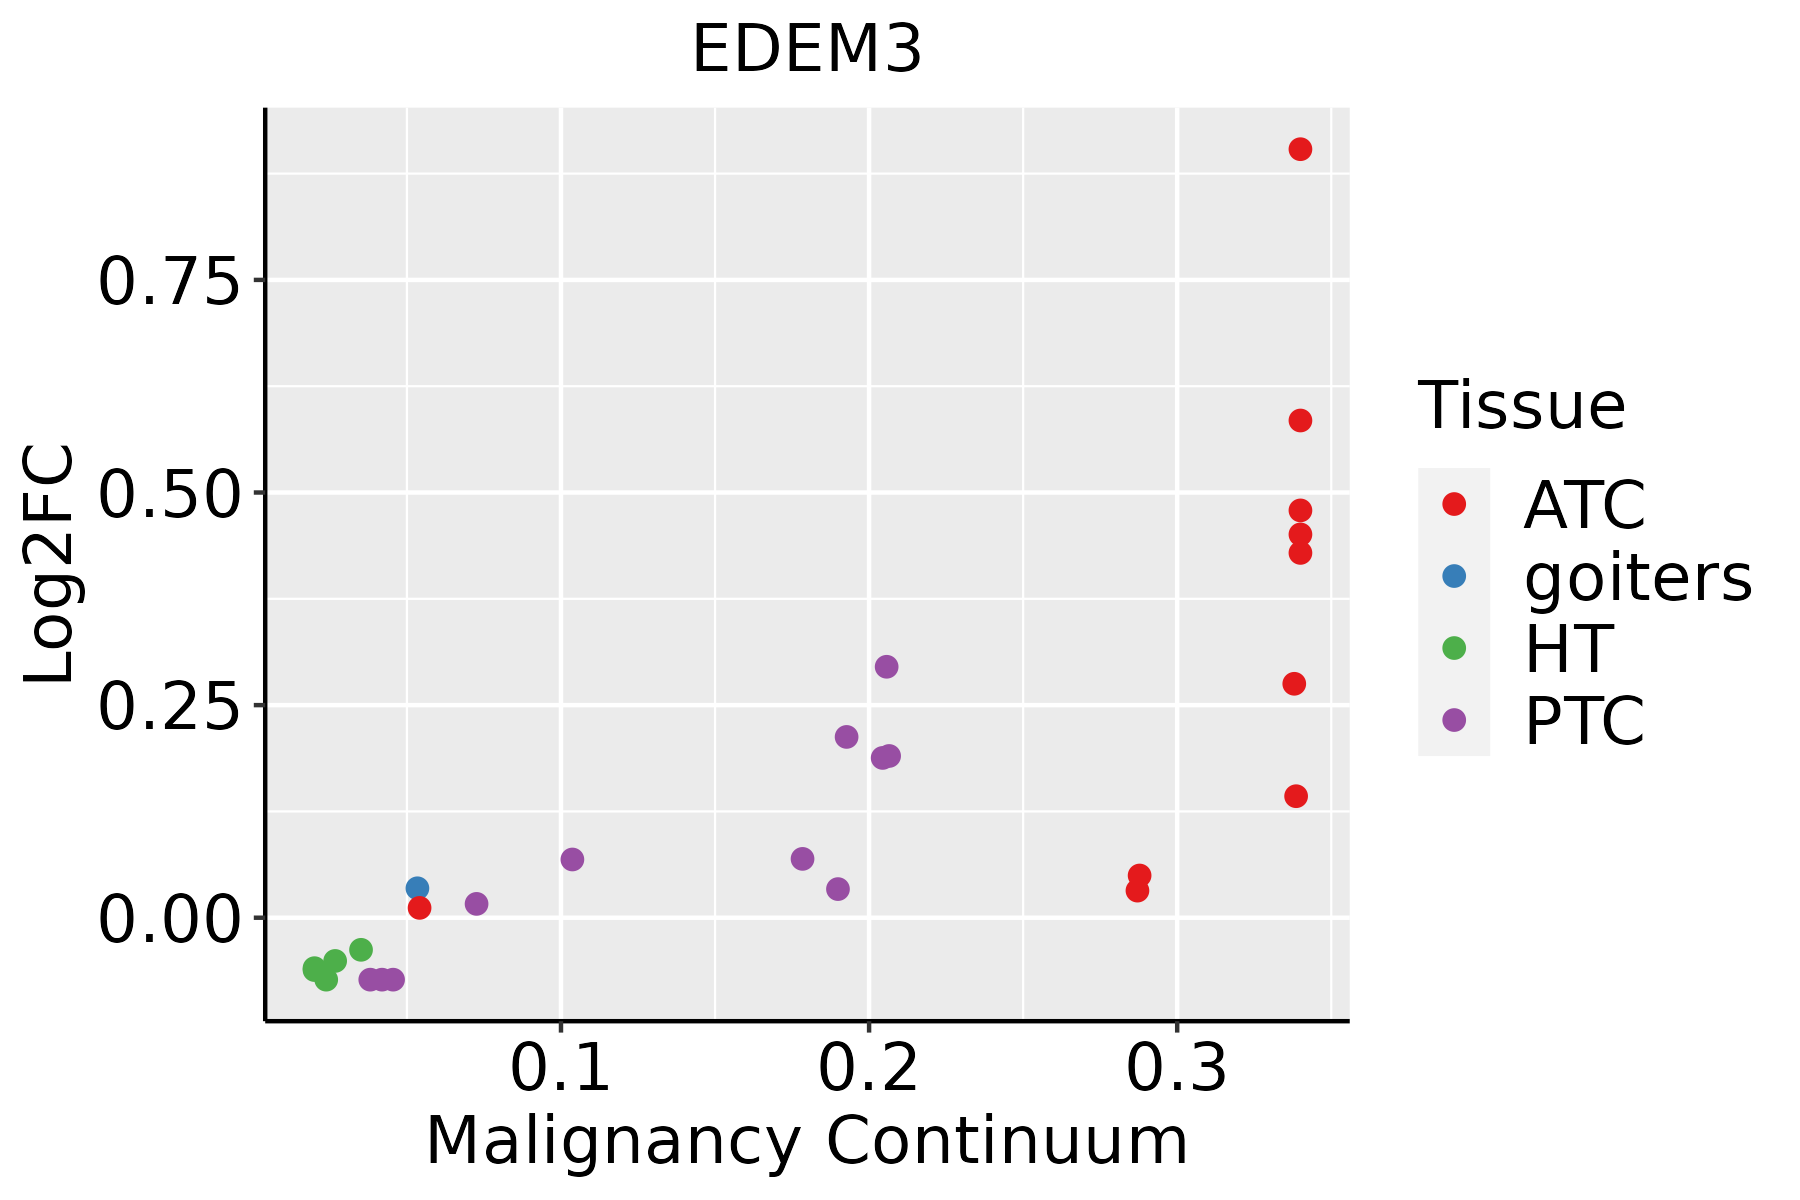 | ATC: Anaplastic thyroid cancer |
| HT: Hashimoto's thyroiditis | ||
| PTC: Papillary thyroid cancer |
| ∗log2FC in expression of this searched gene in stem-like cells from each diseased tissue sample relative to stem-like cells in normal samples in each tissue plotted against the malignancy continuum. Samples are colored based on if they are from different disease stage. |
Top |
Malignant transformation related pathway analysis |
| Find out the enriched GO biological processes and KEGG pathways involved in transition from healthy to precancer to cancer |
| Tissue | Disease Stage | Enriched GO biological Processes |
| Colorectum | AD |  |
| Colorectum | SER |  |
| Colorectum | MSS |  |
| Colorectum | MSI-H |  |
| Colorectum | FAP |  |
| ∗Top 15 enriched GO BP terms are showed in the bar plot of each disease state in each tissue. Each row represents a significant GO biological process which is colored according to the -log10(p.adjust). |
| Page: 1 2 3 4 5 6 7 8 9 |
| GO ID | Tissue | Disease Stage | Description | Gene Ratio | Bg Ratio | pvalue | p.adjust | Count |
| GO:0010498111 | Esophagus | ESCC | proteasomal protein catabolic process | 369/8552 | 490/18723 | 1.13e-41 | 1.80e-38 | 369 |
| GO:0043161111 | Esophagus | ESCC | proteasome-mediated ubiquitin-dependent protein catabolic process | 312/8552 | 412/18723 | 3.53e-36 | 4.48e-33 | 312 |
| GO:0034976111 | Esophagus | ESCC | response to endoplasmic reticulum stress | 192/8552 | 256/18723 | 7.15e-22 | 1.30e-19 | 192 |
| GO:0035966111 | Esophagus | ESCC | response to topologically incorrect protein | 125/8552 | 159/18723 | 1.44e-17 | 1.27e-15 | 125 |
| GO:0006986111 | Esophagus | ESCC | response to unfolded protein | 107/8552 | 137/18723 | 7.01e-15 | 3.87e-13 | 107 |
| GO:003650315 | Esophagus | ESCC | ERAD pathway | 82/8552 | 107/18723 | 5.80e-11 | 1.84e-09 | 82 |
| GO:003043314 | Esophagus | ESCC | ubiquitin-dependent ERAD pathway | 66/8552 | 85/18723 | 1.64e-09 | 3.78e-08 | 66 |
| GO:00091002 | Esophagus | ESCC | glycoprotein metabolic process | 226/8552 | 387/18723 | 2.64e-07 | 3.94e-06 | 226 |
| GO:00700854 | Esophagus | ESCC | glycosylation | 144/8552 | 240/18723 | 5.12e-06 | 5.38e-05 | 144 |
| GO:00064865 | Esophagus | ESCC | protein glycosylation | 135/8552 | 226/18723 | 1.36e-05 | 1.24e-04 | 135 |
| GO:00434135 | Esophagus | ESCC | macromolecule glycosylation | 135/8552 | 226/18723 | 1.36e-05 | 1.24e-04 | 135 |
| GO:00091012 | Esophagus | ESCC | glycoprotein biosynthetic process | 181/8552 | 317/18723 | 2.54e-05 | 2.15e-04 | 181 |
| GO:19011362 | Esophagus | ESCC | carbohydrate derivative catabolic process | 99/8552 | 172/18723 | 1.11e-03 | 5.54e-03 | 99 |
| GO:00065173 | Esophagus | ESCC | protein deglycosylation | 19/8552 | 26/18723 | 4.31e-03 | 1.71e-02 | 19 |
| GO:0006516 | Esophagus | ESCC | glycoprotein catabolic process | 19/8552 | 28/18723 | 1.49e-02 | 4.84e-02 | 19 |
| GO:00431617 | Liver | NAFLD | proteasome-mediated ubiquitin-dependent protein catabolic process | 91/1882 | 412/18723 | 3.00e-13 | 1.75e-10 | 91 |
| GO:00104987 | Liver | NAFLD | proteasomal protein catabolic process | 101/1882 | 490/18723 | 1.35e-12 | 6.09e-10 | 101 |
| GO:0006517 | Liver | NAFLD | protein deglycosylation | 9/1882 | 26/18723 | 6.56e-04 | 8.50e-03 | 9 |
| GO:0036507 | Liver | NAFLD | protein demannosylation | 6/1882 | 18/18723 | 6.55e-03 | 4.69e-02 | 6 |
| GO:0036508 | Liver | NAFLD | protein alpha-1,2-demannosylation | 6/1882 | 18/18723 | 6.55e-03 | 4.69e-02 | 6 |
| Page: 1 2 3 4 |
| Pathway ID | Tissue | Disease Stage | Description | Gene Ratio | Bg Ratio | pvalue | p.adjust | qvalue | Count |
| hsa04141211 | Esophagus | ESCC | Protein processing in endoplasmic reticulum | 147/4205 | 174/8465 | 3.29e-22 | 1.10e-19 | 5.64e-20 | 147 |
| hsa04141310 | Esophagus | ESCC | Protein processing in endoplasmic reticulum | 147/4205 | 174/8465 | 3.29e-22 | 1.10e-19 | 5.64e-20 | 147 |
| hsa0414122 | Liver | HCC | Protein processing in endoplasmic reticulum | 146/4020 | 174/8465 | 7.34e-24 | 2.46e-21 | 1.37e-21 | 146 |
| hsa0414132 | Liver | HCC | Protein processing in endoplasmic reticulum | 146/4020 | 174/8465 | 7.34e-24 | 2.46e-21 | 1.37e-21 | 146 |
| hsa0414128 | Prostate | BPH | Protein processing in endoplasmic reticulum | 97/1718 | 174/8465 | 2.37e-25 | 1.30e-23 | 8.07e-24 | 97 |
| hsa04141112 | Prostate | BPH | Protein processing in endoplasmic reticulum | 97/1718 | 174/8465 | 2.37e-25 | 1.30e-23 | 8.07e-24 | 97 |
| hsa0414129 | Prostate | Tumor | Protein processing in endoplasmic reticulum | 99/1791 | 174/8465 | 2.58e-25 | 1.71e-23 | 1.06e-23 | 99 |
| hsa0414137 | Prostate | Tumor | Protein processing in endoplasmic reticulum | 99/1791 | 174/8465 | 2.58e-25 | 1.71e-23 | 1.06e-23 | 99 |
| Page: 1 |
Top |
Cell-cell communication analysis |
| Identification of potential cell-cell interactions between two cell types and their ligand-receptor pairs for different disease states |
| Ligand | Receptor | LRpair | Pathway | Tissue | Disease Stage |
| Page: 1 |
Top |
Single-cell gene regulatory network inference analysis |
| Find out the significant the regulons (TFs) and the target genes of each regulon across cell types for different disease states |
| TF | Cell Type | Tissue | Disease Stage | Target Gene | RSS | Regulon Activity |
| ∗The dot plots of a searched regulon are shown for all cell subpopulations in each disease state of each tissue based on the regulon specific score inferred using pySCENIC and by calculating the average expression. |
| Page: 1 |
Top |
Somatic mutation of malignant transformation related genes |
| Annotation of somatic variants for genes involved in malignant transformation |
| Hugo Symbol | Variant Class | Variant Classification | dbSNP RS | HGVSc | HGVSp | HGVSp Short | SWISSPROT | BIOTYPE | SIFT | PolyPhen | Tumor Sample Barcode | Tissue | Histology | Sex | Age | Stage | Therapy Types | Drugs | Outcome |
| EDEM3 | SNV | Missense_Mutation | rs201554031 | c.2720T>C | p.Val907Ala | p.V907A | Q9BZQ6 | protein_coding | tolerated_low_confidence(0.77) | benign(0) | TCGA-A2-A1FW-01 | Breast | breast invasive carcinoma | Female | <65 | III/IV | Chemotherapy | cytoxan | SD |
| EDEM3 | SNV | Missense_Mutation | rs201554031 | c.2720N>C | p.Val907Ala | p.V907A | Q9BZQ6 | protein_coding | tolerated_low_confidence(0.77) | benign(0) | TCGA-A2-A1G0-01 | Breast | breast invasive carcinoma | Female | <65 | I/II | Chemotherapy | taxotere | SD |
| EDEM3 | SNV | Missense_Mutation | rs201554031 | c.2720T>C | p.Val907Ala | p.V907A | Q9BZQ6 | protein_coding | tolerated_low_confidence(0.77) | benign(0) | TCGA-A2-A1G4-01 | Breast | breast invasive carcinoma | Female | >=65 | III/IV | Chemotherapy | adriamycin | SD |
| EDEM3 | SNV | Missense_Mutation | rs201554031 | c.2720T>C | p.Val907Ala | p.V907A | Q9BZQ6 | protein_coding | tolerated_low_confidence(0.77) | benign(0) | TCGA-A2-A25A-01 | Breast | breast invasive carcinoma | Female | <65 | I/II | Unspecific | Cytoxan | SD |
| EDEM3 | SNV | Missense_Mutation | rs745987472 | c.1943N>A | p.Arg648Gln | p.R648Q | Q9BZQ6 | protein_coding | tolerated(0.27) | benign(0.079) | TCGA-A7-A26E-01 | Breast | breast invasive carcinoma | Female | >=65 | III/IV | Chemotherapy | cytoxan | SD |
| EDEM3 | SNV | Missense_Mutation | rs201554031 | c.2720T>C | p.Val907Ala | p.V907A | Q9BZQ6 | protein_coding | tolerated_low_confidence(0.77) | benign(0) | TCGA-A8-A06R-01 | Breast | breast invasive carcinoma | Female | >=65 | I/II | Chemotherapy | 5-fluorouracil | CR |
| EDEM3 | SNV | Missense_Mutation | novel | c.391T>G | p.Leu131Val | p.L131V | Q9BZQ6 | protein_coding | tolerated(0.64) | benign(0.001) | TCGA-AN-A046-01 | Breast | breast invasive carcinoma | Female | >=65 | I/II | Unknown | Unknown | SD |
| EDEM3 | SNV | Missense_Mutation | rs201554031 | c.2720T>C | p.Val907Ala | p.V907A | Q9BZQ6 | protein_coding | tolerated_low_confidence(0.77) | benign(0) | TCGA-AO-A1KP-01 | Breast | breast invasive carcinoma | Female | >=65 | I/II | Chemotherapy | fluorouracil | SD |
| EDEM3 | SNV | Missense_Mutation | rs201554031 | c.2720N>C | p.Val907Ala | p.V907A | Q9BZQ6 | protein_coding | tolerated_low_confidence(0.77) | benign(0) | TCGA-AQ-A1H3-01 | Breast | breast invasive carcinoma | Female | <65 | III/IV | Chemotherapy | adriamycin | SD |
| EDEM3 | SNV | Missense_Mutation | rs201554031 | c.2720N>C | p.Val907Ala | p.V907A | Q9BZQ6 | protein_coding | tolerated_low_confidence(0.77) | benign(0) | TCGA-AR-A1AP-01 | Breast | breast invasive carcinoma | Female | >=65 | I/II | Hormone Therapy | anastrozole | SD |
| Page: 1 2 3 4 5 6 7 8 9 10 11 |
Top |
Related drugs of malignant transformation related genes |
| Identification of chemicals and drugs interact with genes involved in malignant transfromation |
| (DGIdb 4.0) |
| Entrez ID | Symbol | Category | Interaction Types | Drug Claim Name | Drug Name | PMIDs |
| Page: 1 |

Copyright 2023-Present -The University of Texas Health Science Center at Houston |