
|
|||||
|
 | |
| |
| |
| |
| |
| |
|
Gene: EDEM1 |
Gene summary for EDEM1 |
| Gene information | Species | Human | Gene symbol | EDEM1 | Gene ID | 9695 |
| Gene name | ER degradation enhancing alpha-mannosidase like protein 1 | |
| Gene Alias | EDEM | |
| Cytomap | 3p26.1 | |
| Gene Type | protein-coding | GO ID | GO:0005975 | UniProtAcc | A0A024R2D5 |
Top |
Malignant transformation analysis |
| Identification of the aberrant gene expression in precancerous and cancerous lesions by comparing the gene expression of stem-like cells in diseased tissues with normal stem cells |
| Entrez ID | Symbol | Replicates | Species | Organ | Tissue | Adj P-value | Log2FC | Malignancy |
| 9695 | EDEM1 | NAFLD1 | Human | Liver | NAFLD | 3.45e-05 | 4.80e-01 | -0.04 |
| 9695 | EDEM1 | S43 | Human | Liver | Cirrhotic | 5.09e-03 | 2.25e-02 | -0.0187 |
| 9695 | EDEM1 | HCC1_Meng | Human | Liver | HCC | 7.74e-39 | 2.63e-02 | 0.0246 |
| 9695 | EDEM1 | HCC2_Meng | Human | Liver | HCC | 5.15e-03 | -7.52e-02 | 0.0107 |
| 9695 | EDEM1 | HCC2 | Human | Liver | HCC | 6.31e-07 | 2.70e+00 | 0.5341 |
| 9695 | EDEM1 | S015 | Human | Liver | HCC | 1.59e-02 | 2.98e-01 | 0.2375 |
| 9695 | EDEM1 | S027 | Human | Liver | HCC | 2.79e-07 | 7.16e-01 | 0.2446 |
| 9695 | EDEM1 | S028 | Human | Liver | HCC | 8.50e-22 | 9.57e-01 | 0.2503 |
| 9695 | EDEM1 | S029 | Human | Liver | HCC | 1.74e-18 | 9.00e-01 | 0.2581 |
| 9695 | EDEM1 | C21 | Human | Oral cavity | OSCC | 1.11e-04 | 2.13e-01 | 0.2678 |
| 9695 | EDEM1 | C30 | Human | Oral cavity | OSCC | 3.23e-23 | 9.16e-01 | 0.3055 |
| 9695 | EDEM1 | C51 | Human | Oral cavity | OSCC | 1.81e-12 | 4.31e-01 | 0.2674 |
| 9695 | EDEM1 | C57 | Human | Oral cavity | OSCC | 1.30e-15 | 5.51e-01 | 0.1679 |
| 9695 | EDEM1 | C08 | Human | Oral cavity | OSCC | 6.29e-04 | 1.28e-01 | 0.1919 |
| 9695 | EDEM1 | C09 | Human | Oral cavity | OSCC | 1.36e-02 | 1.40e-01 | 0.1431 |
| 9695 | EDEM1 | LN46 | Human | Oral cavity | OSCC | 2.03e-04 | 2.00e-01 | 0.1666 |
| 9695 | EDEM1 | EOLP-1 | Human | Oral cavity | EOLP | 4.13e-06 | 3.31e-01 | -0.0202 |
| 9695 | EDEM1 | SYSMH1 | Human | Oral cavity | OSCC | 1.24e-02 | 1.25e-01 | 0.1127 |
| 9695 | EDEM1 | SYSMH3 | Human | Oral cavity | OSCC | 2.54e-07 | 2.44e-01 | 0.2442 |
| 9695 | EDEM1 | SYSMH6 | Human | Oral cavity | OSCC | 4.61e-06 | 9.86e-02 | 0.1275 |
| Page: 1 2 |
| Tissue | Expression Dynamics | Abbreviation |
| Liver |  | HCC: Hepatocellular carcinoma |
| NAFLD: Non-alcoholic fatty liver disease | ||
| Oral Cavity | 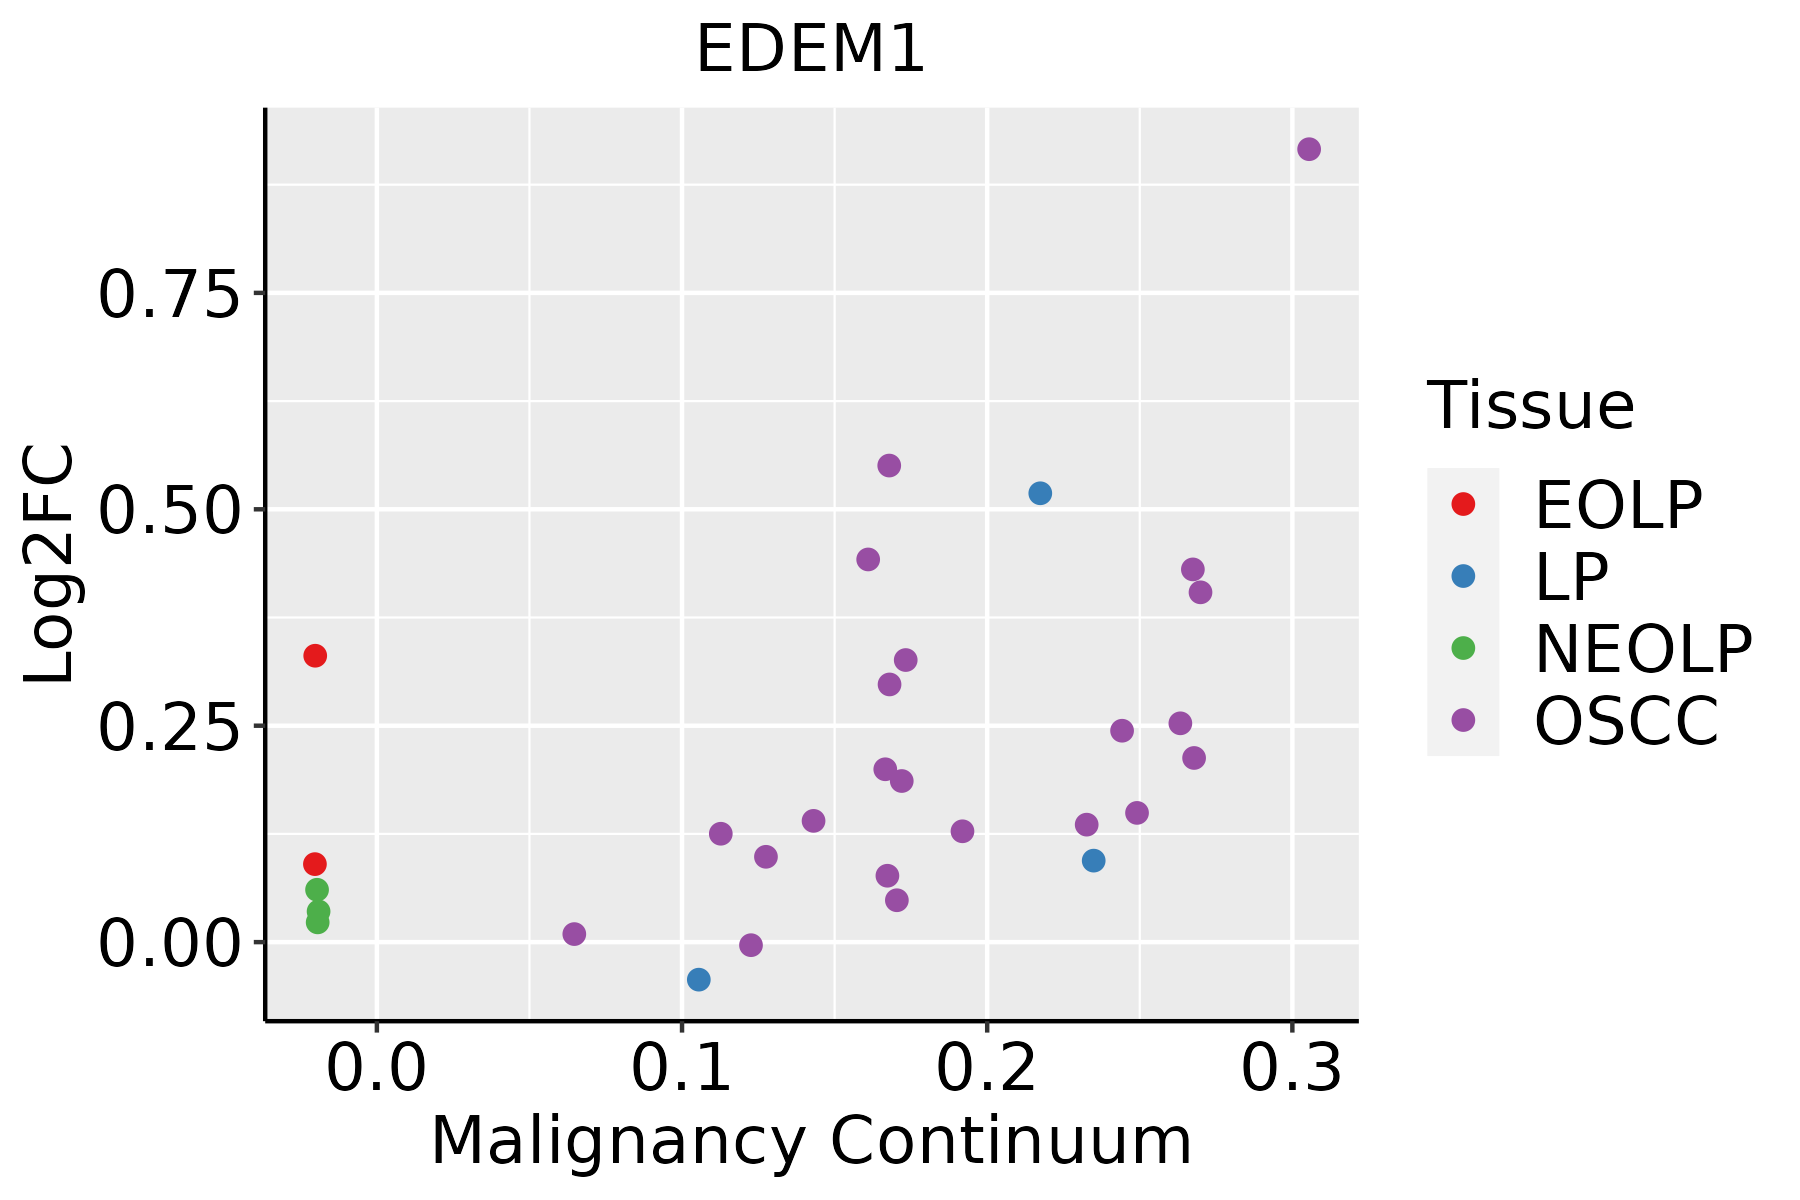 | EOLP: Erosive Oral lichen planus |
| LP: leukoplakia | ||
| NEOLP: Non-erosive oral lichen planus | ||
| OSCC: Oral squamous cell carcinoma | ||
| Thyroid |  | ATC: Anaplastic thyroid cancer |
| HT: Hashimoto's thyroiditis | ||
| PTC: Papillary thyroid cancer |
| ∗log2FC in expression of this searched gene in stem-like cells from each diseased tissue sample relative to stem-like cells in normal samples in each tissue plotted against the malignancy continuum. Samples are colored based on if they are from different disease stage. |
Top |
Malignant transformation related pathway analysis |
| Find out the enriched GO biological processes and KEGG pathways involved in transition from healthy to precancer to cancer |
| Tissue | Disease Stage | Enriched GO biological Processes |
| Colorectum | AD |  |
| Colorectum | SER |  |
| Colorectum | MSS |  |
| Colorectum | MSI-H |  |
| Colorectum | FAP |  |
| ∗Top 15 enriched GO BP terms are showed in the bar plot of each disease state in each tissue. Each row represents a significant GO biological process which is colored according to the -log10(p.adjust). |
| Page: 1 2 3 4 5 6 7 8 9 |
| GO ID | Tissue | Disease Stage | Description | Gene Ratio | Bg Ratio | pvalue | p.adjust | Count |
| GO:00431617 | Liver | NAFLD | proteasome-mediated ubiquitin-dependent protein catabolic process | 91/1882 | 412/18723 | 3.00e-13 | 1.75e-10 | 91 |
| GO:00104987 | Liver | NAFLD | proteasomal protein catabolic process | 101/1882 | 490/18723 | 1.35e-12 | 6.09e-10 | 101 |
| GO:00512227 | Liver | NAFLD | positive regulation of protein transport | 55/1882 | 303/18723 | 1.07e-05 | 3.35e-04 | 55 |
| GO:19049517 | Liver | NAFLD | positive regulation of establishment of protein localization | 55/1882 | 319/18723 | 4.79e-05 | 1.14e-03 | 55 |
| GO:0006517 | Liver | NAFLD | protein deglycosylation | 9/1882 | 26/18723 | 6.56e-04 | 8.50e-03 | 9 |
| GO:00903166 | Liver | NAFLD | positive regulation of intracellular protein transport | 29/1882 | 160/18723 | 1.24e-03 | 1.41e-02 | 29 |
| GO:00725947 | Liver | NAFLD | establishment of protein localization to organelle | 62/1882 | 422/18723 | 1.48e-03 | 1.64e-02 | 62 |
| GO:00325273 | Liver | NAFLD | protein exit from endoplasmic reticulum | 12/1882 | 48/18723 | 2.30e-03 | 2.19e-02 | 12 |
| GO:00331576 | Liver | NAFLD | regulation of intracellular protein transport | 37/1882 | 229/18723 | 2.55e-03 | 2.36e-02 | 37 |
| GO:0070861 | Liver | NAFLD | regulation of protein exit from endoplasmic reticulum | 8/1882 | 27/18723 | 3.97e-03 | 3.34e-02 | 8 |
| GO:00323866 | Liver | NAFLD | regulation of intracellular transport | 49/1882 | 337/18723 | 5.34e-03 | 4.11e-02 | 49 |
| GO:00323886 | Liver | NAFLD | positive regulation of intracellular transport | 32/1882 | 202/18723 | 6.42e-03 | 4.69e-02 | 32 |
| GO:0036507 | Liver | NAFLD | protein demannosylation | 6/1882 | 18/18723 | 6.55e-03 | 4.69e-02 | 6 |
| GO:0036508 | Liver | NAFLD | protein alpha-1,2-demannosylation | 6/1882 | 18/18723 | 6.55e-03 | 4.69e-02 | 6 |
| GO:001049812 | Liver | Cirrhotic | proteasomal protein catabolic process | 216/4634 | 490/18723 | 2.52e-21 | 9.29e-19 | 216 |
| GO:007259412 | Liver | Cirrhotic | establishment of protein localization to organelle | 189/4634 | 422/18723 | 1.01e-19 | 2.45e-17 | 189 |
| GO:00349767 | Liver | Cirrhotic | response to endoplasmic reticulum stress | 130/4634 | 256/18723 | 1.72e-19 | 3.86e-17 | 130 |
| GO:004316112 | Liver | Cirrhotic | proteasome-mediated ubiquitin-dependent protein catabolic process | 184/4634 | 412/18723 | 4.52e-19 | 8.85e-17 | 184 |
| GO:00359667 | Liver | Cirrhotic | response to topologically incorrect protein | 91/4634 | 159/18723 | 2.07e-18 | 3.60e-16 | 91 |
| GO:00066057 | Liver | Cirrhotic | protein targeting | 148/4634 | 314/18723 | 3.86e-18 | 6.20e-16 | 148 |
| Page: 1 2 3 4 5 6 7 8 9 |
| Pathway ID | Tissue | Disease Stage | Description | Gene Ratio | Bg Ratio | pvalue | p.adjust | qvalue | Count |
| hsa0414114 | Liver | Cirrhotic | Protein processing in endoplasmic reticulum | 114/2530 | 174/8465 | 1.16e-22 | 9.67e-21 | 5.96e-21 | 114 |
| hsa0414115 | Liver | Cirrhotic | Protein processing in endoplasmic reticulum | 114/2530 | 174/8465 | 1.16e-22 | 9.67e-21 | 5.96e-21 | 114 |
| hsa0414122 | Liver | HCC | Protein processing in endoplasmic reticulum | 146/4020 | 174/8465 | 7.34e-24 | 2.46e-21 | 1.37e-21 | 146 |
| hsa0414132 | Liver | HCC | Protein processing in endoplasmic reticulum | 146/4020 | 174/8465 | 7.34e-24 | 2.46e-21 | 1.37e-21 | 146 |
| hsa0414130 | Oral cavity | OSCC | Protein processing in endoplasmic reticulum | 143/3704 | 174/8465 | 6.82e-26 | 2.28e-23 | 1.16e-23 | 143 |
| hsa04141113 | Oral cavity | OSCC | Protein processing in endoplasmic reticulum | 143/3704 | 174/8465 | 6.82e-26 | 2.28e-23 | 1.16e-23 | 143 |
| hsa0414145 | Oral cavity | EOLP | Protein processing in endoplasmic reticulum | 70/1218 | 174/8465 | 2.84e-17 | 3.06e-15 | 1.81e-15 | 70 |
| hsa0414155 | Oral cavity | EOLP | Protein processing in endoplasmic reticulum | 70/1218 | 174/8465 | 2.84e-17 | 3.06e-15 | 1.81e-15 | 70 |
| Page: 1 |
Top |
Cell-cell communication analysis |
| Identification of potential cell-cell interactions between two cell types and their ligand-receptor pairs for different disease states |
| Ligand | Receptor | LRpair | Pathway | Tissue | Disease Stage |
| Page: 1 |
Top |
Single-cell gene regulatory network inference analysis |
| Find out the significant the regulons (TFs) and the target genes of each regulon across cell types for different disease states |
| TF | Cell Type | Tissue | Disease Stage | Target Gene | RSS | Regulon Activity |
| ∗The dot plots of a searched regulon are shown for all cell subpopulations in each disease state of each tissue based on the regulon specific score inferred using pySCENIC and by calculating the average expression. |
| Page: 1 |
Top |
Somatic mutation of malignant transformation related genes |
| Annotation of somatic variants for genes involved in malignant transformation |
| Hugo Symbol | Variant Class | Variant Classification | dbSNP RS | HGVSc | HGVSp | HGVSp Short | SWISSPROT | BIOTYPE | SIFT | PolyPhen | Tumor Sample Barcode | Tissue | Histology | Sex | Age | Stage | Therapy Types | Drugs | Outcome |
| EDEM1 | SNV | Missense_Mutation | c.1607N>G | p.His536Arg | p.H536R | Q92611 | protein_coding | deleterious(0.03) | possibly_damaging(0.636) | TCGA-A8-A08J-01 | Breast | breast invasive carcinoma | Female | <65 | III/IV | Unknown | Unknown | PD | |
| EDEM1 | SNV | Missense_Mutation | c.775N>A | p.Glu259Lys | p.E259K | Q92611 | protein_coding | deleterious(0.01) | benign(0.213) | TCGA-A8-A0A7-01 | Breast | breast invasive carcinoma | Female | <65 | I/II | Unknown | Unknown | SD | |
| EDEM1 | SNV | Missense_Mutation | c.1643N>C | p.Ser548Thr | p.S548T | Q92611 | protein_coding | deleterious(0) | probably_damaging(0.953) | TCGA-AR-A1AO-01 | Breast | breast invasive carcinoma | Female | <65 | I/II | Chemotherapy | doxorubicin | SD | |
| EDEM1 | SNV | Missense_Mutation | c.1527N>G | p.Phe509Leu | p.F509L | Q92611 | protein_coding | deleterious(0.01) | possibly_damaging(0.876) | TCGA-C5-A1M6-01 | Cervix | cervical & endocervical cancer | Female | <65 | I/II | Chemotherapy | cisplatin | PD | |
| EDEM1 | SNV | Missense_Mutation | c.85C>T | p.Pro29Ser | p.P29S | Q92611 | protein_coding | deleterious_low_confidence(0.02) | benign(0.037) | TCGA-A6-5661-01 | Colorectum | colon adenocarcinoma | Female | >=65 | I/II | Unknown | Unknown | SD | |
| EDEM1 | SNV | Missense_Mutation | c.791N>G | p.Ala264Gly | p.A264G | Q92611 | protein_coding | deleterious(0.01) | probably_damaging(0.992) | TCGA-AA-3864-01 | Colorectum | colon adenocarcinoma | Male | >=65 | I/II | Unknown | Unknown | SD | |
| EDEM1 | SNV | Missense_Mutation | c.1700C>A | p.Pro567Gln | p.P567Q | Q92611 | protein_coding | deleterious(0.01) | probably_damaging(0.969) | TCGA-AA-A01Z-01 | Colorectum | colon adenocarcinoma | Male | >=65 | I/II | Unknown | Unknown | PD | |
| EDEM1 | SNV | Missense_Mutation | novel | c.1193N>T | p.Ser398Ile | p.S398I | Q92611 | protein_coding | deleterious(0.01) | possibly_damaging(0.781) | TCGA-AZ-4315-01 | Colorectum | colon adenocarcinoma | Male | <65 | I/II | Unknown | Unknown | SD |
| EDEM1 | SNV | Missense_Mutation | novel | c.1211N>T | p.Arg404Ile | p.R404I | Q92611 | protein_coding | deleterious(0) | possibly_damaging(0.886) | TCGA-CA-6717-01 | Colorectum | colon adenocarcinoma | Male | <65 | I/II | Chemotherapy | oxaliplatin | CR |
| EDEM1 | SNV | Missense_Mutation | c.817N>G | p.Pro273Ala | p.P273A | Q92611 | protein_coding | deleterious(0) | probably_damaging(0.933) | TCGA-CK-5912-01 | Colorectum | colon adenocarcinoma | Male | >=65 | I/II | Unknown | Unknown | SD |
| Page: 1 2 3 4 5 |
Top |
Related drugs of malignant transformation related genes |
| Identification of chemicals and drugs interact with genes involved in malignant transfromation |
| (DGIdb 4.0) |
| Entrez ID | Symbol | Category | Interaction Types | Drug Claim Name | Drug Name | PMIDs |
| Page: 1 |

Copyright 2023-Present -The University of Texas Health Science Center at Houston |