
|
|||||
|
 | |
| |
| |
| |
| |
| |
|
Gene: EDC4 |
Gene summary for EDC4 |
| Gene information | Species | Human | Gene symbol | EDC4 | Gene ID | 23644 |
| Gene name | enhancer of mRNA decapping 4 | |
| Gene Alias | GE1 | |
| Cytomap | 16q22.1 | |
| Gene Type | protein-coding | GO ID | GO:0000956 | UniProtAcc | Q6P2E9 |
Top |
Malignant transformation analysis |
| Identification of the aberrant gene expression in precancerous and cancerous lesions by comparing the gene expression of stem-like cells in diseased tissues with normal stem cells |
| Entrez ID | Symbol | Replicates | Species | Organ | Tissue | Adj P-value | Log2FC | Malignancy |
| 23644 | EDC4 | LZE4T | Human | Esophagus | ESCC | 1.20e-04 | 1.93e-01 | 0.0811 |
| 23644 | EDC4 | LZE7T | Human | Esophagus | ESCC | 3.98e-06 | 2.31e-01 | 0.0667 |
| 23644 | EDC4 | LZE8T | Human | Esophagus | ESCC | 1.10e-02 | 1.44e-01 | 0.067 |
| 23644 | EDC4 | LZE20T | Human | Esophagus | ESCC | 3.16e-03 | 1.42e-01 | 0.0662 |
| 23644 | EDC4 | LZE24T | Human | Esophagus | ESCC | 7.41e-13 | 3.11e-01 | 0.0596 |
| 23644 | EDC4 | LZE21T | Human | Esophagus | ESCC | 1.16e-05 | 3.22e-01 | 0.0655 |
| 23644 | EDC4 | P1T-E | Human | Esophagus | ESCC | 4.53e-14 | 4.63e-01 | 0.0875 |
| 23644 | EDC4 | P2T-E | Human | Esophagus | ESCC | 2.03e-09 | 1.70e-01 | 0.1177 |
| 23644 | EDC4 | P4T-E | Human | Esophagus | ESCC | 1.49e-09 | 2.35e-01 | 0.1323 |
| 23644 | EDC4 | P5T-E | Human | Esophagus | ESCC | 3.97e-04 | 1.23e-01 | 0.1327 |
| 23644 | EDC4 | P8T-E | Human | Esophagus | ESCC | 5.00e-17 | 3.03e-01 | 0.0889 |
| 23644 | EDC4 | P9T-E | Human | Esophagus | ESCC | 4.01e-04 | 1.29e-01 | 0.1131 |
| 23644 | EDC4 | P10T-E | Human | Esophagus | ESCC | 4.31e-06 | 1.47e-01 | 0.116 |
| 23644 | EDC4 | P11T-E | Human | Esophagus | ESCC | 2.06e-07 | 2.52e-01 | 0.1426 |
| 23644 | EDC4 | P12T-E | Human | Esophagus | ESCC | 4.40e-09 | 1.98e-01 | 0.1122 |
| 23644 | EDC4 | P15T-E | Human | Esophagus | ESCC | 1.53e-11 | 2.47e-01 | 0.1149 |
| 23644 | EDC4 | P16T-E | Human | Esophagus | ESCC | 2.02e-06 | 1.58e-01 | 0.1153 |
| 23644 | EDC4 | P17T-E | Human | Esophagus | ESCC | 4.48e-07 | 2.54e-01 | 0.1278 |
| 23644 | EDC4 | P19T-E | Human | Esophagus | ESCC | 5.57e-05 | 3.45e-01 | 0.1662 |
| 23644 | EDC4 | P20T-E | Human | Esophagus | ESCC | 3.20e-07 | 1.65e-01 | 0.1124 |
| Page: 1 2 3 4 |
| Tissue | Expression Dynamics | Abbreviation |
| Esophagus |  | ESCC: Esophageal squamous cell carcinoma |
| HGIN: High-grade intraepithelial neoplasias | ||
| LGIN: Low-grade intraepithelial neoplasias | ||
| Liver | 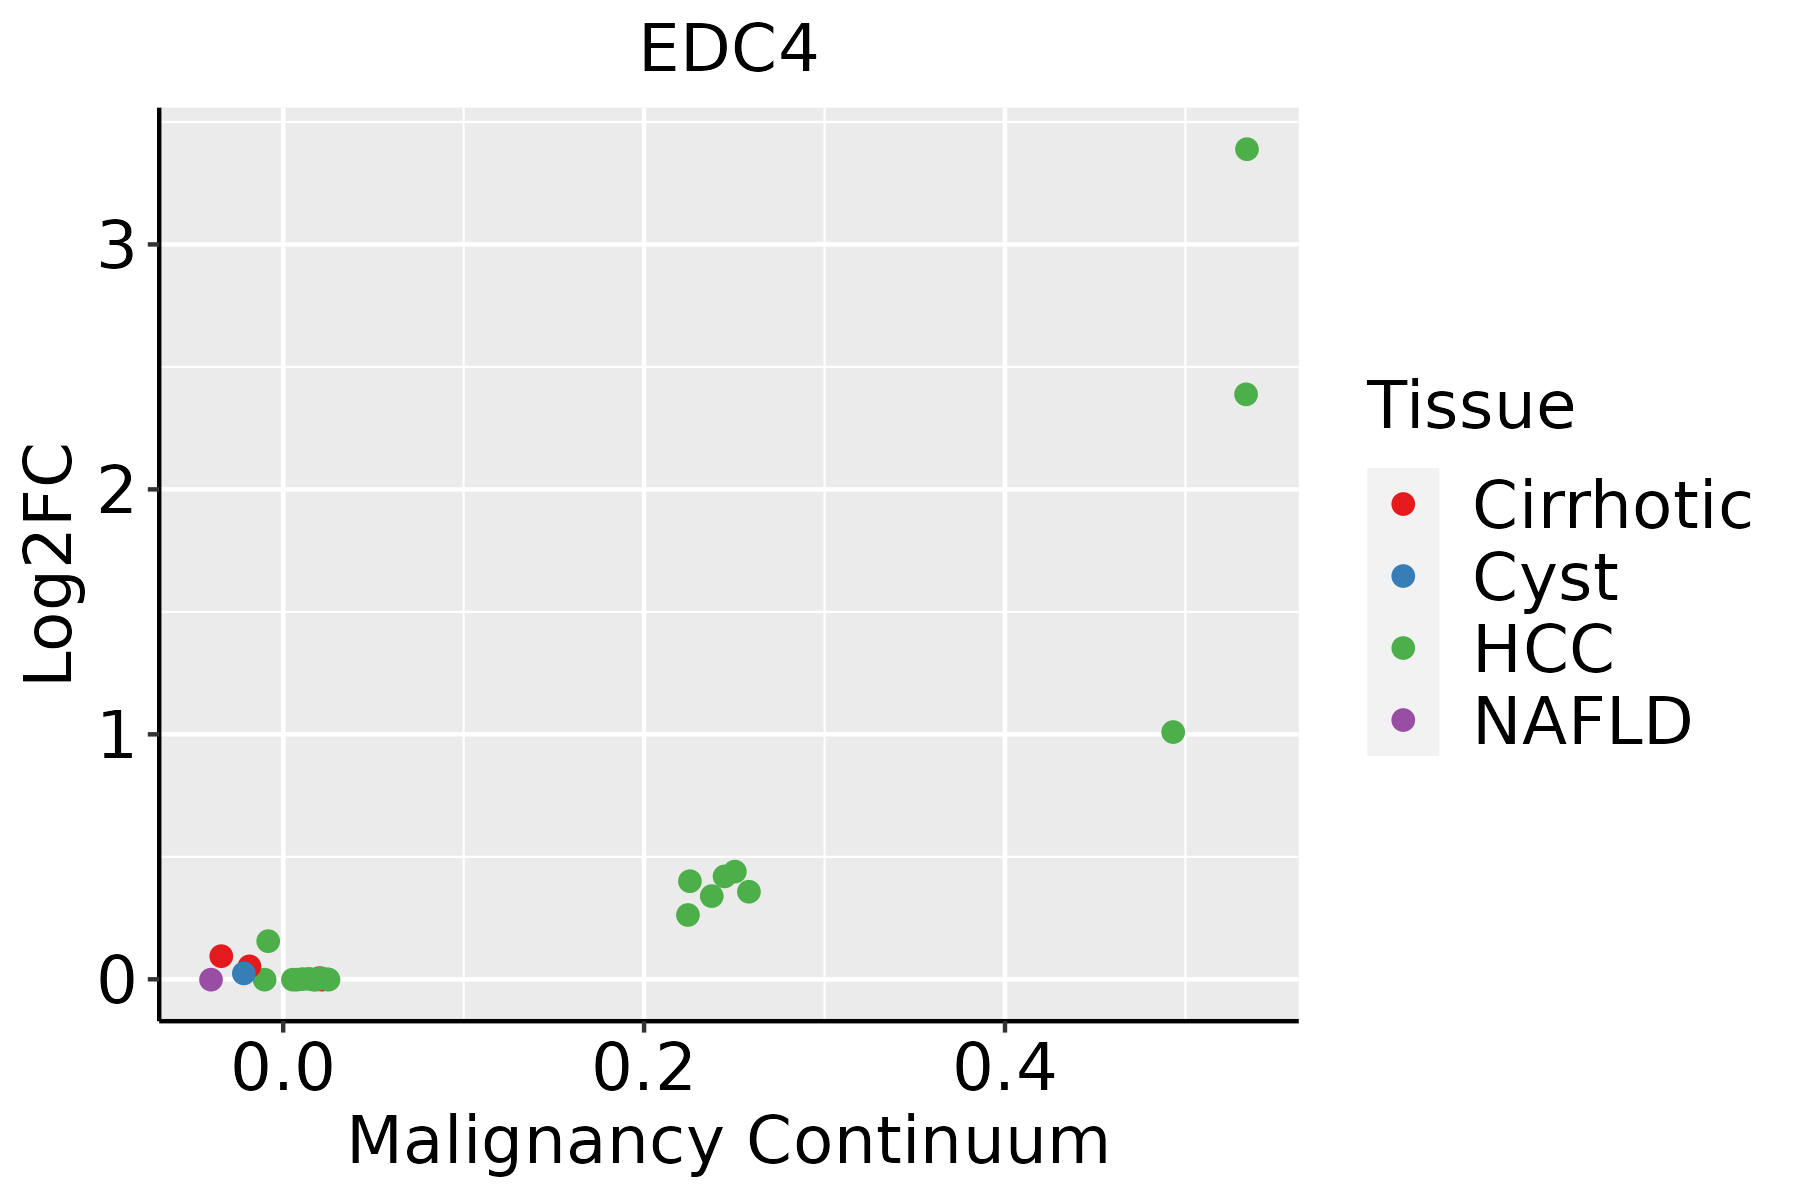 | HCC: Hepatocellular carcinoma |
| NAFLD: Non-alcoholic fatty liver disease |
| ∗log2FC in expression of this searched gene in stem-like cells from each diseased tissue sample relative to stem-like cells in normal samples in each tissue plotted against the malignancy continuum. Samples are colored based on if they are from different disease stage. |
Top |
Malignant transformation related pathway analysis |
| Find out the enriched GO biological processes and KEGG pathways involved in transition from healthy to precancer to cancer |
| Tissue | Disease Stage | Enriched GO biological Processes |
| Colorectum | AD |  |
| Colorectum | SER |  |
| Colorectum | MSS |  |
| Colorectum | MSI-H |  |
| Colorectum | FAP |  |
| ∗Top 15 enriched GO BP terms are showed in the bar plot of each disease state in each tissue. Each row represents a significant GO biological process which is colored according to the -log10(p.adjust). |
| Page: 1 2 3 4 5 6 7 8 9 |
| GO ID | Tissue | Disease Stage | Description | Gene Ratio | Bg Ratio | pvalue | p.adjust | Count |
| GO:0006401110 | Esophagus | ESCC | RNA catabolic process | 204/8552 | 278/18723 | 3.39e-21 | 5.66e-19 | 204 |
| GO:0034655110 | Esophagus | ESCC | nucleobase-containing compound catabolic process | 272/8552 | 407/18723 | 2.92e-18 | 2.90e-16 | 272 |
| GO:0006402110 | Esophagus | ESCC | mRNA catabolic process | 170/8552 | 232/18723 | 8.70e-18 | 8.00e-16 | 170 |
| GO:004670018 | Esophagus | ESCC | heterocycle catabolic process | 286/8552 | 445/18723 | 1.12e-15 | 7.47e-14 | 286 |
| GO:004427019 | Esophagus | ESCC | cellular nitrogen compound catabolic process | 288/8552 | 451/18723 | 3.03e-15 | 1.79e-13 | 288 |
| GO:001943918 | Esophagus | ESCC | aromatic compound catabolic process | 295/8552 | 467/18723 | 1.09e-14 | 5.98e-13 | 295 |
| GO:190136118 | Esophagus | ESCC | organic cyclic compound catabolic process | 307/8552 | 495/18723 | 9.99e-14 | 4.80e-12 | 307 |
| GO:000095618 | Esophagus | ESCC | nuclear-transcribed mRNA catabolic process | 88/8552 | 112/18723 | 9.41e-13 | 4.14e-11 | 88 |
| GO:00903053 | Esophagus | ESCC | nucleic acid phosphodiester bond hydrolysis | 163/8552 | 261/18723 | 3.07e-08 | 5.73e-07 | 163 |
| GO:0110154 | Esophagus | ESCC | RNA decapping | 14/8552 | 18/18723 | 5.77e-03 | 2.14e-02 | 14 |
| GO:004427021 | Liver | HCC | cellular nitrogen compound catabolic process | 303/7958 | 451/18723 | 9.76e-27 | 3.64e-24 | 303 |
| GO:004670021 | Liver | HCC | heterocycle catabolic process | 299/7958 | 445/18723 | 2.07e-26 | 7.29e-24 | 299 |
| GO:190136121 | Liver | HCC | organic cyclic compound catabolic process | 325/7958 | 495/18723 | 6.52e-26 | 2.18e-23 | 325 |
| GO:001943921 | Liver | HCC | aromatic compound catabolic process | 309/7958 | 467/18723 | 1.56e-25 | 4.94e-23 | 309 |
| GO:000640121 | Liver | HCC | RNA catabolic process | 201/7958 | 278/18723 | 3.88e-24 | 1.02e-21 | 201 |
| GO:003465521 | Liver | HCC | nucleobase-containing compound catabolic process | 273/7958 | 407/18723 | 4.84e-24 | 1.23e-21 | 273 |
| GO:000640221 | Liver | HCC | mRNA catabolic process | 169/7958 | 232/18723 | 4.50e-21 | 6.96e-19 | 169 |
| GO:000095621 | Liver | HCC | nuclear-transcribed mRNA catabolic process | 84/7958 | 112/18723 | 2.54e-12 | 1.18e-10 | 84 |
| GO:0090305 | Liver | HCC | nucleic acid phosphodiester bond hydrolysis | 152/7958 | 261/18723 | 1.90e-07 | 3.46e-06 | 152 |
| Page: 1 |
| Pathway ID | Tissue | Disease Stage | Description | Gene Ratio | Bg Ratio | pvalue | p.adjust | qvalue | Count |
| hsa0301824 | Esophagus | ESCC | RNA degradation | 62/4205 | 79/8465 | 1.18e-07 | 9.39e-07 | 4.81e-07 | 62 |
| hsa0301834 | Esophagus | ESCC | RNA degradation | 62/4205 | 79/8465 | 1.18e-07 | 9.39e-07 | 4.81e-07 | 62 |
| Page: 1 |
Top |
Cell-cell communication analysis |
| Identification of potential cell-cell interactions between two cell types and their ligand-receptor pairs for different disease states |
| Ligand | Receptor | LRpair | Pathway | Tissue | Disease Stage |
| Page: 1 |
Top |
Single-cell gene regulatory network inference analysis |
| Find out the significant the regulons (TFs) and the target genes of each regulon across cell types for different disease states |
| TF | Cell Type | Tissue | Disease Stage | Target Gene | RSS | Regulon Activity |
| ∗The dot plots of a searched regulon are shown for all cell subpopulations in each disease state of each tissue based on the regulon specific score inferred using pySCENIC and by calculating the average expression. |
| Page: 1 |
Top |
Somatic mutation of malignant transformation related genes |
| Annotation of somatic variants for genes involved in malignant transformation |
| Hugo Symbol | Variant Class | Variant Classification | dbSNP RS | HGVSc | HGVSp | HGVSp Short | SWISSPROT | BIOTYPE | SIFT | PolyPhen | Tumor Sample Barcode | Tissue | Histology | Sex | Age | Stage | Therapy Types | Drugs | Outcome |
| EDC4 | SNV | Missense_Mutation | c.4156N>T | p.Arg1386Trp | p.R1386W | Q6P2E9 | protein_coding | deleterious(0) | probably_damaging(0.983) | TCGA-A1-A0SI-01 | Breast | breast invasive carcinoma | Female | <65 | I/II | Unknown | Unknown | SD | |
| EDC4 | SNV | Missense_Mutation | novel | c.860N>G | p.Lys287Arg | p.K287R | Q6P2E9 | protein_coding | deleterious(0.01) | probably_damaging(0.953) | TCGA-A8-A06O-01 | Breast | breast invasive carcinoma | Female | <65 | I/II | Hormone Therapy | letrozole | SD |
| EDC4 | SNV | Missense_Mutation | novel | c.861N>C | p.Lys287Asn | p.K287N | Q6P2E9 | protein_coding | deleterious(0) | probably_damaging(0.979) | TCGA-A8-A06O-01 | Breast | breast invasive carcinoma | Female | <65 | I/II | Hormone Therapy | letrozole | SD |
| EDC4 | SNV | Missense_Mutation | novel | c.451G>A | p.Ala151Thr | p.A151T | Q6P2E9 | protein_coding | deleterious(0.03) | benign(0.146) | TCGA-D8-A73W-01 | Breast | breast invasive carcinoma | Female | >=65 | III/IV | Hormone Therapy | tamoxiphen | PD |
| EDC4 | SNV | Missense_Mutation | c.3639N>C | p.Glu1213Asp | p.E1213D | Q6P2E9 | protein_coding | tolerated(0.69) | benign(0) | TCGA-E2-A1B6-01 | Breast | breast invasive carcinoma | Female | <65 | I/II | Unspecific | Adriamycin | SD | |
| EDC4 | insertion | Frame_Shift_Ins | novel | c.2596_2597insGAGGGCC | p.Leu866ArgfsTer7 | p.L866Rfs*7 | Q6P2E9 | protein_coding | TCGA-A8-A0A4-01 | Breast | breast invasive carcinoma | Female | >=65 | I/II | Hormone Therapy | tamoxiphen | CR | ||
| EDC4 | insertion | Frame_Shift_Ins | novel | c.2597_2598insTGAGCCAGACAGTATGGCTTCAGCCGCCTCG | p.Gln867GlufsTer14 | p.Q867Efs*14 | Q6P2E9 | protein_coding | TCGA-A8-A0A4-01 | Breast | breast invasive carcinoma | Female | >=65 | I/II | Hormone Therapy | tamoxiphen | CR | ||
| EDC4 | SNV | Missense_Mutation | c.390G>C | p.Gln130His | p.Q130H | Q6P2E9 | protein_coding | tolerated(0.96) | benign(0.005) | TCGA-DR-A0ZM-01 | Cervix | cervical & endocervical cancer | Female | <65 | III/IV | Unspecific | Cisplatin | SD | |
| EDC4 | SNV | Missense_Mutation | novel | c.3047N>A | p.Gly1016Glu | p.G1016E | Q6P2E9 | protein_coding | tolerated(0.29) | benign(0.026) | TCGA-VS-A959-01 | Cervix | cervical & endocervical cancer | Female | >=65 | I/II | Unknown | Unknown | SD |
| EDC4 | SNV | Missense_Mutation | novel | c.3763N>T | p.Pro1255Ser | p.P1255S | Q6P2E9 | protein_coding | deleterious(0.01) | probably_damaging(0.958) | TCGA-A6-5665-01 | Colorectum | colon adenocarcinoma | Female | >=65 | I/II | Unknown | Unknown | PD |
| Page: 1 2 3 4 5 6 7 8 9 10 11 |
Top |
Related drugs of malignant transformation related genes |
| Identification of chemicals and drugs interact with genes involved in malignant transfromation |
| (DGIdb 4.0) |
| Entrez ID | Symbol | Category | Interaction Types | Drug Claim Name | Drug Name | PMIDs |
| Page: 1 |

Copyright 2023-Present -The University of Texas Health Science Center at Houston |