
|
|||||
|
 | |
| |
| |
| |
| |
| |
|
Gene: ECT2 |
Gene summary for ECT2 |
| Gene information | Species | Human | Gene symbol | ECT2 | Gene ID | 1894 |
| Gene name | epithelial cell transforming 2 | |
| Gene Alias | ARHGEF31 | |
| Cytomap | 3q26.31 | |
| Gene Type | protein-coding | GO ID | GO:0000278 | UniProtAcc | Q9H8V3 |
Top |
Malignant transformation analysis |
| Identification of the aberrant gene expression in precancerous and cancerous lesions by comparing the gene expression of stem-like cells in diseased tissues with normal stem cells |
| Entrez ID | Symbol | Replicates | Species | Organ | Tissue | Adj P-value | Log2FC | Malignancy |
| 1894 | ECT2 | CA_HPV_2 | Human | Cervix | CC | 1.63e-10 | 3.63e-01 | 0.0391 |
| 1894 | ECT2 | HSIL_HPV_2 | Human | Cervix | HSIL_HPV | 2.14e-04 | 2.37e-01 | 0.0208 |
| 1894 | ECT2 | CCI_2 | Human | Cervix | CC | 5.01e-20 | 1.99e+00 | 0.5249 |
| 1894 | ECT2 | CCI_3 | Human | Cervix | CC | 7.19e-19 | 9.38e-01 | 0.516 |
| 1894 | ECT2 | Tumor | Human | Cervix | CC | 3.12e-03 | 2.36e-01 | 0.1241 |
| 1894 | ECT2 | sample1 | Human | Cervix | CC | 3.51e-03 | 2.94e-01 | 0.0959 |
| 1894 | ECT2 | sample3 | Human | Cervix | CC | 3.24e-14 | 2.50e-01 | 0.1387 |
| 1894 | ECT2 | T1 | Human | Cervix | CC | 1.20e-02 | 2.00e-01 | 0.0918 |
| 1894 | ECT2 | T3 | Human | Cervix | CC | 4.43e-12 | 2.60e-01 | 0.1389 |
| 1894 | ECT2 | LZE2T | Human | Esophagus | ESCC | 6.82e-10 | 1.29e+00 | 0.082 |
| 1894 | ECT2 | LZE4T | Human | Esophagus | ESCC | 7.97e-07 | 2.79e-01 | 0.0811 |
| 1894 | ECT2 | LZE7T | Human | Esophagus | ESCC | 7.96e-08 | 4.88e-01 | 0.0667 |
| 1894 | ECT2 | LZE22T | Human | Esophagus | ESCC | 9.88e-03 | 2.61e-01 | 0.068 |
| 1894 | ECT2 | LZE24T | Human | Esophagus | ESCC | 2.55e-02 | 1.72e-01 | 0.0596 |
| 1894 | ECT2 | LZE21T | Human | Esophagus | ESCC | 1.61e-08 | 4.81e-01 | 0.0655 |
| 1894 | ECT2 | LZE6T | Human | Esophagus | ESCC | 2.39e-04 | 1.73e-01 | 0.0845 |
| 1894 | ECT2 | P2T-E | Human | Esophagus | ESCC | 3.98e-14 | 7.67e-01 | 0.1177 |
| 1894 | ECT2 | P4T-E | Human | Esophagus | ESCC | 1.64e-14 | 5.33e-01 | 0.1323 |
| 1894 | ECT2 | P5T-E | Human | Esophagus | ESCC | 4.20e-15 | 5.56e-01 | 0.1327 |
| 1894 | ECT2 | P8T-E | Human | Esophagus | ESCC | 1.50e-08 | 3.46e-01 | 0.0889 |
| Page: 1 2 3 4 5 6 |
| Tissue | Expression Dynamics | Abbreviation |
| Cervix |  | CC: Cervix cancer |
| HSIL_HPV: HPV-infected high-grade squamous intraepithelial lesions | ||
| N_HPV: HPV-infected normal cervix | ||
| Esophagus | 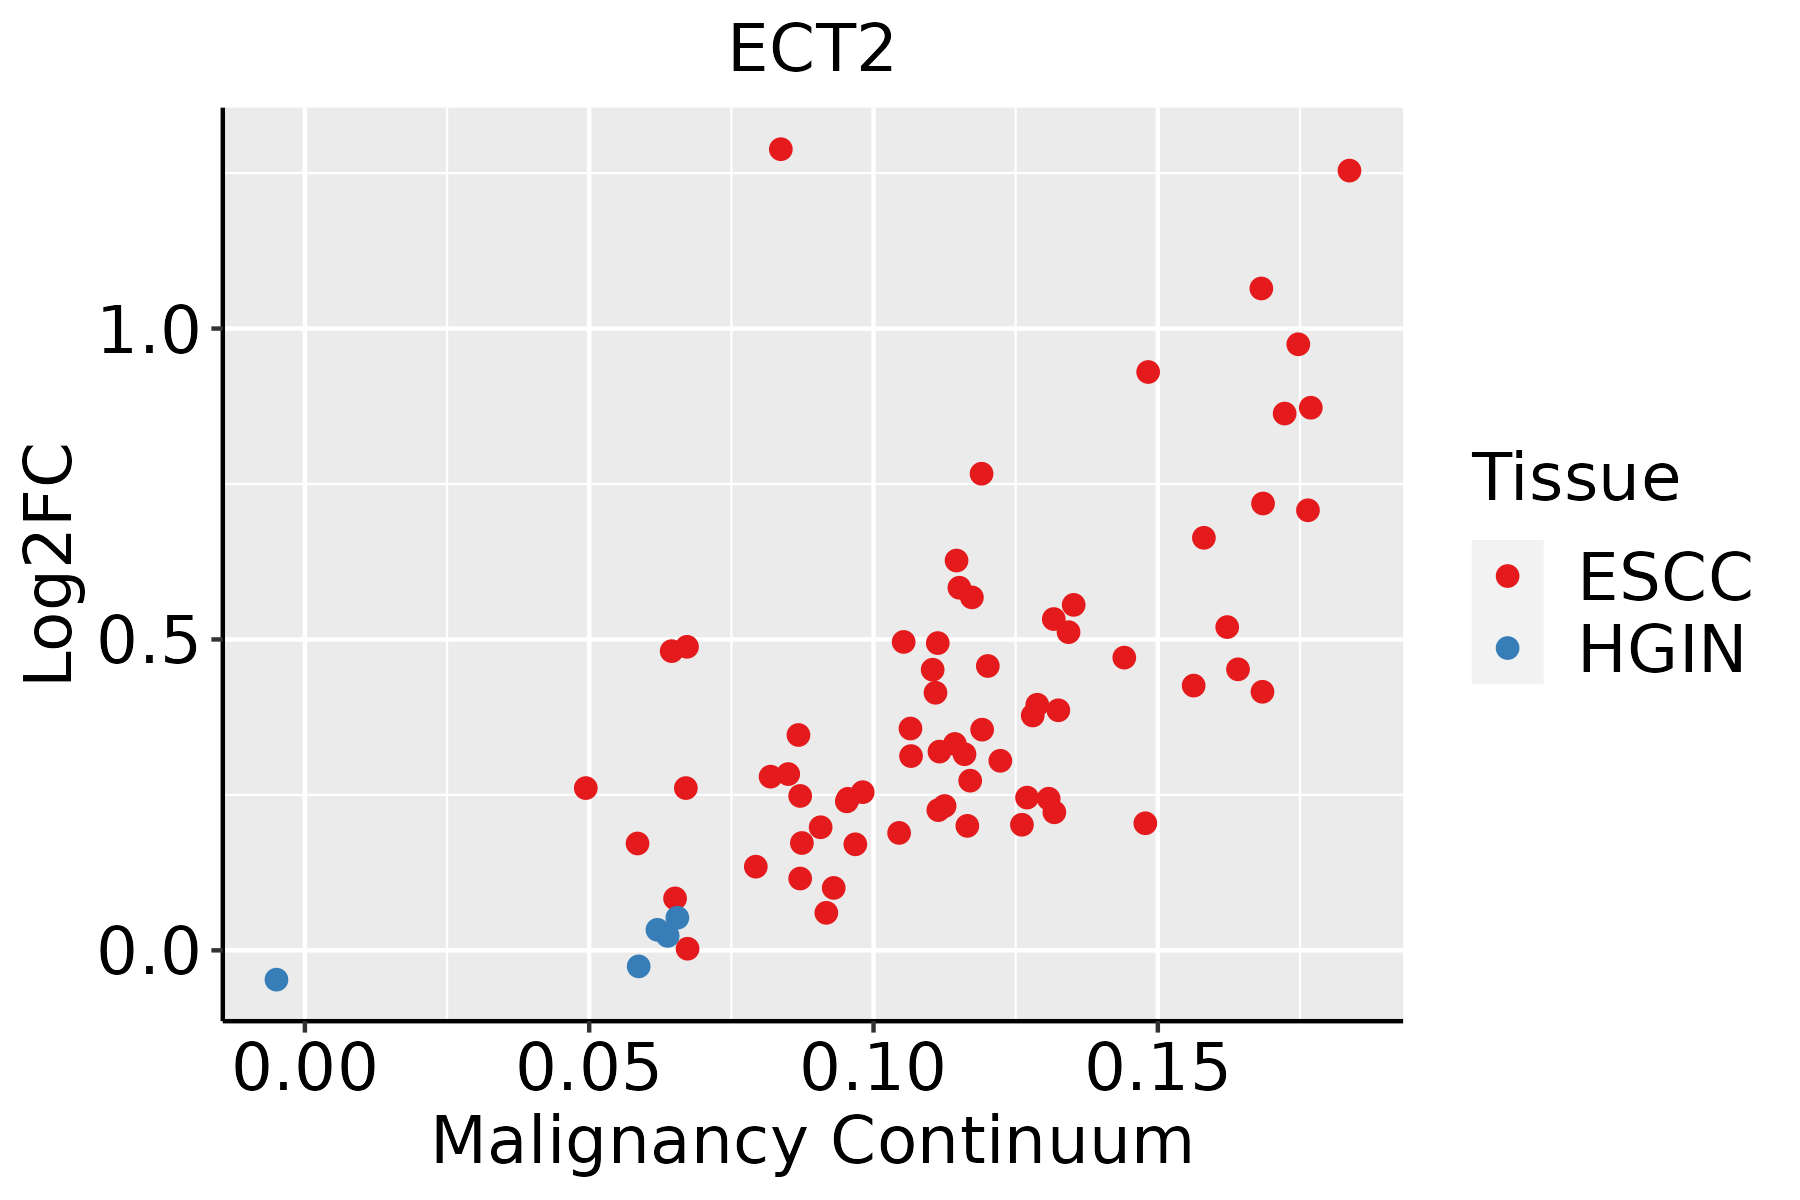 | ESCC: Esophageal squamous cell carcinoma |
| HGIN: High-grade intraepithelial neoplasias | ||
| LGIN: Low-grade intraepithelial neoplasias | ||
| Liver | 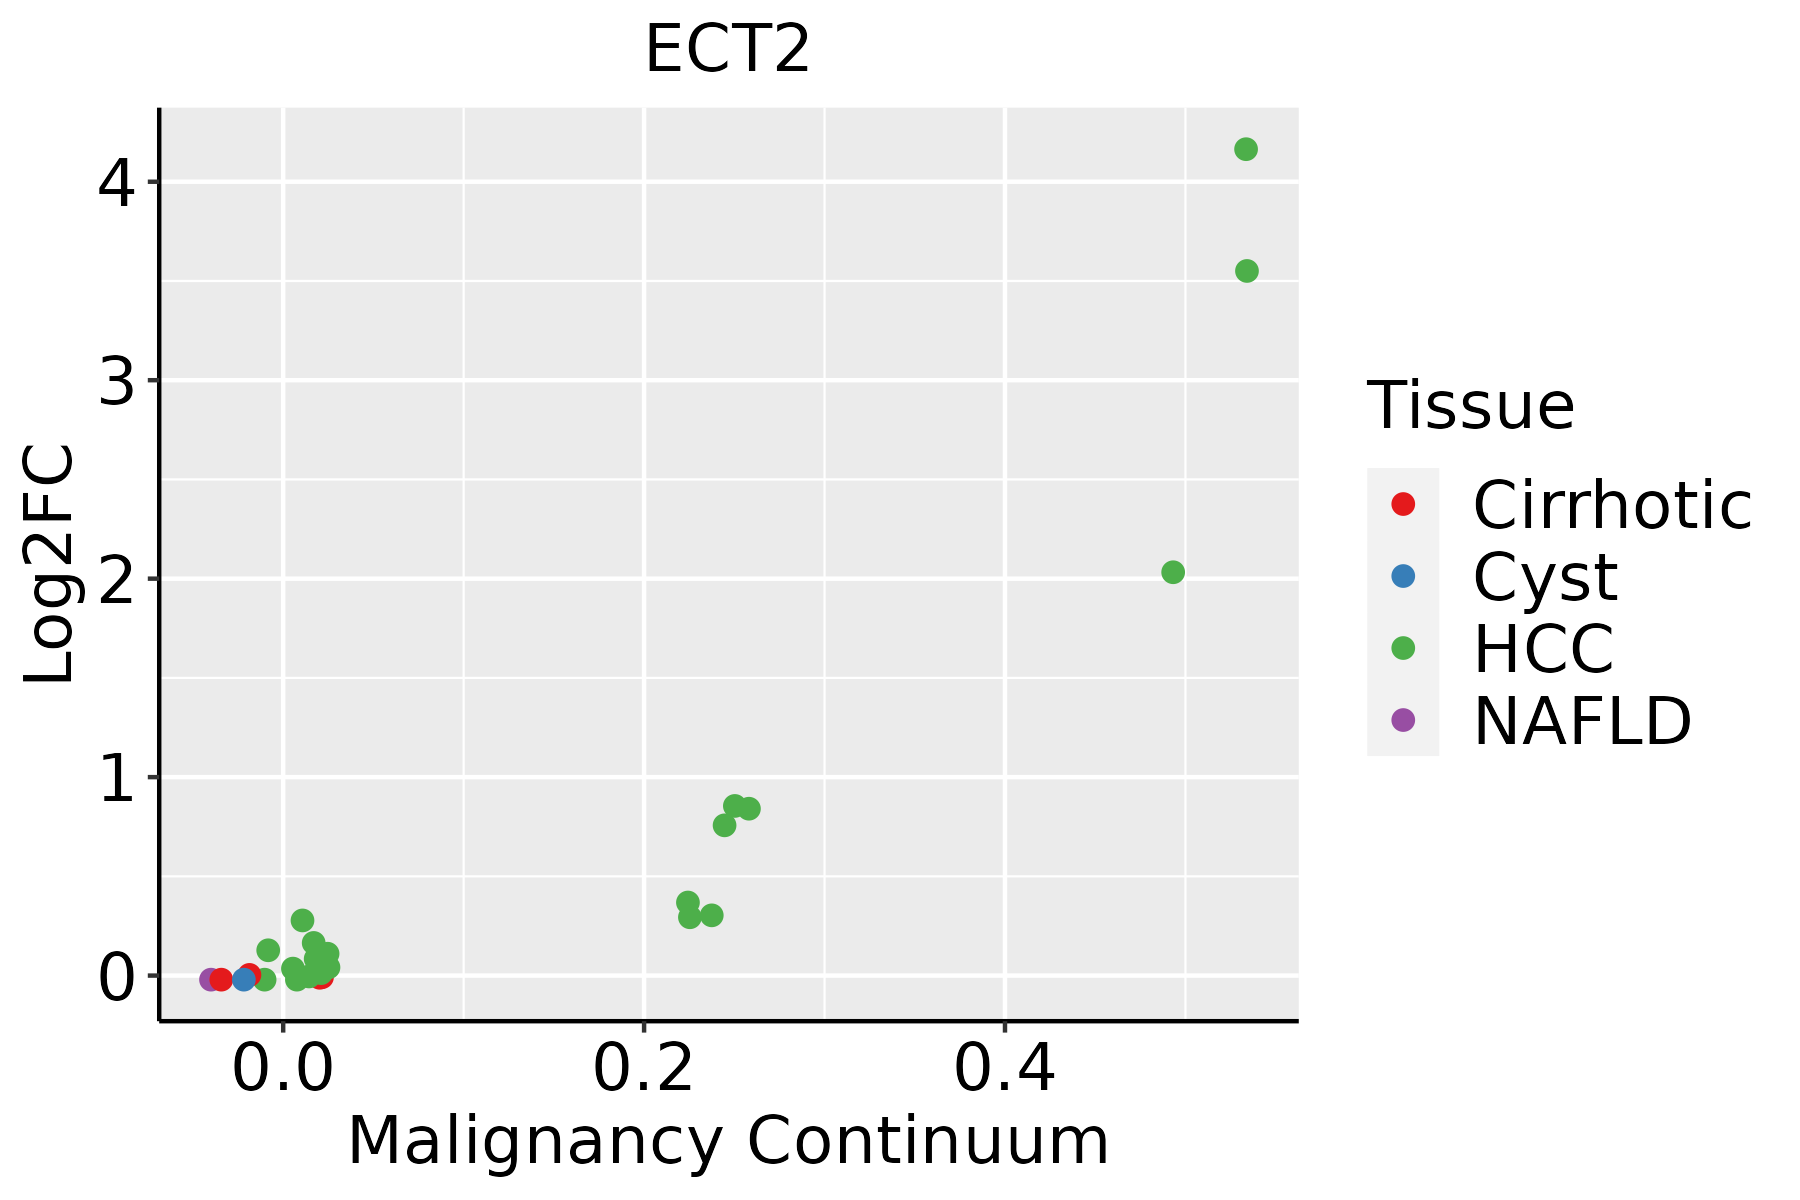 | HCC: Hepatocellular carcinoma |
| NAFLD: Non-alcoholic fatty liver disease | ||
| Oral Cavity | 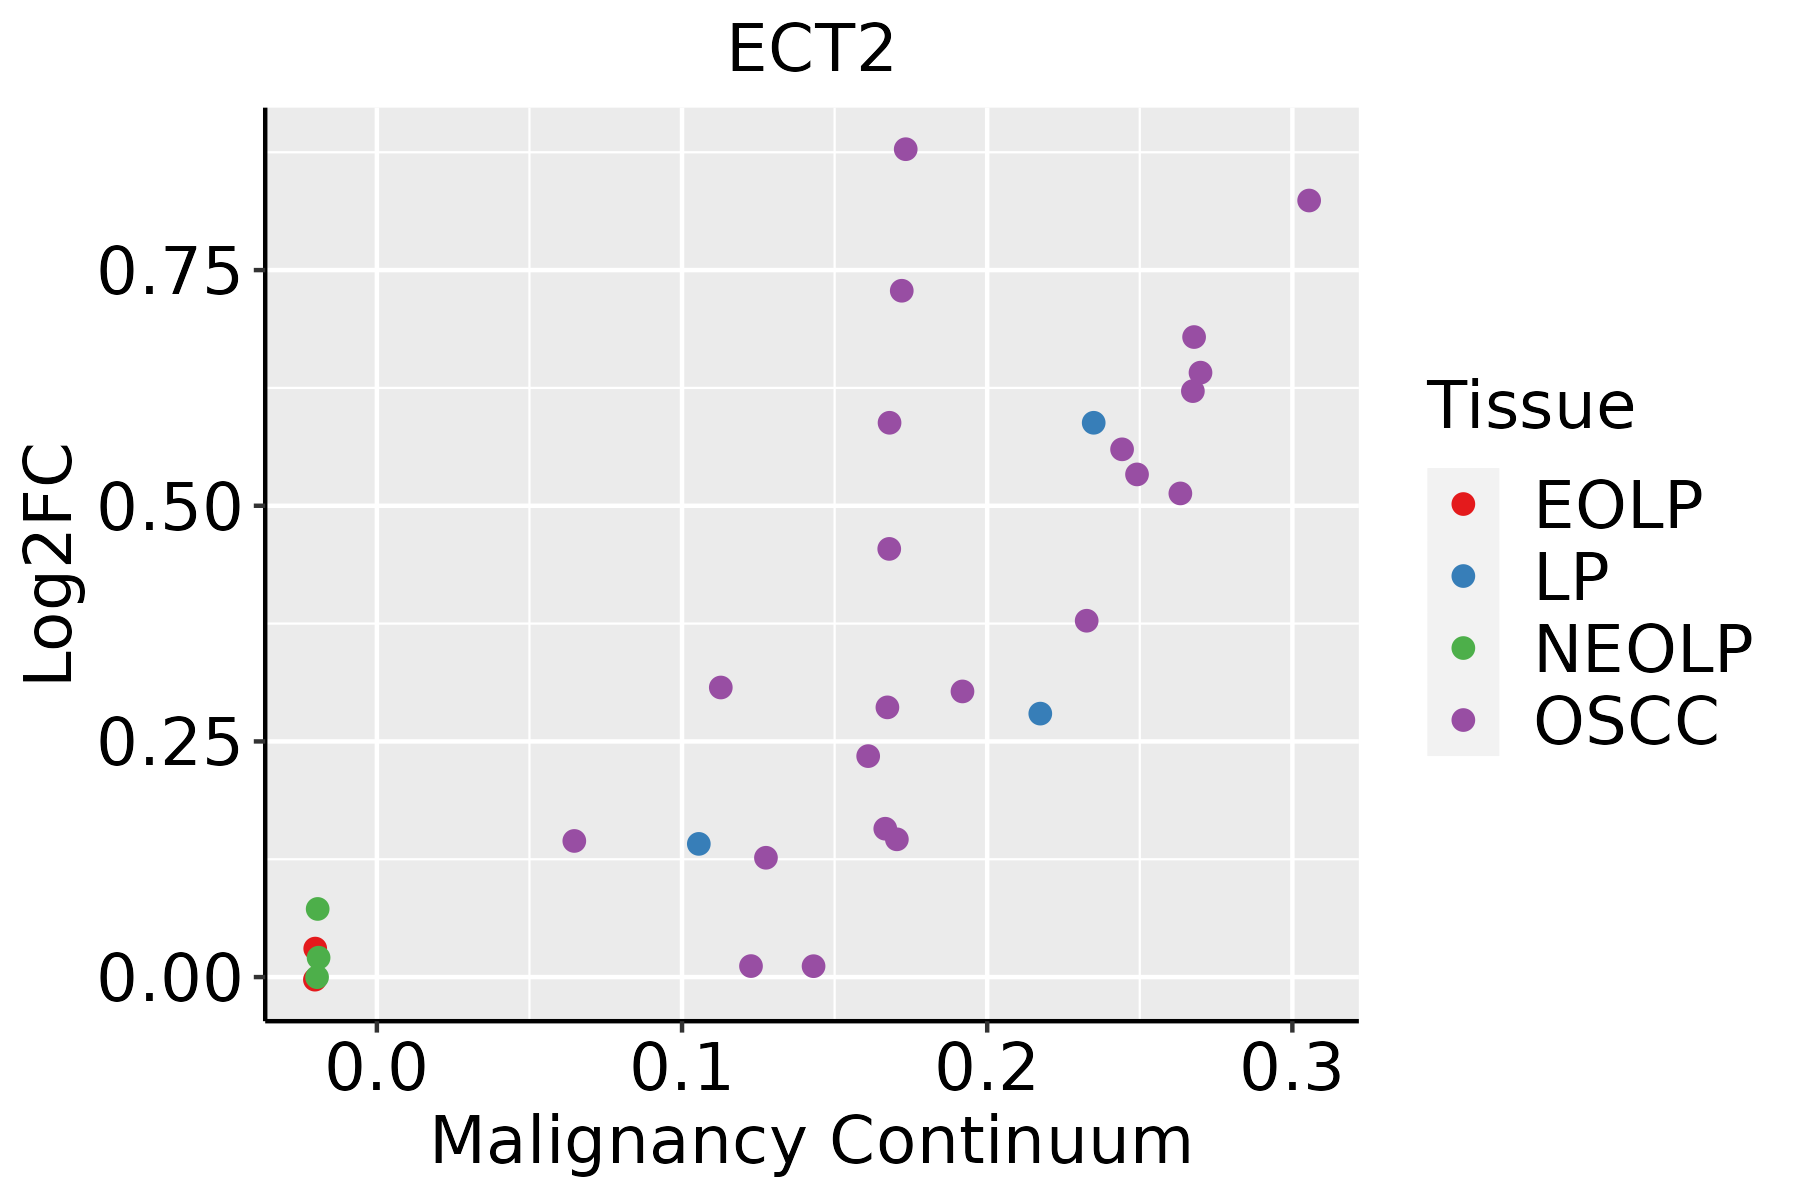 | EOLP: Erosive Oral lichen planus |
| LP: leukoplakia | ||
| NEOLP: Non-erosive oral lichen planus | ||
| OSCC: Oral squamous cell carcinoma | ||
| Skin |  | AK: Actinic keratosis |
| cSCC: Cutaneous squamous cell carcinoma | ||
| SCCIS:squamous cell carcinoma in situ | ||
| Thyroid |  | ATC: Anaplastic thyroid cancer |
| HT: Hashimoto's thyroiditis | ||
| PTC: Papillary thyroid cancer |
| ∗log2FC in expression of this searched gene in stem-like cells from each diseased tissue sample relative to stem-like cells in normal samples in each tissue plotted against the malignancy continuum. Samples are colored based on if they are from different disease stage. |
Top |
Malignant transformation related pathway analysis |
| Find out the enriched GO biological processes and KEGG pathways involved in transition from healthy to precancer to cancer |
| Tissue | Disease Stage | Enriched GO biological Processes |
| Colorectum | AD |  |
| Colorectum | SER |  |
| Colorectum | MSS |  |
| Colorectum | MSI-H |  |
| Colorectum | FAP |  |
| ∗Top 15 enriched GO BP terms are showed in the bar plot of each disease state in each tissue. Each row represents a significant GO biological process which is colored according to the -log10(p.adjust). |
| Page: 1 2 3 4 5 6 7 8 9 |
| GO ID | Tissue | Disease Stage | Description | Gene Ratio | Bg Ratio | pvalue | p.adjust | Count |
| GO:003297010 | Cervix | CC | regulation of actin filament-based process | 96/2311 | 397/18723 | 4.00e-11 | 8.54e-09 | 96 |
| GO:00725949 | Cervix | CC | establishment of protein localization to organelle | 99/2311 | 422/18723 | 1.23e-10 | 2.11e-08 | 99 |
| GO:000697910 | Cervix | CC | response to oxidative stress | 102/2311 | 446/18723 | 2.99e-10 | 4.36e-08 | 102 |
| GO:190382910 | Cervix | CC | positive regulation of cellular protein localization | 72/2311 | 276/18723 | 3.20e-10 | 4.46e-08 | 72 |
| GO:003295610 | Cervix | CC | regulation of actin cytoskeleton organization | 86/2311 | 358/18723 | 5.90e-10 | 7.51e-08 | 86 |
| GO:00510566 | Cervix | CC | regulation of small GTPase mediated signal transduction | 75/2311 | 302/18723 | 1.54e-09 | 1.74e-07 | 75 |
| GO:003367410 | Cervix | CC | positive regulation of kinase activity | 101/2311 | 467/18723 | 8.66e-09 | 7.22e-07 | 101 |
| GO:005122210 | Cervix | CC | positive regulation of protein transport | 72/2311 | 303/18723 | 2.36e-08 | 1.70e-06 | 72 |
| GO:00452169 | Cervix | CC | cell-cell junction organization | 53/2311 | 200/18723 | 3.83e-08 | 2.53e-06 | 53 |
| GO:00069139 | Cervix | CC | nucleocytoplasmic transport | 71/2311 | 301/18723 | 4.04e-08 | 2.54e-06 | 71 |
| GO:00511699 | Cervix | CC | nuclear transport | 71/2311 | 301/18723 | 4.04e-08 | 2.54e-06 | 71 |
| GO:00430877 | Cervix | CC | regulation of GTPase activity | 79/2311 | 348/18723 | 4.21e-08 | 2.60e-06 | 79 |
| GO:00458608 | Cervix | CC | positive regulation of protein kinase activity | 85/2311 | 386/18723 | 5.61e-08 | 3.29e-06 | 85 |
| GO:190495110 | Cervix | CC | positive regulation of establishment of protein localization | 73/2311 | 319/18723 | 9.69e-08 | 5.25e-06 | 73 |
| GO:00345048 | Cervix | CC | protein localization to nucleus | 68/2311 | 290/18723 | 9.91e-08 | 5.25e-06 | 68 |
| GO:000030210 | Cervix | CC | response to reactive oxygen species | 56/2311 | 222/18723 | 1.00e-07 | 5.25e-06 | 56 |
| GO:006219710 | Cervix | CC | cellular response to chemical stress | 76/2311 | 337/18723 | 1.01e-07 | 5.25e-06 | 76 |
| GO:00343298 | Cervix | CC | cell junction assembly | 88/2311 | 420/18723 | 3.42e-07 | 1.38e-05 | 88 |
| GO:004254210 | Cervix | CC | response to hydrogen peroxide | 40/2311 | 146/18723 | 6.79e-07 | 2.46e-05 | 40 |
| GO:00070439 | Cervix | CC | cell-cell junction assembly | 39/2311 | 146/18723 | 1.86e-06 | 5.94e-05 | 39 |
| Page: 1 2 3 4 5 6 7 8 9 10 11 12 13 14 15 16 17 18 19 20 21 22 23 24 25 |
| Pathway ID | Tissue | Disease Stage | Description | Gene Ratio | Bg Ratio | pvalue | p.adjust | qvalue | Count |
| Page: 1 |
Top |
Cell-cell communication analysis |
| Identification of potential cell-cell interactions between two cell types and their ligand-receptor pairs for different disease states |
| Ligand | Receptor | LRpair | Pathway | Tissue | Disease Stage |
| Page: 1 |
Top |
Single-cell gene regulatory network inference analysis |
| Find out the significant the regulons (TFs) and the target genes of each regulon across cell types for different disease states |
| TF | Cell Type | Tissue | Disease Stage | Target Gene | RSS | Regulon Activity |
| ∗The dot plots of a searched regulon are shown for all cell subpopulations in each disease state of each tissue based on the regulon specific score inferred using pySCENIC and by calculating the average expression. |
| Page: 1 |
Top |
Somatic mutation of malignant transformation related genes |
| Annotation of somatic variants for genes involved in malignant transformation |
| Hugo Symbol | Variant Class | Variant Classification | dbSNP RS | HGVSc | HGVSp | HGVSp Short | SWISSPROT | BIOTYPE | SIFT | PolyPhen | Tumor Sample Barcode | Tissue | Histology | Sex | Age | Stage | Therapy Types | Drugs | Outcome |
| ECT2 | SNV | Missense_Mutation | c.1235N>T | p.Ser412Phe | p.S412F | Q9H8V3 | protein_coding | deleterious(0.01) | probably_damaging(0.943) | TCGA-AC-A23H-01 | Breast | breast invasive carcinoma | Female | >=65 | I/II | Unknown | Unknown | PD | |
| ECT2 | SNV | Missense_Mutation | c.2594N>A | p.Arg865Lys | p.R865K | Q9H8V3 | protein_coding | tolerated(0.94) | benign(0.003) | TCGA-BH-A0AW-01 | Breast | breast invasive carcinoma | Female | <65 | I/II | Chemotherapy | carboplatin | SD | |
| ECT2 | SNV | Missense_Mutation | novel | c.646N>G | p.His216Asp | p.H216D | Q9H8V3 | protein_coding | deleterious(0) | probably_damaging(0.979) | TCGA-BH-A0B6-01 | Breast | breast invasive carcinoma | Female | <65 | I/II | Unknown | Unknown | SD |
| ECT2 | SNV | Missense_Mutation | novel | c.1580A>G | p.Asp527Gly | p.D527G | Q9H8V3 | protein_coding | tolerated(0.05) | benign(0.012) | TCGA-2W-A8YY-01 | Cervix | cervical & endocervical cancer | Female | <65 | I/II | Chemotherapy | cisplatin | CR |
| ECT2 | SNV | Missense_Mutation | c.84N>T | p.Glu28Asp | p.E28D | Q9H8V3 | protein_coding | deleterious_low_confidence(0.05) | probably_damaging(0.986) | TCGA-FU-A3HZ-01 | Cervix | cervical & endocervical cancer | Female | <65 | I/II | Chemotherapy | cisplatin | CR | |
| ECT2 | SNV | Missense_Mutation | c.1304N>G | p.Ser435Cys | p.S435C | Q9H8V3 | protein_coding | deleterious(0.04) | possibly_damaging(0.886) | TCGA-IR-A3LH-01 | Cervix | cervical & endocervical cancer | Female | <65 | I/II | Chemotherapy | cisplatin | CR | |
| ECT2 | SNV | Missense_Mutation | novel | c.598N>T | p.His200Tyr | p.H200Y | Q9H8V3 | protein_coding | deleterious(0.01) | possibly_damaging(0.855) | TCGA-VS-A9UO-01 | Cervix | cervical & endocervical cancer | Female | <65 | I/II | Chemotherapy | cisplatin | CR |
| ECT2 | SNV | Missense_Mutation | rs748437185 | c.1462N>T | p.Arg488Cys | p.R488C | Q9H8V3 | protein_coding | tolerated(0.09) | possibly_damaging(0.806) | TCGA-A6-2672-01 | Colorectum | colon adenocarcinoma | Female | >=65 | III/IV | Unknown | Unknown | SD |
| ECT2 | SNV | Missense_Mutation | c.2605A>G | p.Ser869Gly | p.S869G | Q9H8V3 | protein_coding | tolerated(0.2) | benign(0) | TCGA-A6-6781-01 | Colorectum | colon adenocarcinoma | Male | <65 | III/IV | Chemotherapy | oxaliplatin | SD | |
| ECT2 | SNV | Missense_Mutation | c.2607C>A | p.Ser869Arg | p.S869R | Q9H8V3 | protein_coding | tolerated(0.06) | benign(0.07) | TCGA-A6-6781-01 | Colorectum | colon adenocarcinoma | Male | <65 | III/IV | Chemotherapy | oxaliplatin | SD |
| Page: 1 2 3 4 5 6 7 8 9 |
Top |
Related drugs of malignant transformation related genes |
| Identification of chemicals and drugs interact with genes involved in malignant transfromation |
| (DGIdb 4.0) |
| Entrez ID | Symbol | Category | Interaction Types | Drug Claim Name | Drug Name | PMIDs |
| Page: 1 |

Copyright 2023-Present -The University of Texas Health Science Center at Houston |