
|
|||||
|
 | |
| |
| |
| |
| |
| |
|
Gene: ECSIT |
Gene summary for ECSIT |
| Gene information | Species | Human | Gene symbol | ECSIT | Gene ID | 51295 |
| Gene name | ECSIT signaling integrator | |
| Gene Alias | SITPEC | |
| Cytomap | 19p13.2 | |
| Gene Type | protein-coding | GO ID | GO:0002376 | UniProtAcc | Q9BQ95 |
Top |
Malignant transformation analysis |
| Identification of the aberrant gene expression in precancerous and cancerous lesions by comparing the gene expression of stem-like cells in diseased tissues with normal stem cells |
| Entrez ID | Symbol | Replicates | Species | Organ | Tissue | Adj P-value | Log2FC | Malignancy |
| 51295 | ECSIT | HTA11_347_2000001011 | Human | Colorectum | AD | 8.25e-07 | 3.38e-01 | -0.1954 |
| 51295 | ECSIT | HTA11_83_2000001011 | Human | Colorectum | SER | 1.99e-07 | 4.67e-01 | -0.1526 |
| 51295 | ECSIT | HTA11_1391_2000001011 | Human | Colorectum | AD | 1.02e-04 | 3.35e-01 | -0.059 |
| 51295 | ECSIT | HTA11_866_3004761011 | Human | Colorectum | AD | 7.32e-03 | 2.21e-01 | 0.096 |
| 51295 | ECSIT | HTA11_10623_2000001011 | Human | Colorectum | AD | 9.12e-03 | 4.51e-01 | -0.0177 |
| 51295 | ECSIT | HTA11_7696_3000711011 | Human | Colorectum | AD | 3.57e-08 | 5.27e-01 | 0.0674 |
| 51295 | ECSIT | A015-C-203 | Human | Colorectum | FAP | 8.13e-05 | -1.20e-01 | -0.1294 |
| 51295 | ECSIT | A001-C-108 | Human | Colorectum | FAP | 1.37e-02 | -1.13e-01 | -0.0272 |
| 51295 | ECSIT | A015-C-104 | Human | Colorectum | FAP | 1.12e-04 | -3.99e-02 | -0.1899 |
| 51295 | ECSIT | A002-C-116 | Human | Colorectum | FAP | 1.50e-04 | -1.07e-01 | -0.0452 |
| 51295 | ECSIT | LZE4T | Human | Esophagus | ESCC | 3.56e-13 | 3.66e-01 | 0.0811 |
| 51295 | ECSIT | LZE7T | Human | Esophagus | ESCC | 1.53e-04 | 2.67e-01 | 0.0667 |
| 51295 | ECSIT | LZE8T | Human | Esophagus | ESCC | 2.83e-08 | 3.66e-01 | 0.067 |
| 51295 | ECSIT | LZE22T | Human | Esophagus | ESCC | 3.09e-04 | 3.83e-01 | 0.068 |
| 51295 | ECSIT | LZE24T | Human | Esophagus | ESCC | 5.06e-20 | 5.12e-01 | 0.0596 |
| 51295 | ECSIT | LZE21T | Human | Esophagus | ESCC | 1.25e-02 | 4.90e-01 | 0.0655 |
| 51295 | ECSIT | LZE6T | Human | Esophagus | ESCC | 2.67e-06 | 2.78e-01 | 0.0845 |
| 51295 | ECSIT | P1T-E | Human | Esophagus | ESCC | 4.28e-10 | 4.09e-01 | 0.0875 |
| 51295 | ECSIT | P2T-E | Human | Esophagus | ESCC | 2.65e-17 | 2.51e-01 | 0.1177 |
| 51295 | ECSIT | P4T-E | Human | Esophagus | ESCC | 5.01e-32 | 6.84e-01 | 0.1323 |
| Page: 1 2 3 4 5 |
| Tissue | Expression Dynamics | Abbreviation |
| Colorectum (GSE201348) |  | FAP: Familial adenomatous polyposis |
| CRC: Colorectal cancer | ||
| Colorectum (HTA11) |  | AD: Adenomas |
| SER: Sessile serrated lesions | ||
| MSI-H: Microsatellite-high colorectal cancer | ||
| MSS: Microsatellite stable colorectal cancer | ||
| Esophagus |  | ESCC: Esophageal squamous cell carcinoma |
| HGIN: High-grade intraepithelial neoplasias | ||
| LGIN: Low-grade intraepithelial neoplasias | ||
| Oral Cavity | 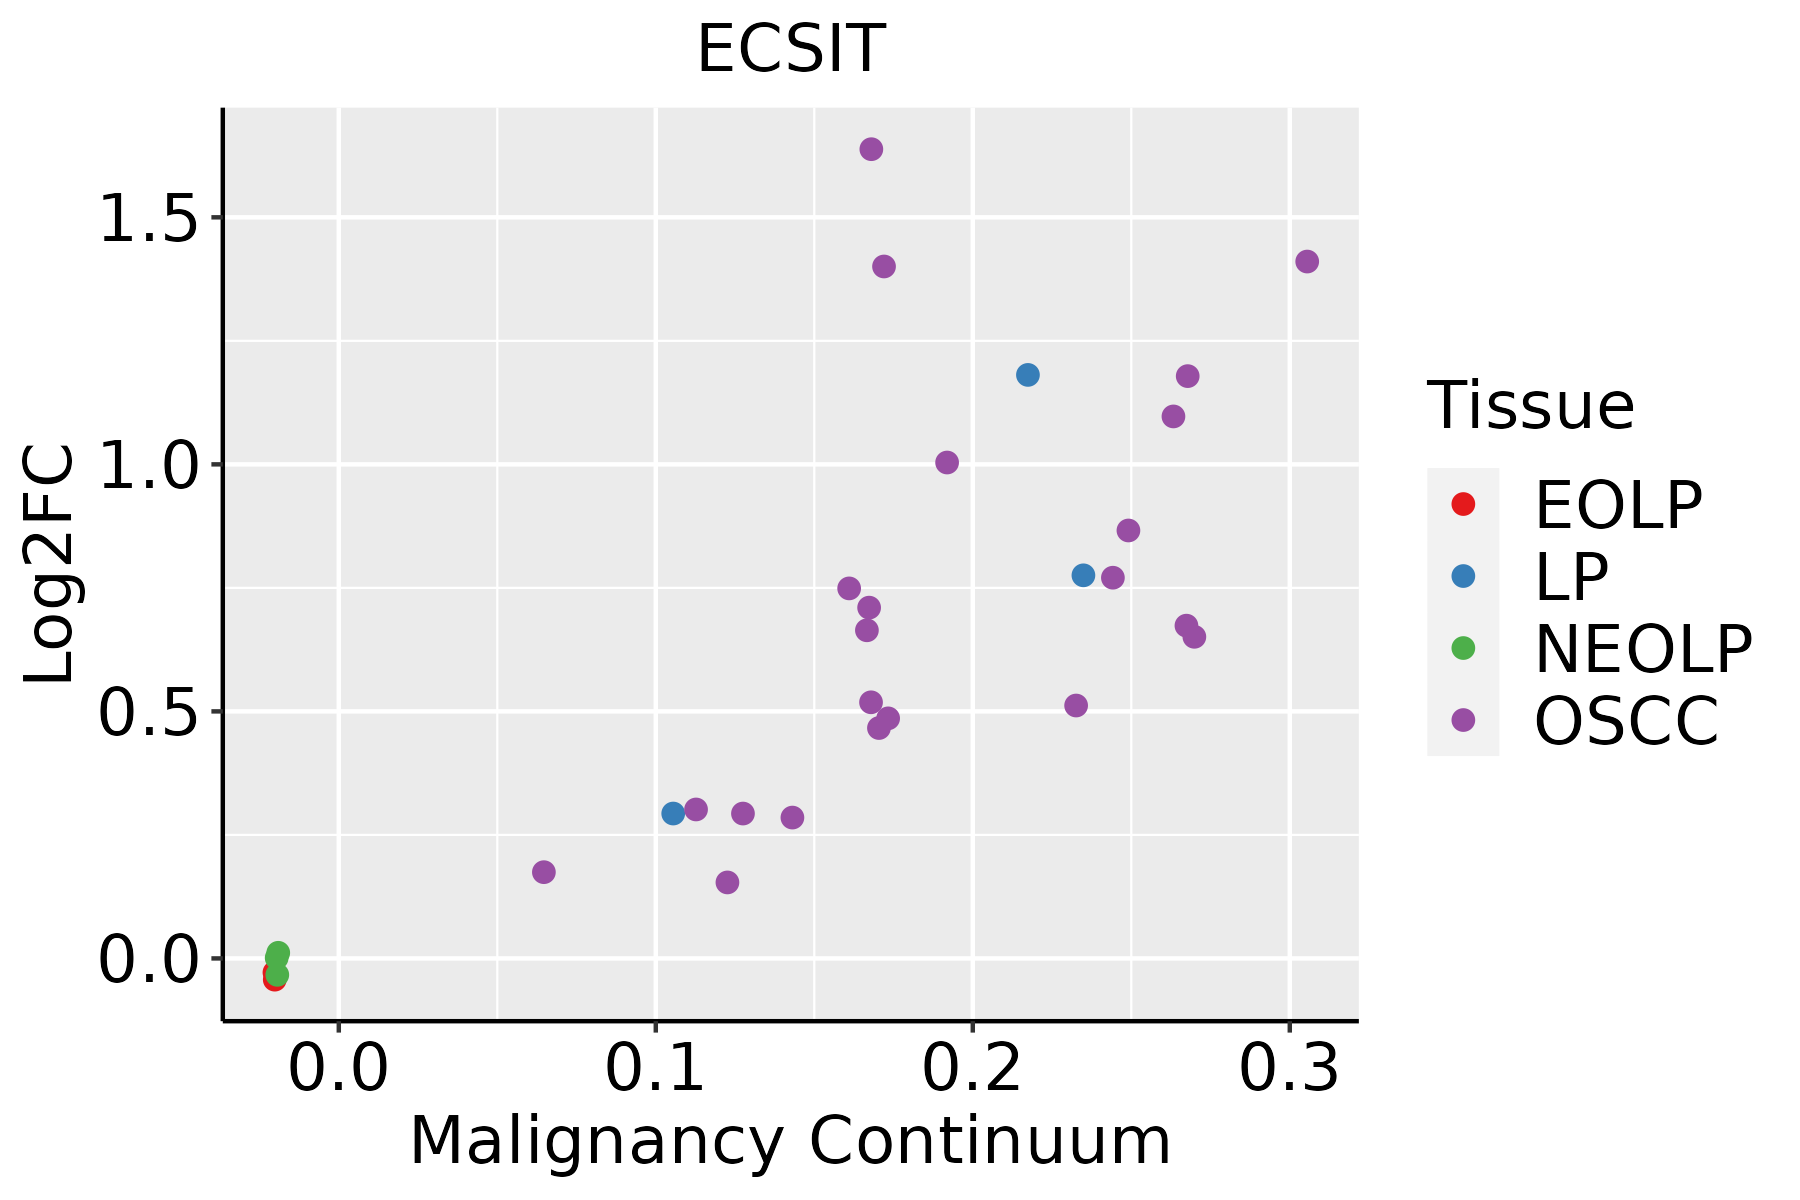 | EOLP: Erosive Oral lichen planus |
| LP: leukoplakia | ||
| NEOLP: Non-erosive oral lichen planus | ||
| OSCC: Oral squamous cell carcinoma | ||
| Skin | 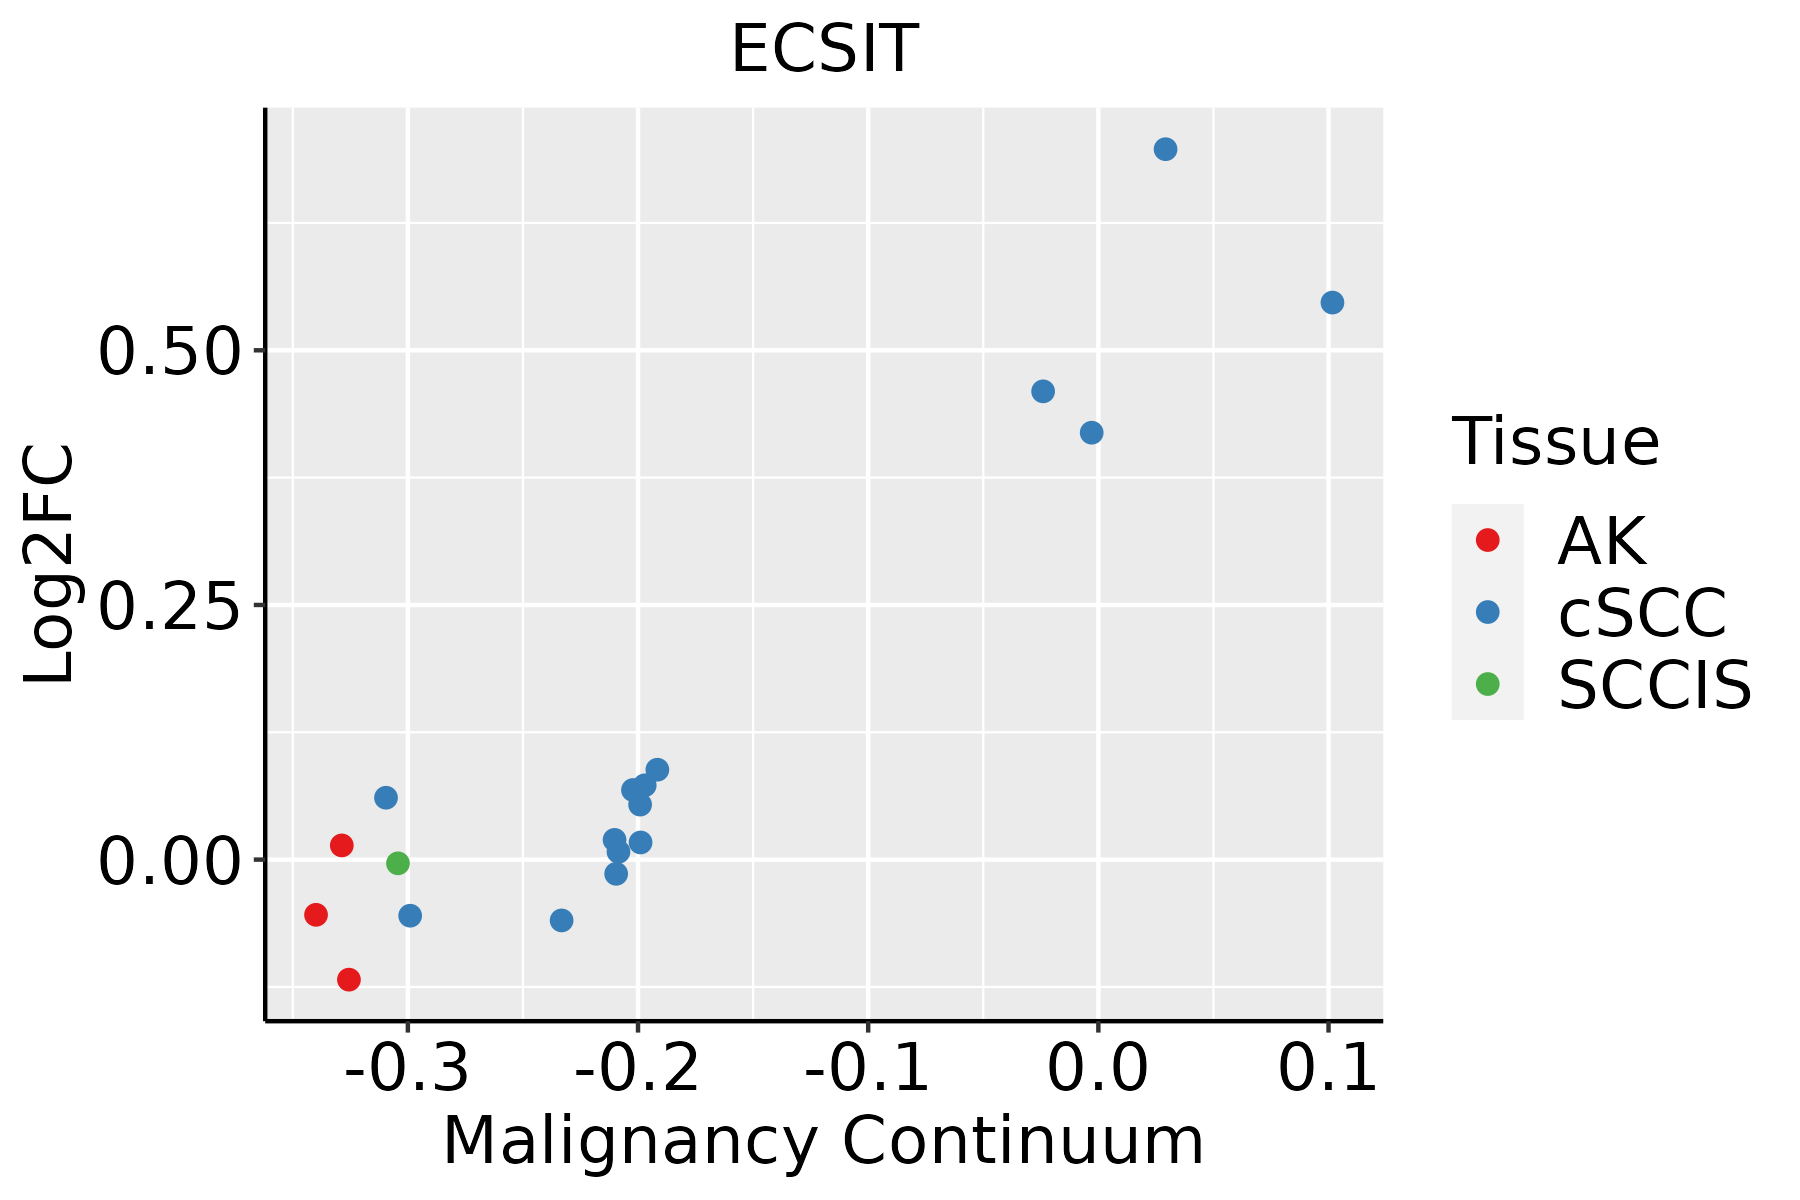 | AK: Actinic keratosis |
| cSCC: Cutaneous squamous cell carcinoma | ||
| SCCIS:squamous cell carcinoma in situ |
| ∗log2FC in expression of this searched gene in stem-like cells from each diseased tissue sample relative to stem-like cells in normal samples in each tissue plotted against the malignancy continuum. Samples are colored based on if they are from different disease stage. |
Top |
Malignant transformation related pathway analysis |
| Find out the enriched GO biological processes and KEGG pathways involved in transition from healthy to precancer to cancer |
| Tissue | Disease Stage | Enriched GO biological Processes |
| Colorectum | AD |  |
| Colorectum | SER |  |
| Colorectum | MSS |  |
| Colorectum | MSI-H |  |
| Colorectum | FAP |  |
| ∗Top 15 enriched GO BP terms are showed in the bar plot of each disease state in each tissue. Each row represents a significant GO biological process which is colored according to the -log10(p.adjust). |
| Page: 1 2 3 4 5 6 7 8 9 |
| GO ID | Tissue | Disease Stage | Description | Gene Ratio | Bg Ratio | pvalue | p.adjust | Count |
| GO:0051341 | Colorectum | SER | regulation of oxidoreductase activity | 27/2897 | 107/18723 | 5.86e-03 | 4.29e-02 | 27 |
| GO:0061635 | Skin | cSCC | regulation of protein complex stability | 7/4864 | 11/18723 | 9.45e-03 | 4.25e-02 | 7 |
| Page: 1 |
| Pathway ID | Tissue | Disease Stage | Description | Gene Ratio | Bg Ratio | pvalue | p.adjust | qvalue | Count |
| hsa04010 | Colorectum | FAP | MAPK signaling pathway | 68/1404 | 302/8465 | 4.00e-03 | 1.67e-02 | 1.02e-02 | 68 |
| hsa040101 | Colorectum | FAP | MAPK signaling pathway | 68/1404 | 302/8465 | 4.00e-03 | 1.67e-02 | 1.02e-02 | 68 |
| hsa0401014 | Oral cavity | OSCC | MAPK signaling pathway | 165/3704 | 302/8465 | 7.11e-05 | 2.74e-04 | 1.40e-04 | 165 |
| hsa0401015 | Oral cavity | OSCC | MAPK signaling pathway | 165/3704 | 302/8465 | 7.11e-05 | 2.74e-04 | 1.40e-04 | 165 |
| Page: 1 |
Top |
Cell-cell communication analysis |
| Identification of potential cell-cell interactions between two cell types and their ligand-receptor pairs for different disease states |
| Ligand | Receptor | LRpair | Pathway | Tissue | Disease Stage |
| Page: 1 |
Top |
Single-cell gene regulatory network inference analysis |
| Find out the significant the regulons (TFs) and the target genes of each regulon across cell types for different disease states |
| TF | Cell Type | Tissue | Disease Stage | Target Gene | RSS | Regulon Activity |
| ECSIT | PSC | Pancreas | PDAC | TMEM97,C1QTNF4,C16orf95, etc. | 4.87e-01 |  |
| ∗The dot plots of a searched regulon are shown for all cell subpopulations in each disease state of each tissue based on the regulon specific score inferred using pySCENIC and by calculating the average expression. |
| Page: 1 |
Top |
Somatic mutation of malignant transformation related genes |
| Annotation of somatic variants for genes involved in malignant transformation |
| Hugo Symbol | Variant Class | Variant Classification | dbSNP RS | HGVSc | HGVSp | HGVSp Short | SWISSPROT | BIOTYPE | SIFT | PolyPhen | Tumor Sample Barcode | Tissue | Histology | Sex | Age | Stage | Therapy Types | Drugs | Outcome |
| ECSIT | SNV | Missense_Mutation | novel | c.700N>G | p.Met234Val | p.M234V | Q9BQ95 | protein_coding | tolerated(0.08) | benign(0.003) | TCGA-4H-AAAK-01 | Breast | breast invasive carcinoma | Female | <65 | III/IV | Chemotherapy | cyclophosphamide | CR |
| ECSIT | SNV | Missense_Mutation | c.776C>G | p.Pro259Arg | p.P259R | Q9BQ95 | protein_coding | tolerated(0.12) | benign(0.048) | TCGA-AR-A24U-01 | Breast | breast invasive carcinoma | Female | <65 | I/II | Chemotherapy | doxorubicin | SD | |
| ECSIT | insertion | In_Frame_Ins | novel | c.250_251insATGTGCTGTGTCCACTCAGGTTTAAATGGATTAAGGGCA | p.Glu83_Arg84insHisValLeuCysProLeuArgPheLysTrpIleLysGly | p.E83_R84insHVLCPLRFKWIKG | Q9BQ95 | protein_coding | TCGA-E9-A1N9-01 | Breast | breast invasive carcinoma | Female | <65 | I/II | Chemotherapy | doxorubicin | SD | ||
| ECSIT | SNV | Missense_Mutation | rs867307996 | c.823N>A | p.Ala275Thr | p.A275T | Q9BQ95 | protein_coding | tolerated(0.05) | possibly_damaging(0.777) | TCGA-2W-A8YY-01 | Cervix | cervical & endocervical cancer | Female | <65 | I/II | Chemotherapy | cisplatin | CR |
| ECSIT | SNV | Missense_Mutation | novel | c.946N>A | p.Glu316Lys | p.E316K | Q9BQ95 | protein_coding | tolerated(0.56) | benign(0) | TCGA-MA-AA43-01 | Cervix | cervical & endocervical cancer | Female | <65 | III/IV | Unknown | Unknown | SD |
| ECSIT | SNV | Missense_Mutation | rs774617724 | c.1132N>A | p.Gln378Lys | p.Q378K | Q9BQ95 | protein_coding | deleterious(0) | probably_damaging(0.994) | TCGA-VS-A94Z-01 | Cervix | cervical & endocervical cancer | Female | <65 | I/II | Chemotherapy | cisplatin | CR |
| ECSIT | SNV | Missense_Mutation | novel | c.943A>G | p.Arg315Gly | p.R315G | Q9BQ95 | protein_coding | deleterious(0.03) | benign(0.15) | TCGA-A6-6649-01 | Colorectum | colon adenocarcinoma | Male | >=65 | III/IV | Chemotherapy | fluorouracil | SD |
| ECSIT | SNV | Missense_Mutation | rs537928683 | c.458A>G | p.His153Arg | p.H153R | Q9BQ95 | protein_coding | deleterious(0) | probably_damaging(0.999) | TCGA-AA-3663-01 | Colorectum | colon adenocarcinoma | Male | <65 | I/II | Unknown | Unknown | SD |
| ECSIT | SNV | Missense_Mutation | rs778037100 | c.353N>A | p.Arg118Gln | p.R118Q | Q9BQ95 | protein_coding | tolerated(0.19) | benign(0.33) | TCGA-AA-3966-01 | Colorectum | colon adenocarcinoma | Female | >=65 | I/II | Unknown | Unknown | SD |
| ECSIT | SNV | Missense_Mutation | c.134N>T | p.Ala45Val | p.A45V | Q9BQ95 | protein_coding | tolerated(0.18) | benign(0.018) | TCGA-CK-4951-01 | Colorectum | colon adenocarcinoma | Female | >=65 | I/II | Unknown | Unknown | PD |
| Page: 1 2 3 4 5 6 |
Top |
Related drugs of malignant transformation related genes |
| Identification of chemicals and drugs interact with genes involved in malignant transfromation |
| (DGIdb 4.0) |
| Entrez ID | Symbol | Category | Interaction Types | Drug Claim Name | Drug Name | PMIDs |
| Page: 1 |

Copyright 2023-Present -The University of Texas Health Science Center at Houston |