
|
|||||
|
 | |
| |
| |
| |
| |
| |
|
Gene: ECSCR |
Gene summary for ECSCR |
| Gene information | Species | Human | Gene symbol | ECSCR | Gene ID | 641700 |
| Gene name | endothelial cell surface expressed chemotaxis and apoptosis regulator | |
| Gene Alias | ARIA | |
| Cytomap | 5q31.2 | |
| Gene Type | protein-coding | GO ID | GO:0001525 | UniProtAcc | Q19T08 |
Top |
Malignant transformation analysis |
| Identification of the aberrant gene expression in precancerous and cancerous lesions by comparing the gene expression of stem-like cells in diseased tissues with normal stem cells |
| Entrez ID | Symbol | Replicates | Species | Organ | Tissue | Adj P-value | Log2FC | Malignancy |
| 641700 | ECSCR | ATC11 | Human | Thyroid | ATC | 1.83e-02 | 1.08e+00 | 0.3386 |
| 641700 | ECSCR | ATC2 | Human | Thyroid | ATC | 1.90e-15 | 1.43e+00 | 0.34 |
| Page: 1 |
| Tissue | Expression Dynamics | Abbreviation |
| Thyroid | 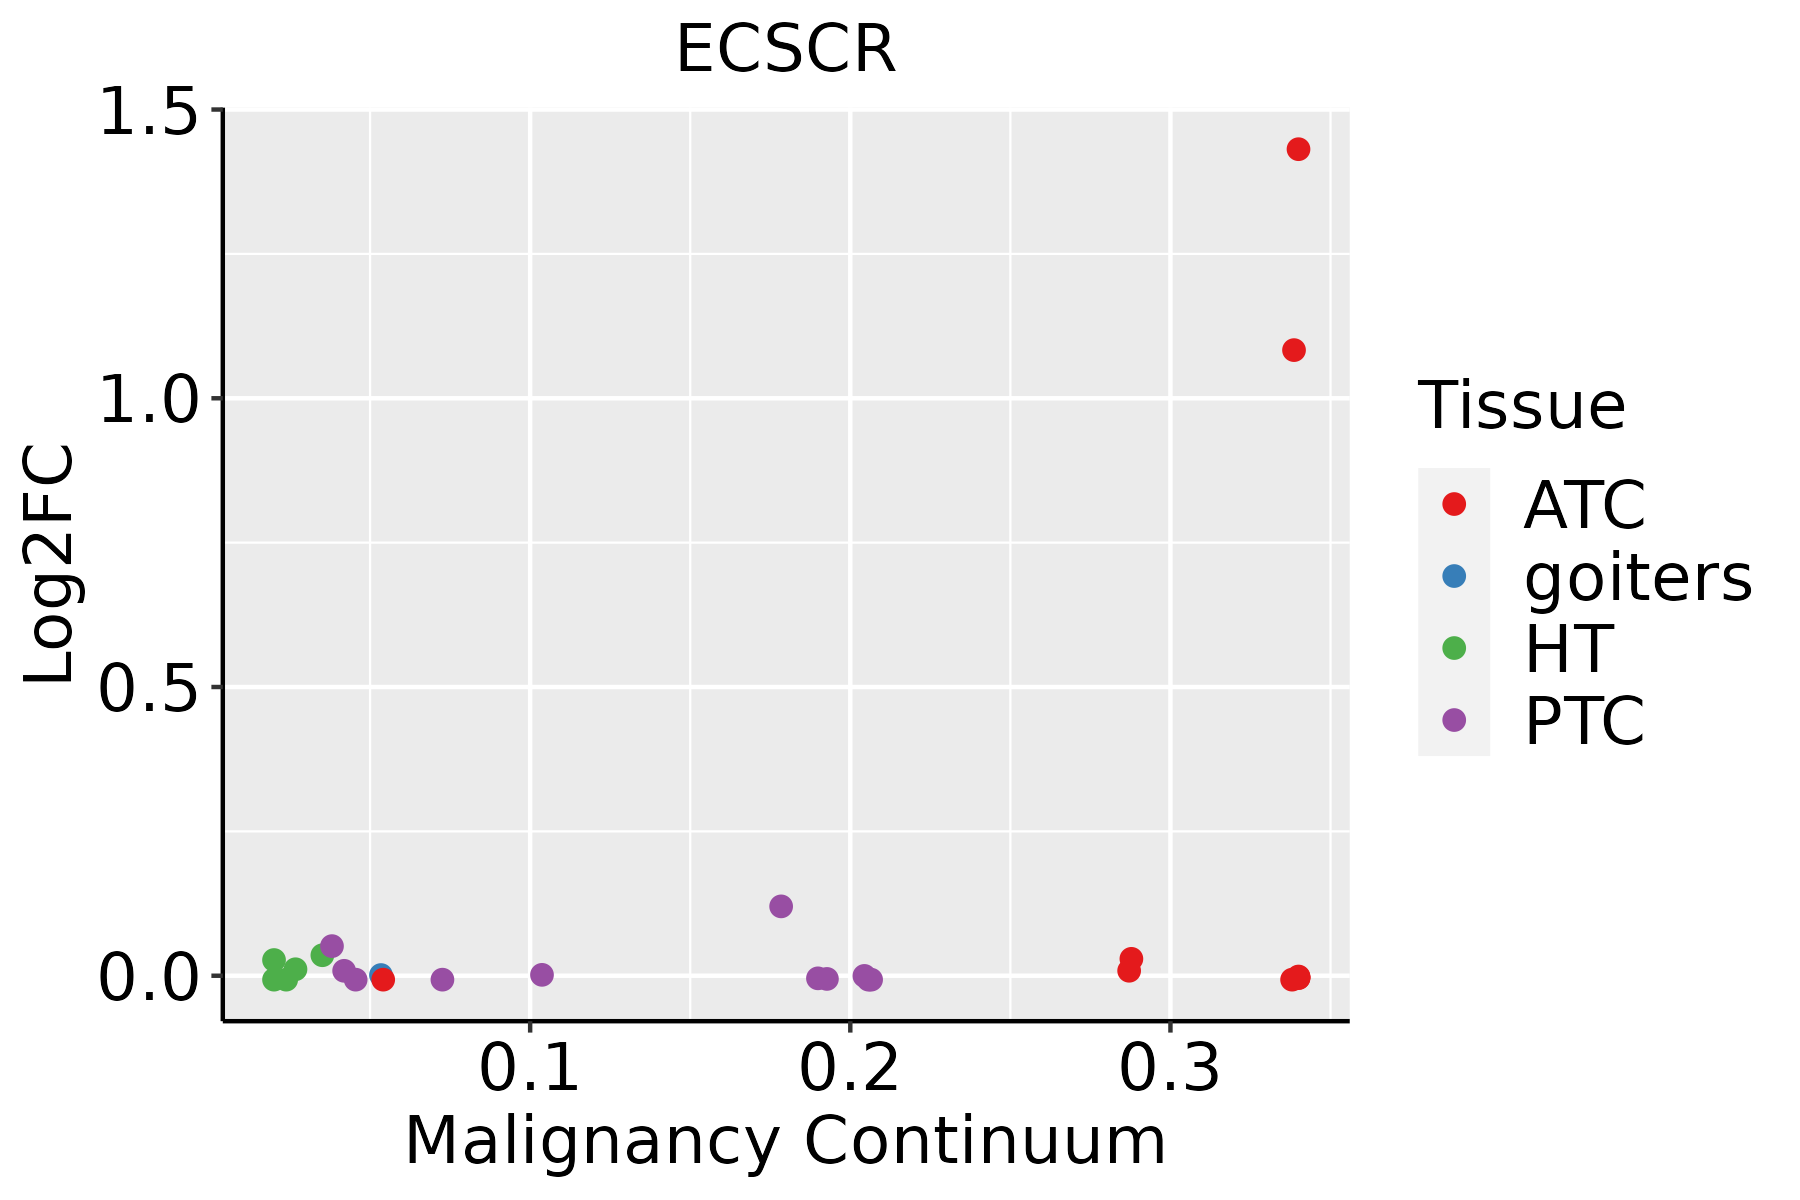 | ATC: Anaplastic thyroid cancer |
| HT: Hashimoto's thyroiditis | ||
| PTC: Papillary thyroid cancer |
| ∗log2FC in expression of this searched gene in stem-like cells from each diseased tissue sample relative to stem-like cells in normal samples in each tissue plotted against the malignancy continuum. Samples are colored based on if they are from different disease stage. |
Top |
Malignant transformation related pathway analysis |
| Find out the enriched GO biological processes and KEGG pathways involved in transition from healthy to precancer to cancer |
| Tissue | Disease Stage | Enriched GO biological Processes |
| Colorectum | AD |  |
| Colorectum | SER |  |
| Colorectum | MSS |  |
| Colorectum | MSI-H |  |
| Colorectum | FAP |  |
| ∗Top 15 enriched GO BP terms are showed in the bar plot of each disease state in each tissue. Each row represents a significant GO biological process which is colored according to the -log10(p.adjust). |
| Page: 1 2 3 4 5 6 7 8 9 |
| GO ID | Tissue | Disease Stage | Description | Gene Ratio | Bg Ratio | pvalue | p.adjust | Count |
| GO:001049832 | Thyroid | ATC | proteasomal protein catabolic process | 309/6293 | 490/18723 | 1.78e-41 | 1.13e-37 | 309 |
| GO:0009896210 | Thyroid | ATC | positive regulation of catabolic process | 290/6293 | 492/18723 | 2.15e-31 | 1.94e-28 | 290 |
| GO:0031331210 | Thyroid | ATC | positive regulation of cellular catabolic process | 258/6293 | 427/18723 | 2.09e-30 | 1.65e-27 | 258 |
| GO:004217635 | Thyroid | ATC | regulation of protein catabolic process | 239/6293 | 391/18723 | 2.63e-29 | 1.85e-26 | 239 |
| GO:190336235 | Thyroid | ATC | regulation of cellular protein catabolic process | 168/6293 | 255/18723 | 3.50e-26 | 1.58e-23 | 168 |
| GO:190305035 | Thyroid | ATC | regulation of proteolysis involved in cellular protein catabolic process | 146/6293 | 221/18723 | 4.18e-23 | 1.20e-20 | 146 |
| GO:006113633 | Thyroid | ATC | regulation of proteasomal protein catabolic process | 128/6293 | 187/18723 | 1.63e-22 | 4.30e-20 | 128 |
| GO:0045732210 | Thyroid | ATC | positive regulation of protein catabolic process | 148/6293 | 231/18723 | 1.93e-21 | 4.36e-19 | 148 |
| GO:190336434 | Thyroid | ATC | positive regulation of cellular protein catabolic process | 109/6293 | 155/18723 | 8.26e-21 | 1.49e-18 | 109 |
| GO:190180027 | Thyroid | ATC | positive regulation of proteasomal protein catabolic process | 85/6293 | 114/18723 | 3.70e-19 | 5.20e-17 | 85 |
| GO:190305227 | Thyroid | ATC | positive regulation of proteolysis involved in cellular protein catabolic process | 93/6293 | 133/18723 | 1.06e-17 | 1.18e-15 | 93 |
| GO:004586234 | Thyroid | ATC | positive regulation of proteolysis | 202/6293 | 372/18723 | 1.07e-16 | 9.42e-15 | 202 |
| GO:190401921 | Thyroid | ATC | epithelial cell apoptotic process | 58/6293 | 121/18723 | 7.47e-04 | 4.14e-03 | 58 |
| GO:00457657 | Thyroid | ATC | regulation of angiogenesis | 141/6293 | 342/18723 | 1.80e-03 | 8.85e-03 | 141 |
| GO:19013427 | Thyroid | ATC | regulation of vasculature development | 143/6293 | 348/18723 | 1.95e-03 | 9.44e-03 | 143 |
| Page: 1 |
| Pathway ID | Tissue | Disease Stage | Description | Gene Ratio | Bg Ratio | pvalue | p.adjust | qvalue | Count |
| Page: 1 |
Top |
Cell-cell communication analysis |
| Identification of potential cell-cell interactions between two cell types and their ligand-receptor pairs for different disease states |
| Ligand | Receptor | LRpair | Pathway | Tissue | Disease Stage |
| Page: 1 |
Top |
Single-cell gene regulatory network inference analysis |
| Find out the significant the regulons (TFs) and the target genes of each regulon across cell types for different disease states |
| TF | Cell Type | Tissue | Disease Stage | Target Gene | RSS | Regulon Activity |
| ∗The dot plots of a searched regulon are shown for all cell subpopulations in each disease state of each tissue based on the regulon specific score inferred using pySCENIC and by calculating the average expression. |
| Page: 1 |
Top |
Somatic mutation of malignant transformation related genes |
| Annotation of somatic variants for genes involved in malignant transformation |
| Hugo Symbol | Variant Class | Variant Classification | dbSNP RS | HGVSc | HGVSp | HGVSp Short | SWISSPROT | BIOTYPE | SIFT | PolyPhen | Tumor Sample Barcode | Tissue | Histology | Sex | Age | Stage | Therapy Types | Drugs | Outcome |
| ECSCR | SNV | Missense_Mutation | novel | c.595C>A | p.Leu199Ile | p.L199I | Q19T08 | protein_coding | tolerated(0.07) | possibly_damaging(0.578) | TCGA-B5-A3FA-01 | Endometrium | uterine corpus endometrioid carcinoma | Female | >=65 | I/II | Unknown | Unknown | SD |
| ECSCR | SNV | Missense_Mutation | novel | c.550C>T | p.Leu184Phe | p.L184F | Q19T08 | protein_coding | deleterious(0) | possibly_damaging(0.773) | TCGA-BG-A222-01 | Endometrium | uterine corpus endometrioid carcinoma | Female | <65 | I/II | Unknown | Unknown | SD |
| ECSCR | SNV | Missense_Mutation | novel | c.538N>T | p.Asp180Tyr | p.D180Y | Q19T08 | protein_coding | deleterious(0) | probably_damaging(0.937) | TCGA-EO-A3B0-01 | Endometrium | uterine corpus endometrioid carcinoma | Female | <65 | III/IV | Unknown | Unknown | SD |
| ECSCR | SNV | Missense_Mutation | c.212C>A | p.Thr71Asn | p.T71N | Q19T08 | protein_coding | tolerated_low_confidence(0.24) | possibly_damaging(0.463) | TCGA-UB-A7MB-01 | Liver | liver hepatocellular carcinoma | Male | <65 | I/II | Targeted Molecular therapy | sorafenib | PD | |
| ECSCR | SNV | Missense_Mutation | novel | c.214C>A | p.Pro72Thr | p.P72T | Q19T08 | protein_coding | tolerated_low_confidence(0.1) | benign(0.011) | TCGA-CR-7398-01 | Oral cavity | head & neck squamous cell carcinoma | Female | <65 | I/II | Unknown | Unknown | SD |
| ECSCR | insertion | In_Frame_Ins | novel | c.113_114insGGA | p.Leu38_Gly39insAsp | p.L38_G39insD | Q19T08 | protein_coding | TCGA-CN-A497-01 | Oral cavity | head & neck squamous cell carcinoma | Male | <65 | III/IV | Unknown | Unknown | SD |
| Page: 1 |
Top |
Related drugs of malignant transformation related genes |
| Identification of chemicals and drugs interact with genes involved in malignant transfromation |
| (DGIdb 4.0) |
| Entrez ID | Symbol | Category | Interaction Types | Drug Claim Name | Drug Name | PMIDs |
| Page: 1 |

Copyright 2023-Present -The University of Texas Health Science Center at Houston |