
|
|||||
|
 | |
| |
| |
| |
| |
| |
|
Gene: ECPAS |
Gene summary for ECPAS |
| Gene information | Species | Human | Gene symbol | ECPAS | Gene ID | 23392 |
| Gene name | Ecm29 proteasome adaptor and scaffold | |
| Gene Alias | ECM29 | |
| Cytomap | 9q31.3 | |
| Gene Type | protein-coding | GO ID | GO:0006508 | UniProtAcc | NA |
Top |
Malignant transformation analysis |
| Identification of the aberrant gene expression in precancerous and cancerous lesions by comparing the gene expression of stem-like cells in diseased tissues with normal stem cells |
| Entrez ID | Symbol | Replicates | Species | Organ | Tissue | Adj P-value | Log2FC | Malignancy |
| 23392 | ECPAS | N_HPV_1 | Human | Cervix | N_HPV | 1.54e-02 | -9.88e-02 | 0.0079 |
| 23392 | ECPAS | CCI_1 | Human | Cervix | CC | 1.31e-03 | 5.86e-01 | 0.528 |
| 23392 | ECPAS | CCI_2 | Human | Cervix | CC | 2.19e-08 | 1.15e+00 | 0.5249 |
| 23392 | ECPAS | CCI_3 | Human | Cervix | CC | 3.82e-12 | 8.62e-01 | 0.516 |
| 23392 | ECPAS | Tumor | Human | Cervix | CC | 1.91e-09 | -2.15e-01 | 0.1241 |
| 23392 | ECPAS | HTA11_3410_2000001011 | Human | Colorectum | AD | 4.87e-13 | -5.25e-01 | 0.0155 |
| 23392 | ECPAS | HTA11_2487_2000001011 | Human | Colorectum | SER | 6.57e-03 | -3.57e-01 | -0.1808 |
| 23392 | ECPAS | HTA11_866_3004761011 | Human | Colorectum | AD | 2.32e-05 | -3.57e-01 | 0.096 |
| 23392 | ECPAS | HTA11_99999970781_79442 | Human | Colorectum | MSS | 3.10e-42 | -7.67e-01 | 0.294 |
| 23392 | ECPAS | HTA11_99999965104_69814 | Human | Colorectum | MSS | 4.18e-18 | -7.67e-01 | 0.281 |
| 23392 | ECPAS | HTA11_99999971662_82457 | Human | Colorectum | MSS | 3.10e-42 | -7.67e-01 | 0.3859 |
| 23392 | ECPAS | HTA11_99999973899_84307 | Human | Colorectum | MSS | 4.75e-14 | -7.67e-01 | 0.2585 |
| 23392 | ECPAS | HTA11_99999974143_84620 | Human | Colorectum | MSS | 1.13e-42 | -7.67e-01 | 0.3005 |
| 23392 | ECPAS | A015-C-203 | Human | Colorectum | FAP | 3.83e-22 | -3.46e-01 | -0.1294 |
| 23392 | ECPAS | A015-C-204 | Human | Colorectum | FAP | 3.59e-04 | -1.10e-01 | -0.0228 |
| 23392 | ECPAS | A014-C-040 | Human | Colorectum | FAP | 1.56e-03 | -3.80e-01 | -0.1184 |
| 23392 | ECPAS | A002-C-201 | Human | Colorectum | FAP | 2.47e-10 | -2.36e-01 | 0.0324 |
| 23392 | ECPAS | A002-C-203 | Human | Colorectum | FAP | 2.10e-04 | -2.04e-01 | 0.2786 |
| 23392 | ECPAS | A001-C-119 | Human | Colorectum | FAP | 7.22e-05 | -2.76e-01 | -0.1557 |
| 23392 | ECPAS | A001-C-108 | Human | Colorectum | FAP | 4.00e-13 | -1.20e-01 | -0.0272 |
| Page: 1 2 3 4 5 |
| Tissue | Expression Dynamics | Abbreviation |
| Cervix | 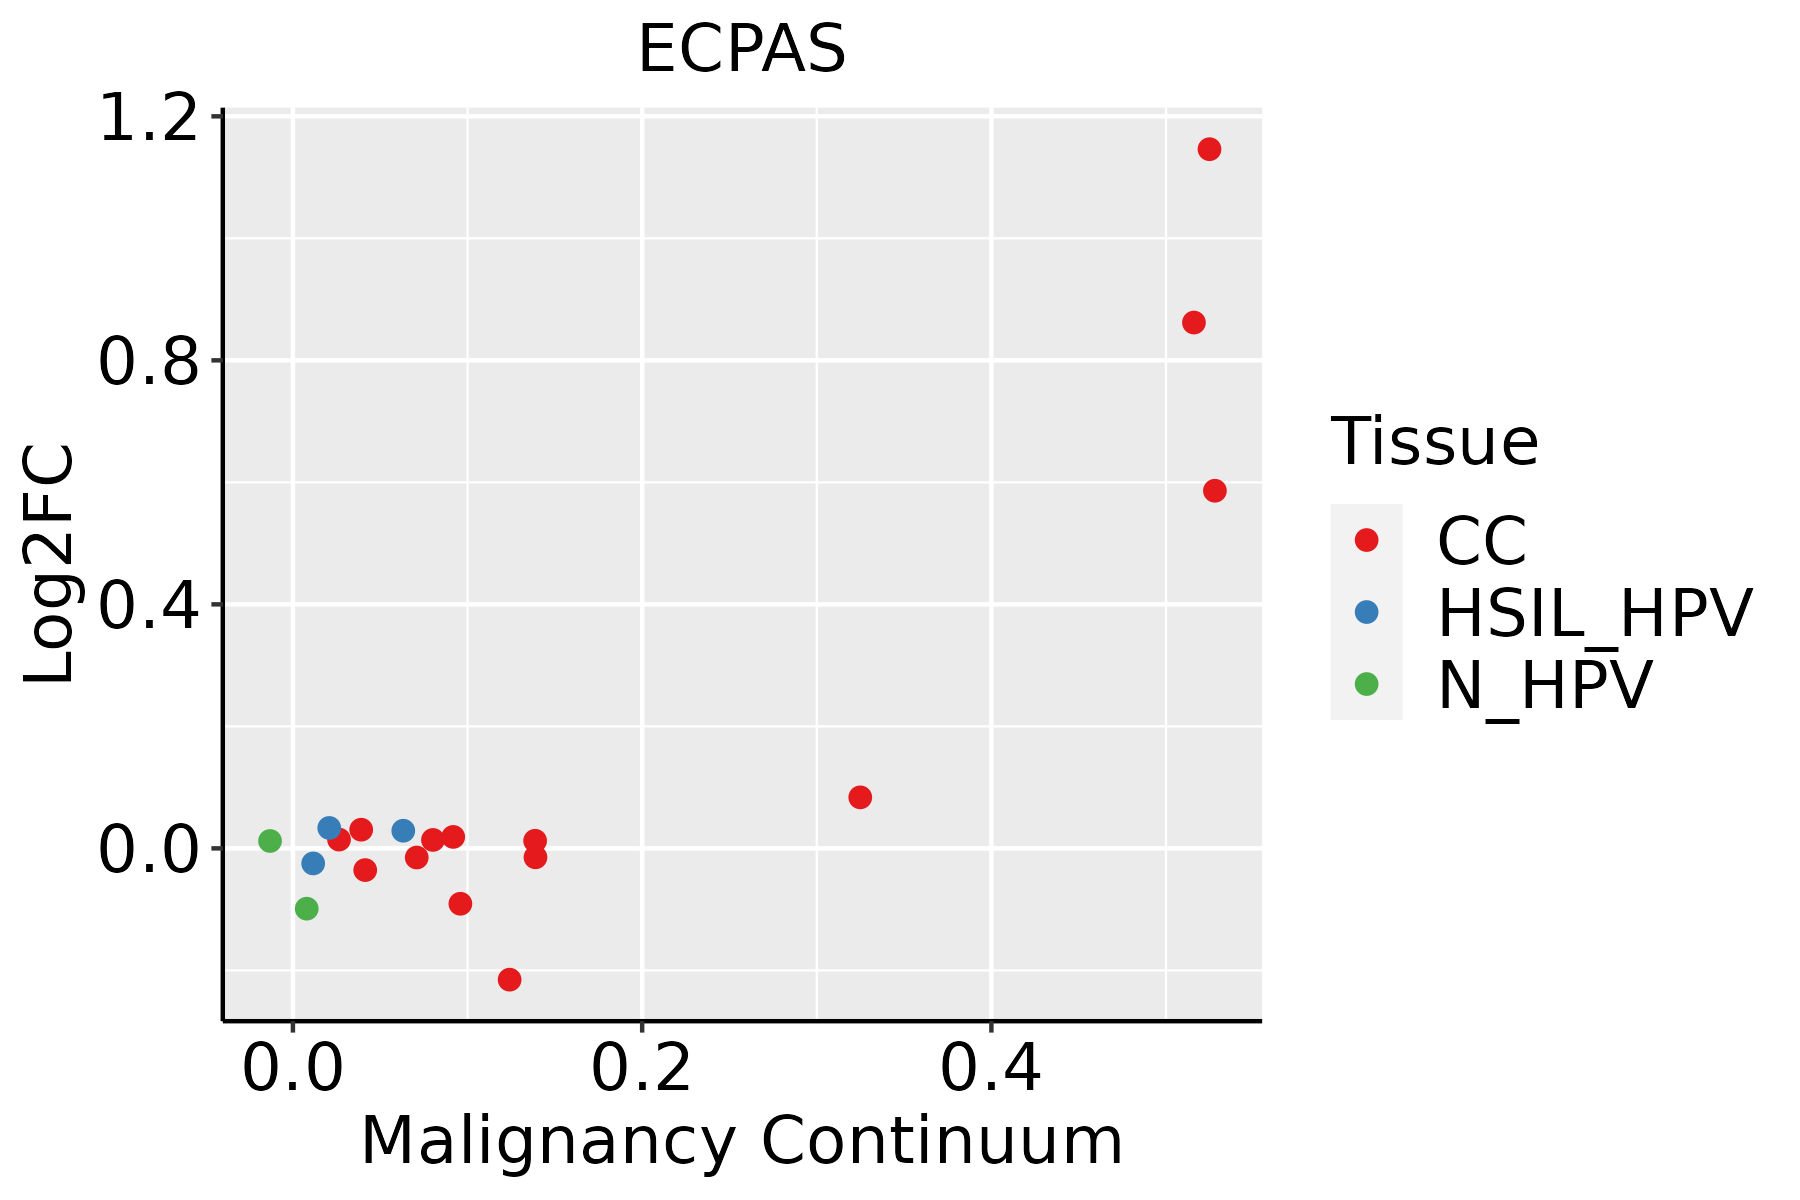 | CC: Cervix cancer |
| HSIL_HPV: HPV-infected high-grade squamous intraepithelial lesions | ||
| N_HPV: HPV-infected normal cervix | ||
| Colorectum (GSE201348) |  | FAP: Familial adenomatous polyposis |
| CRC: Colorectal cancer | ||
| Colorectum (HTA11) |  | AD: Adenomas |
| SER: Sessile serrated lesions | ||
| MSI-H: Microsatellite-high colorectal cancer | ||
| MSS: Microsatellite stable colorectal cancer | ||
| Liver | 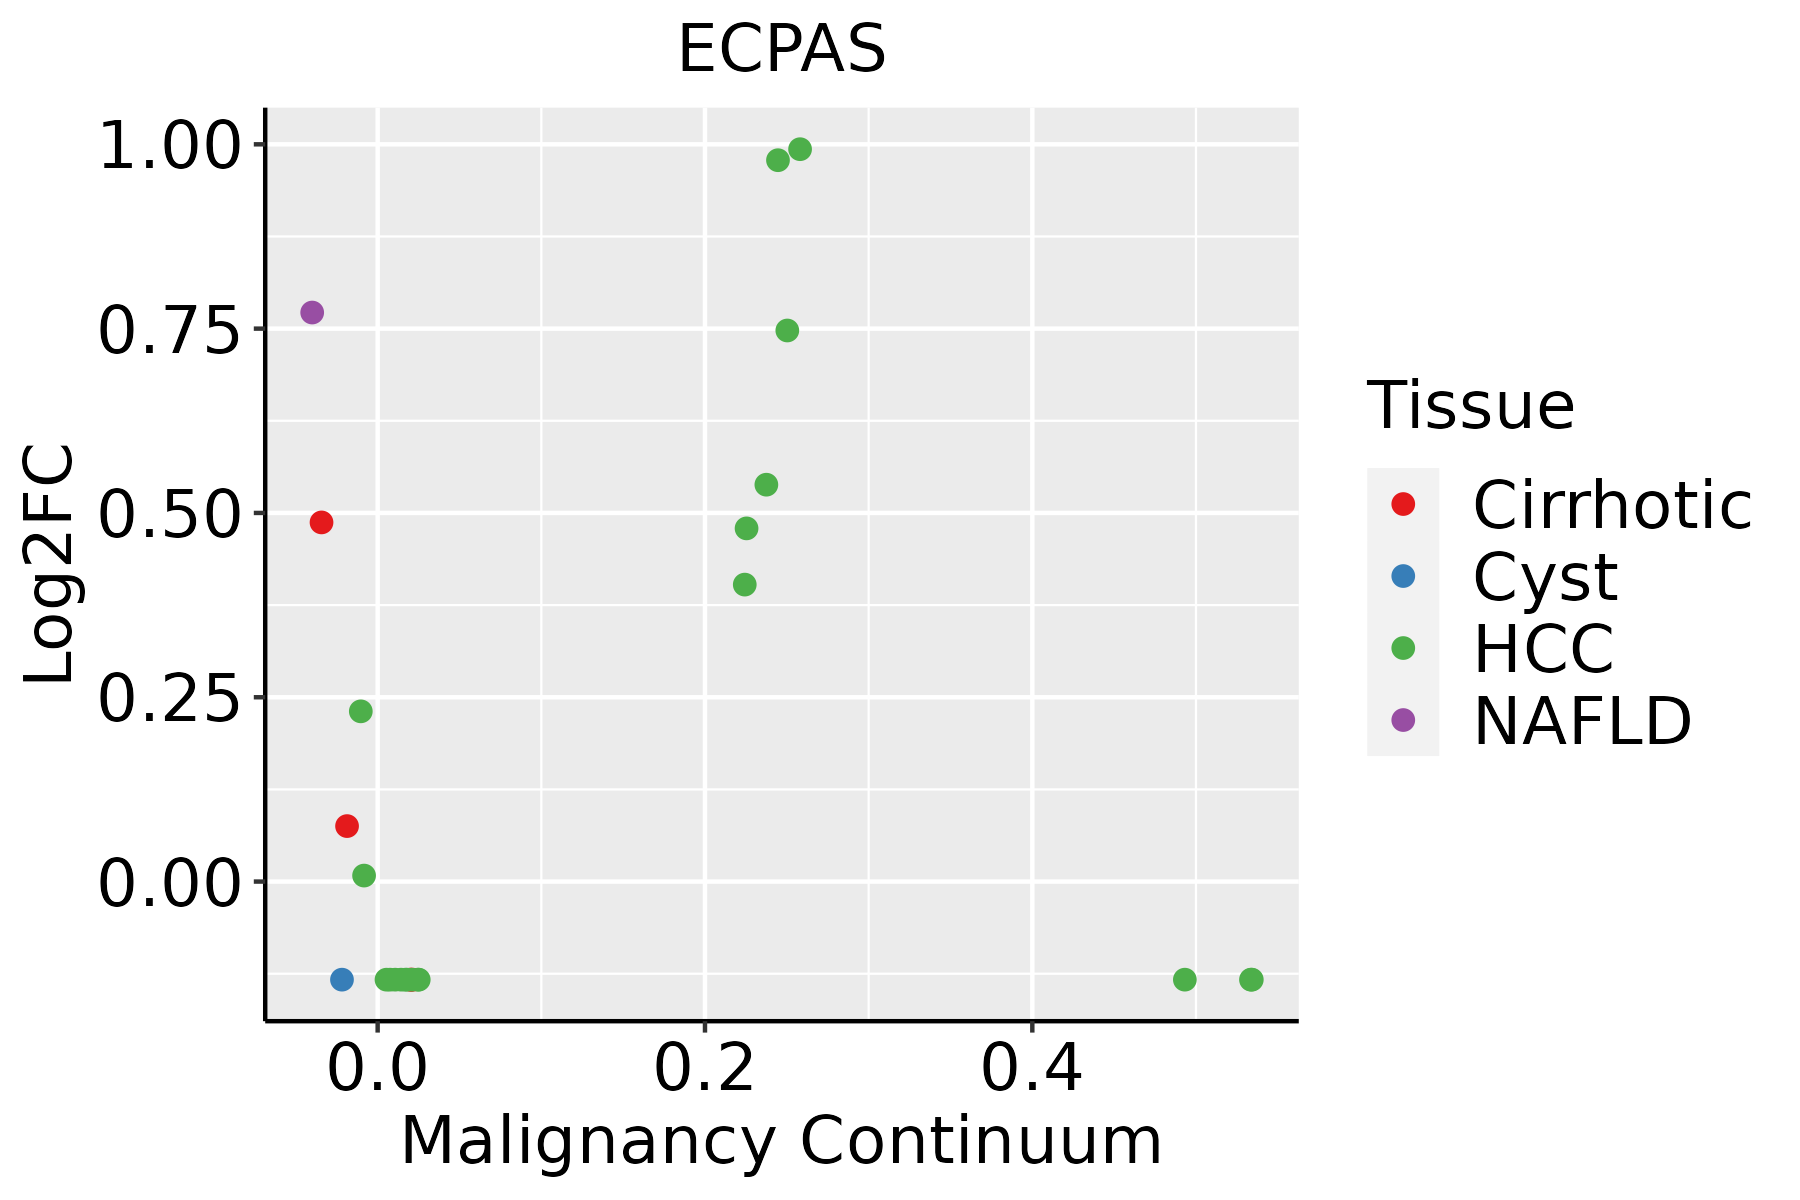 | HCC: Hepatocellular carcinoma |
| NAFLD: Non-alcoholic fatty liver disease | ||
| Lung | 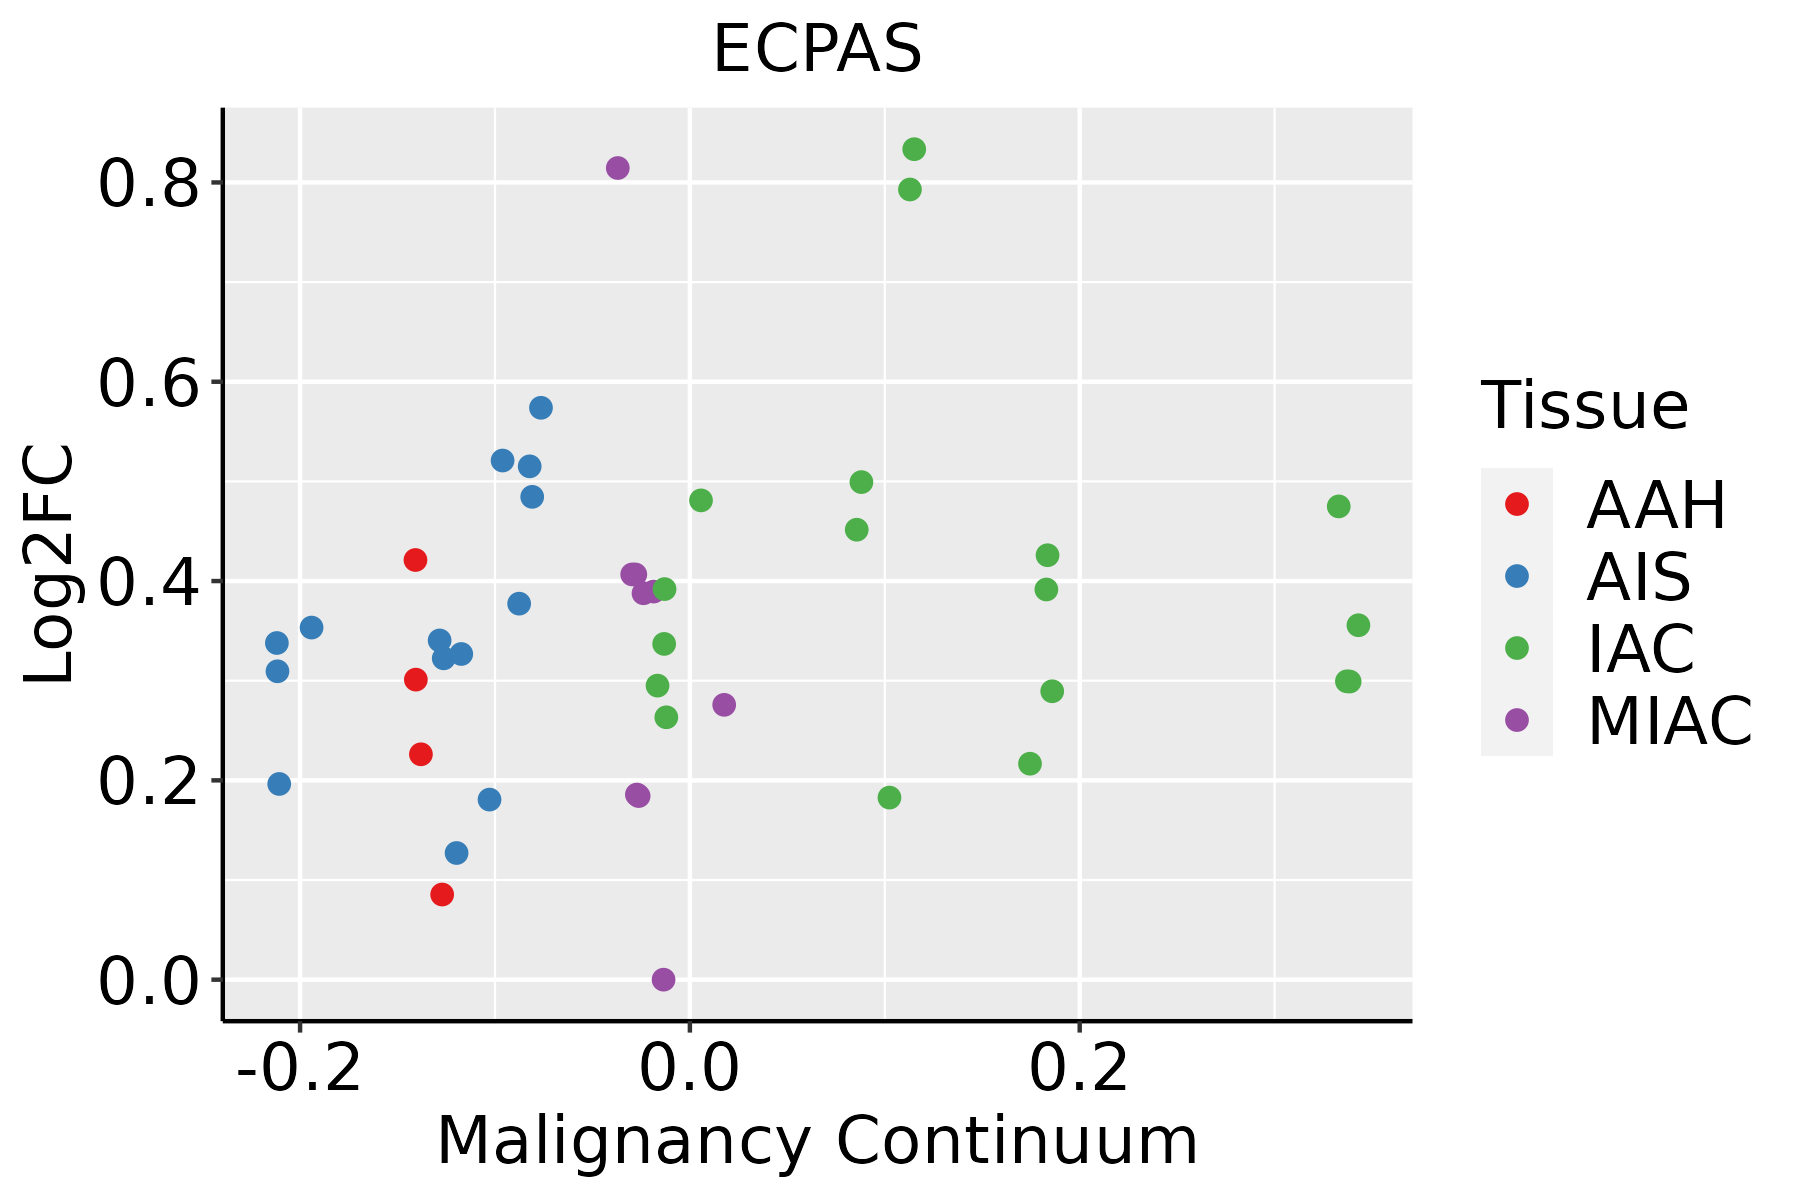 | AAH: Atypical adenomatous hyperplasia |
| AIS: Adenocarcinoma in situ | ||
| IAC: Invasive lung adenocarcinoma | ||
| MIA: Minimally invasive adenocarcinoma | ||
| Prostate | 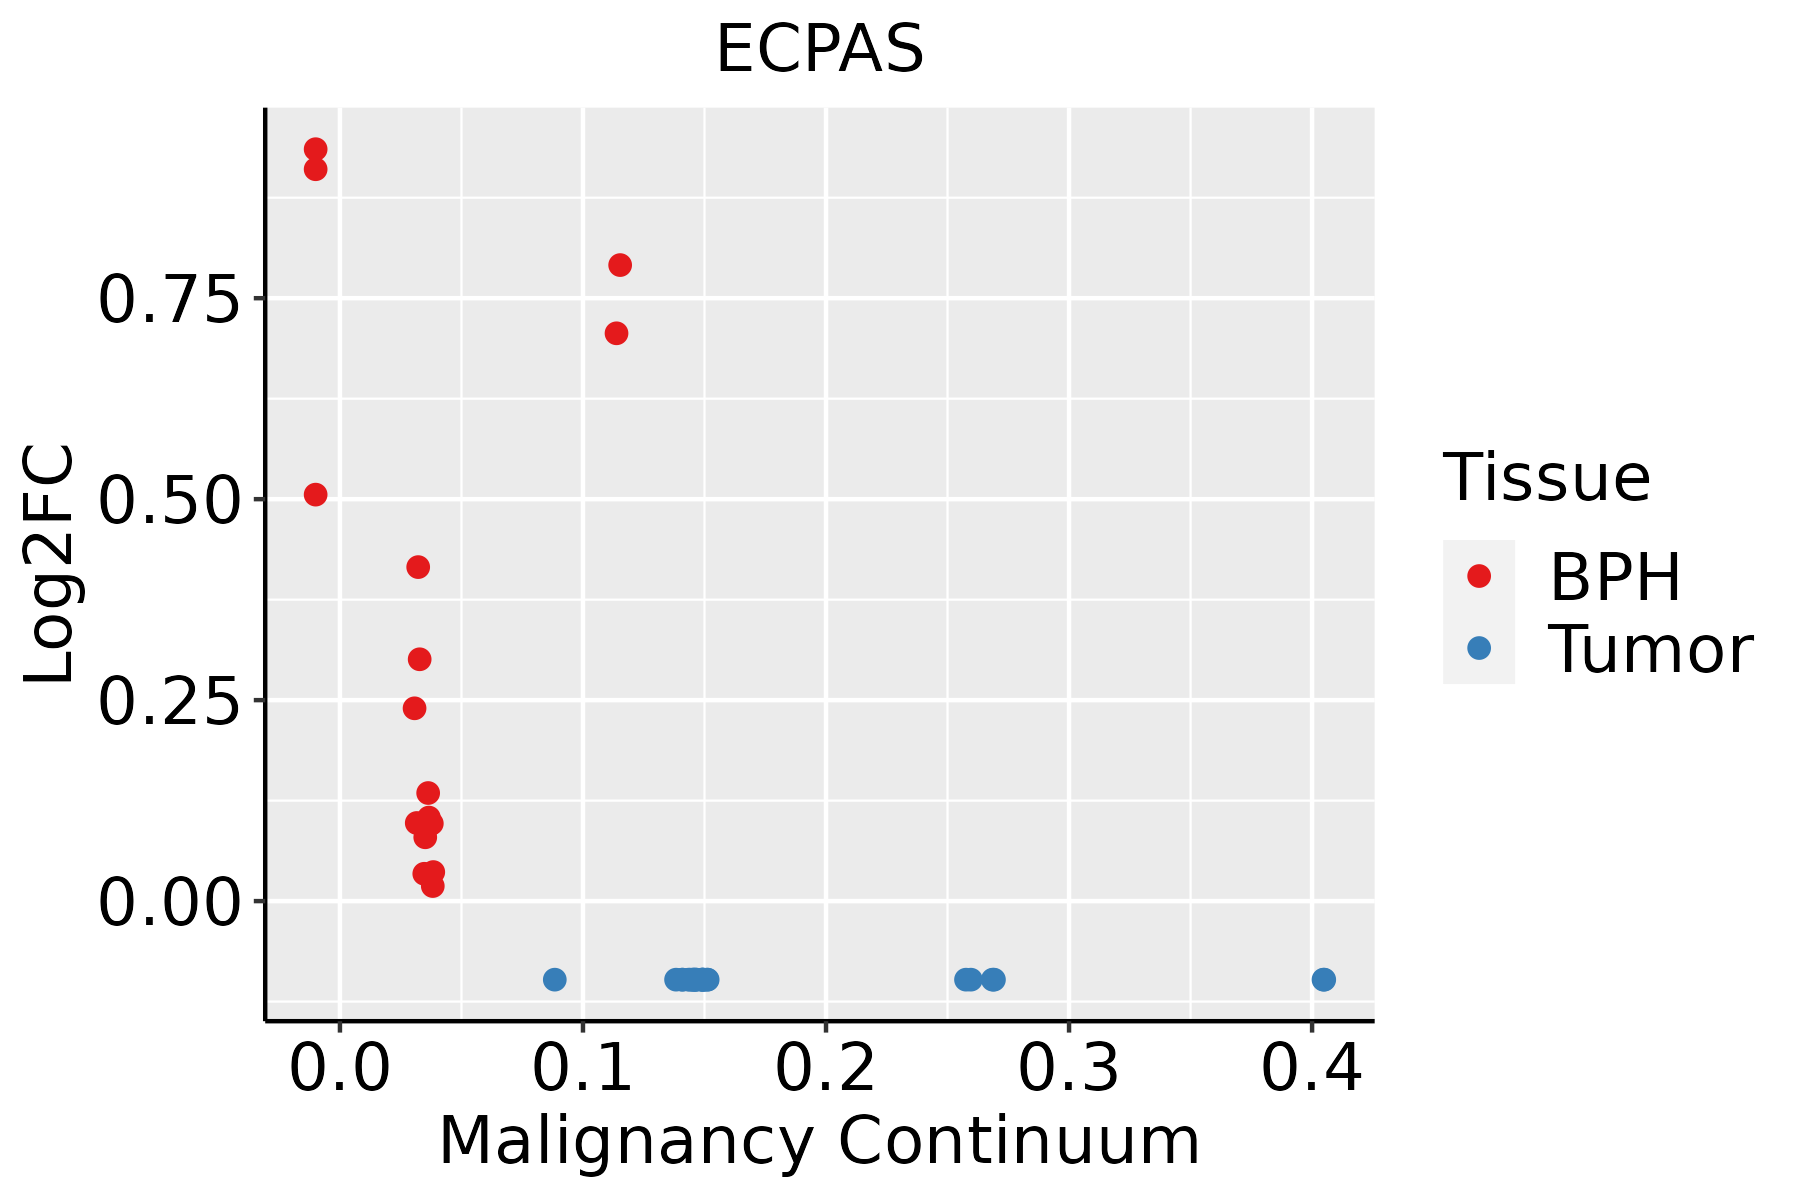 | BPH: Benign Prostatic Hyperplasia |
| Thyroid |  | ATC: Anaplastic thyroid cancer |
| HT: Hashimoto's thyroiditis | ||
| PTC: Papillary thyroid cancer |
| ∗log2FC in expression of this searched gene in stem-like cells from each diseased tissue sample relative to stem-like cells in normal samples in each tissue plotted against the malignancy continuum. Samples are colored based on if they are from different disease stage. |
Top |
Malignant transformation related pathway analysis |
| Find out the enriched GO biological processes and KEGG pathways involved in transition from healthy to precancer to cancer |
| Tissue | Disease Stage | Enriched GO biological Processes |
| Colorectum | AD |  |
| Colorectum | SER |  |
| Colorectum | MSS |  |
| Colorectum | MSI-H |  |
| Colorectum | FAP |  |
| ∗Top 15 enriched GO BP terms are showed in the bar plot of each disease state in each tissue. Each row represents a significant GO biological process which is colored according to the -log10(p.adjust). |
| Page: 1 2 3 4 5 6 7 8 9 |
| GO ID | Tissue | Disease Stage | Description | Gene Ratio | Bg Ratio | pvalue | p.adjust | Count |
| GO:001049810 | Cervix | CC | proteasomal protein catabolic process | 111/2311 | 490/18723 | 8.98e-11 | 1.58e-08 | 111 |
| GO:004316110 | Cervix | CC | proteasome-mediated ubiquitin-dependent protein catabolic process | 91/2311 | 412/18723 | 1.65e-08 | 1.25e-06 | 91 |
| GO:003497610 | Cervix | CC | response to endoplasmic reticulum stress | 57/2311 | 256/18723 | 5.81e-06 | 1.42e-04 | 57 |
| GO:003497623 | Cervix | N_HPV | response to endoplasmic reticulum stress | 20/534 | 256/18723 | 4.88e-05 | 1.13e-03 | 20 |
| GO:001049815 | Cervix | N_HPV | proteasomal protein catabolic process | 27/534 | 490/18723 | 9.06e-04 | 1.08e-02 | 27 |
| GO:004316115 | Cervix | N_HPV | proteasome-mediated ubiquitin-dependent protein catabolic process | 21/534 | 412/18723 | 7.76e-03 | 4.97e-02 | 21 |
| GO:0010498 | Colorectum | AD | proteasomal protein catabolic process | 174/3918 | 490/18723 | 3.18e-14 | 7.66e-12 | 174 |
| GO:0043161 | Colorectum | AD | proteasome-mediated ubiquitin-dependent protein catabolic process | 141/3918 | 412/18723 | 1.77e-10 | 1.68e-08 | 141 |
| GO:0034976 | Colorectum | AD | response to endoplasmic reticulum stress | 90/3918 | 256/18723 | 8.48e-08 | 4.28e-06 | 90 |
| GO:0036503 | Colorectum | AD | ERAD pathway | 34/3918 | 107/18723 | 5.57e-03 | 3.63e-02 | 34 |
| GO:00104981 | Colorectum | SER | proteasomal protein catabolic process | 132/2897 | 490/18723 | 3.08e-11 | 5.55e-09 | 132 |
| GO:00349761 | Colorectum | SER | response to endoplasmic reticulum stress | 74/2897 | 256/18723 | 3.01e-08 | 2.05e-06 | 74 |
| GO:00431611 | Colorectum | SER | proteasome-mediated ubiquitin-dependent protein catabolic process | 105/2897 | 412/18723 | 7.48e-08 | 4.70e-06 | 105 |
| GO:00365031 | Colorectum | SER | ERAD pathway | 28/2897 | 107/18723 | 2.92e-03 | 2.59e-02 | 28 |
| GO:00104982 | Colorectum | MSS | proteasomal protein catabolic process | 157/3467 | 490/18723 | 2.39e-13 | 5.25e-11 | 157 |
| GO:00431612 | Colorectum | MSS | proteasome-mediated ubiquitin-dependent protein catabolic process | 127/3467 | 412/18723 | 7.70e-10 | 6.32e-08 | 127 |
| GO:00349762 | Colorectum | MSS | response to endoplasmic reticulum stress | 81/3467 | 256/18723 | 2.65e-07 | 1.10e-05 | 81 |
| GO:00431614 | Colorectum | FAP | proteasome-mediated ubiquitin-dependent protein catabolic process | 98/2622 | 412/18723 | 5.41e-08 | 4.20e-06 | 98 |
| GO:00104984 | Colorectum | FAP | proteasomal protein catabolic process | 110/2622 | 490/18723 | 2.12e-07 | 1.26e-05 | 110 |
| GO:00349764 | Colorectum | FAP | response to endoplasmic reticulum stress | 61/2622 | 256/18723 | 1.58e-05 | 4.10e-04 | 61 |
| Page: 1 2 3 4 |
| Pathway ID | Tissue | Disease Stage | Description | Gene Ratio | Bg Ratio | pvalue | p.adjust | qvalue | Count |
| Page: 1 |
Top |
Cell-cell communication analysis |
| Identification of potential cell-cell interactions between two cell types and their ligand-receptor pairs for different disease states |
| Ligand | Receptor | LRpair | Pathway | Tissue | Disease Stage |
| Page: 1 |
Top |
Single-cell gene regulatory network inference analysis |
| Find out the significant the regulons (TFs) and the target genes of each regulon across cell types for different disease states |
| TF | Cell Type | Tissue | Disease Stage | Target Gene | RSS | Regulon Activity |
| ∗The dot plots of a searched regulon are shown for all cell subpopulations in each disease state of each tissue based on the regulon specific score inferred using pySCENIC and by calculating the average expression. |
| Page: 1 |
Top |
Somatic mutation of malignant transformation related genes |
| Annotation of somatic variants for genes involved in malignant transformation |
| Hugo Symbol | Variant Class | Variant Classification | dbSNP RS | HGVSc | HGVSp | HGVSp Short | SWISSPROT | BIOTYPE | SIFT | PolyPhen | Tumor Sample Barcode | Tissue | Histology | Sex | Age | Stage | Therapy Types | Drugs | Outcome |
| Page: 1 |
Top |
Related drugs of malignant transformation related genes |
| Identification of chemicals and drugs interact with genes involved in malignant transfromation |
| (DGIdb 4.0) |
| Entrez ID | Symbol | Category | Interaction Types | Drug Claim Name | Drug Name | PMIDs |
| Page: 1 |

Copyright 2023-Present -The University of Texas Health Science Center at Houston |