| Tissue | Expression Dynamics | Abbreviation |
| Breast | 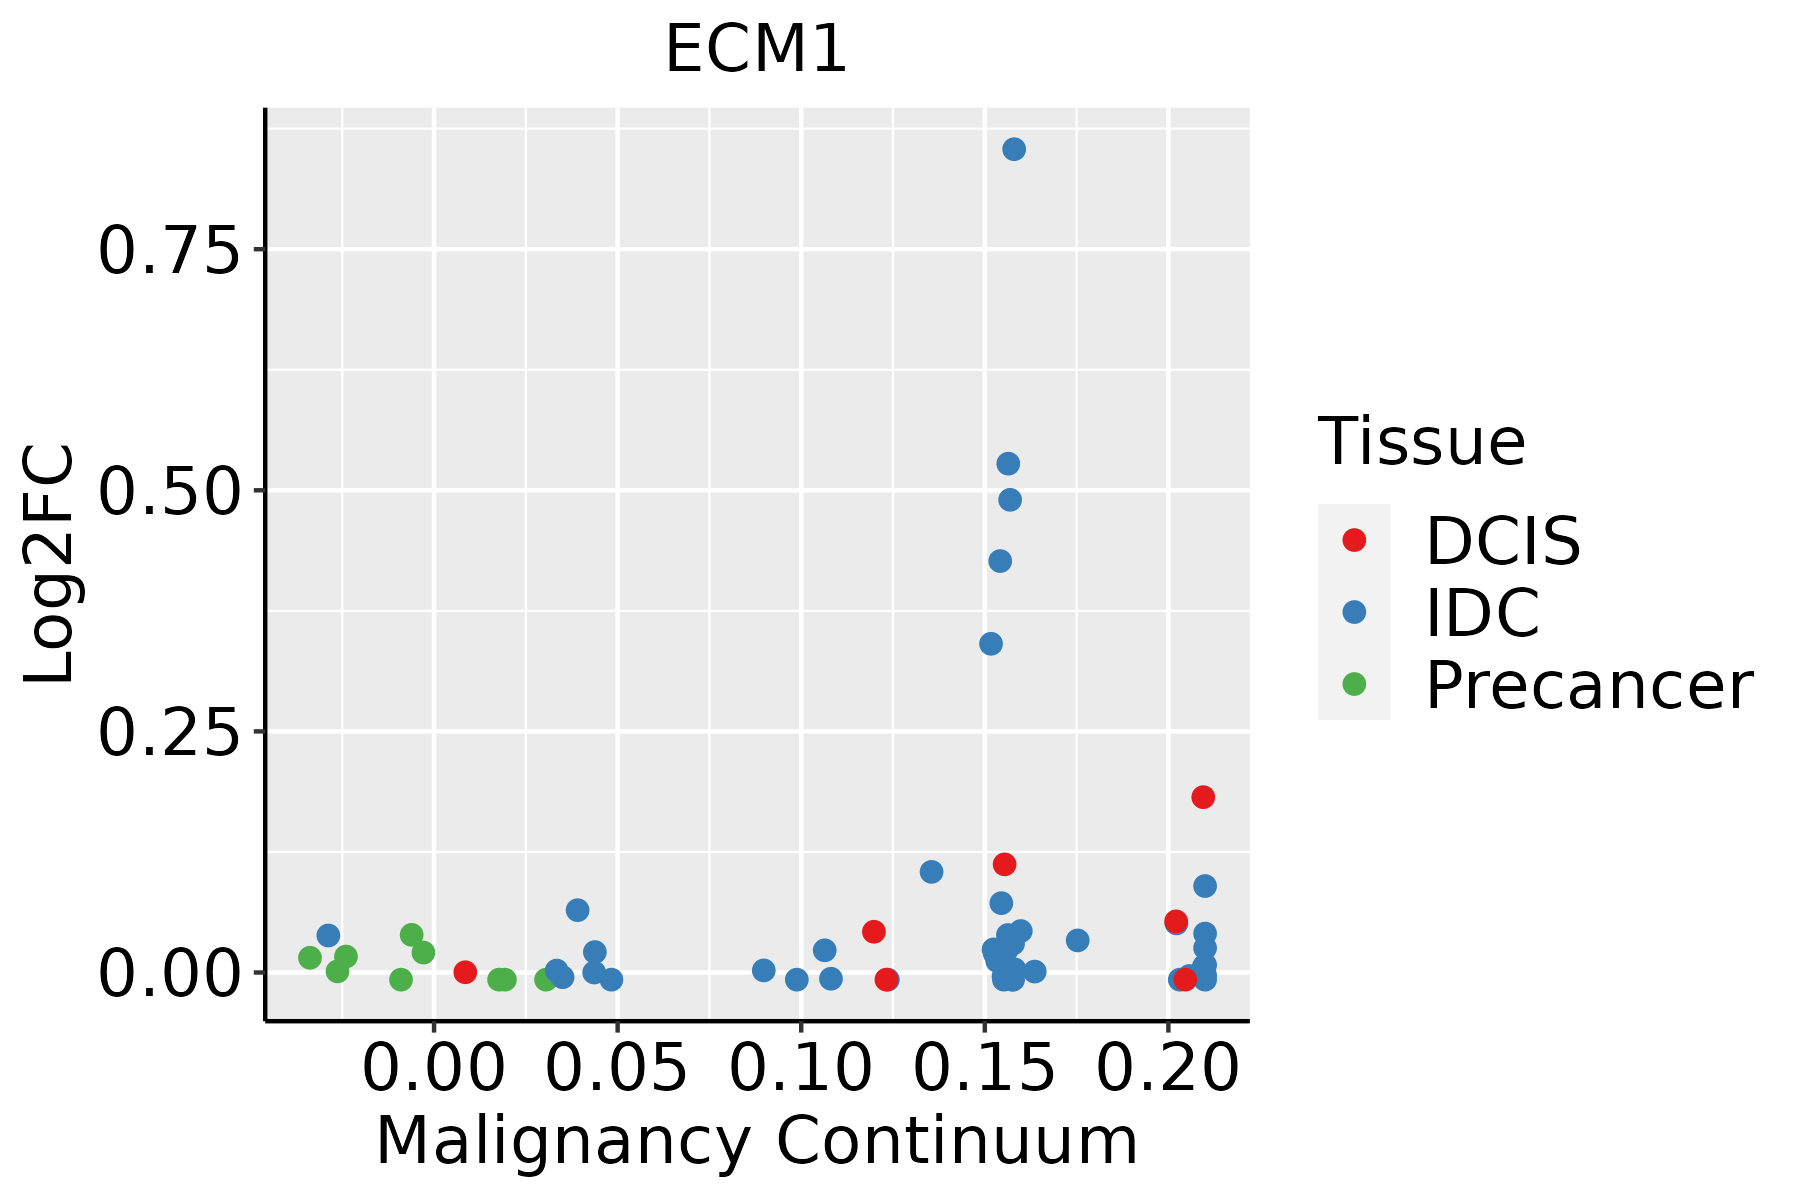 | IDC: Invasive ductal carcinoma |
| DCIS: Ductal carcinoma in situ |
| Precancer(BRCA1-mut): Precancerous lesion from BRCA1 mutation carriers |
| Cervix | 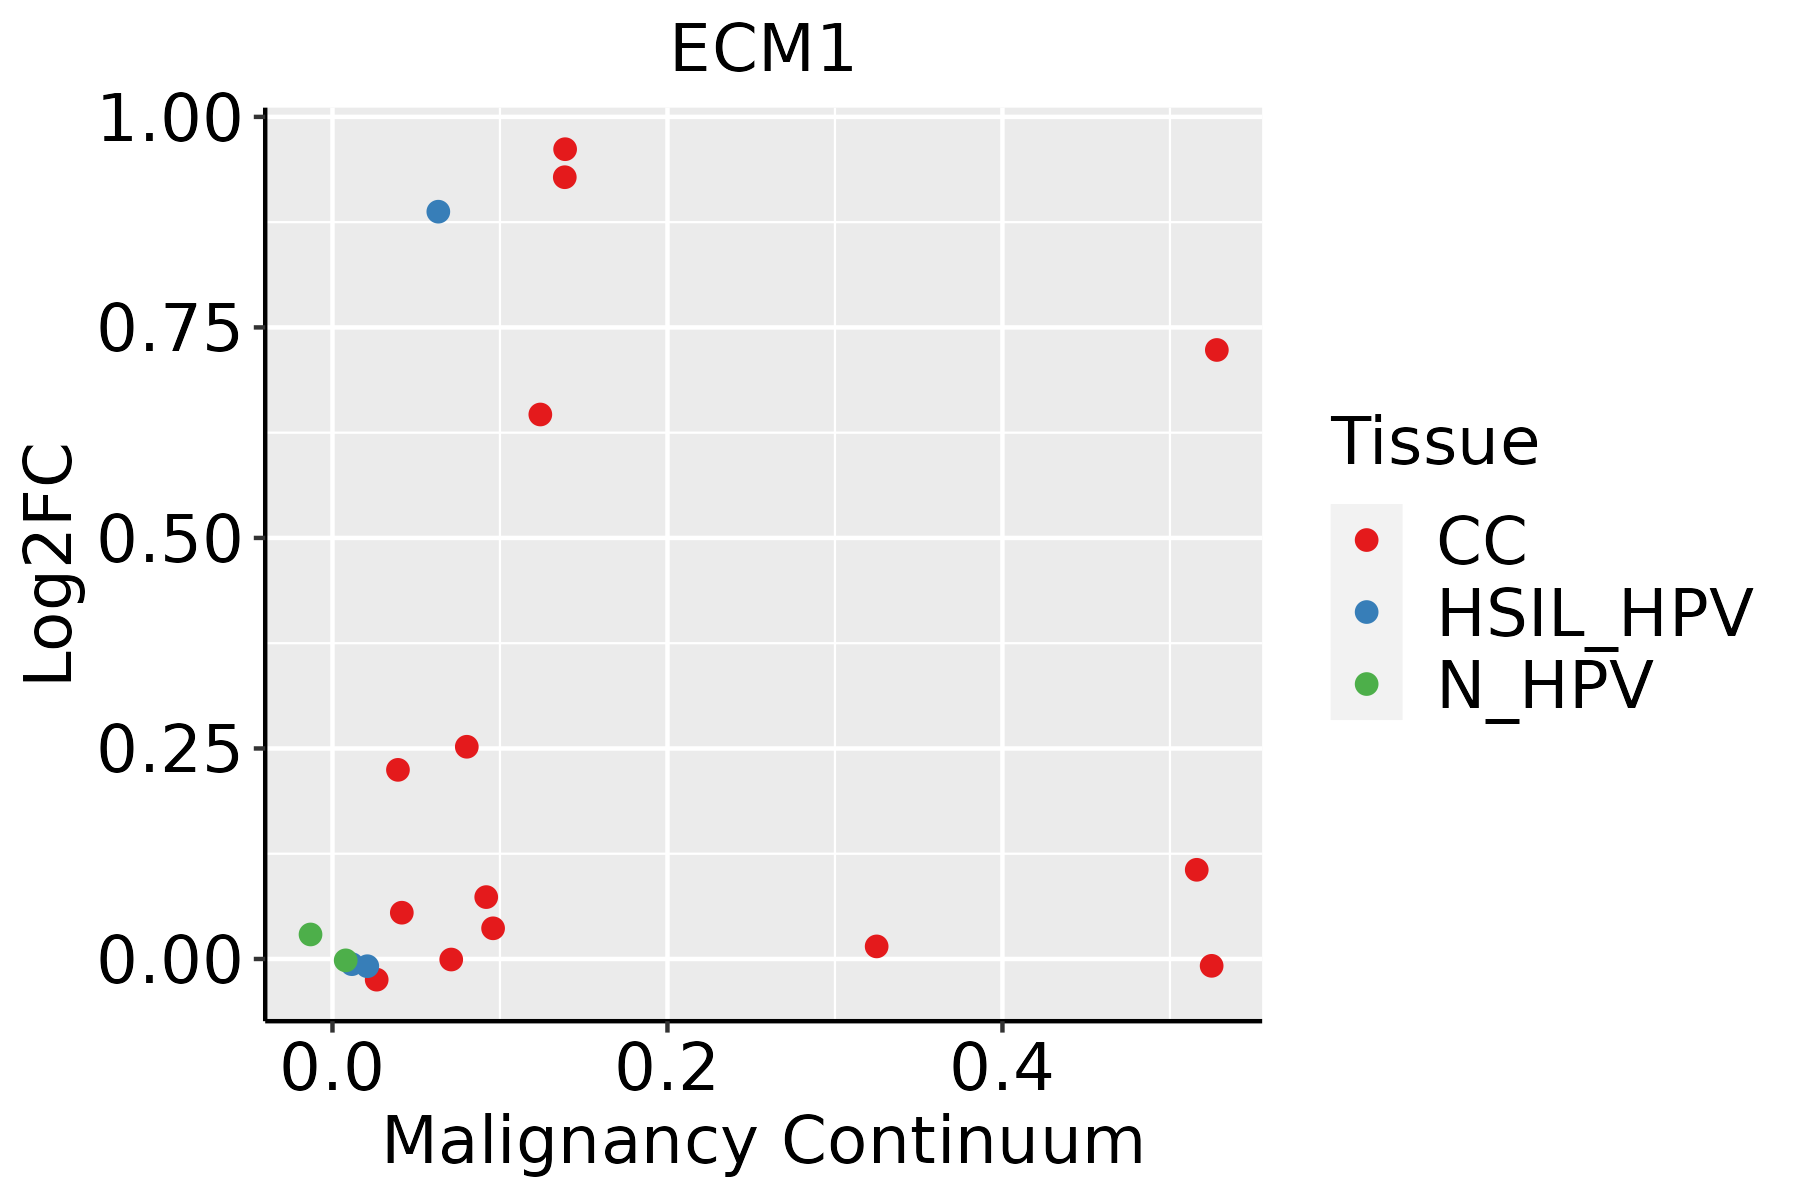 | CC: Cervix cancer |
| HSIL_HPV: HPV-infected high-grade squamous intraepithelial lesions |
| N_HPV: HPV-infected normal cervix |
| Endometrium | 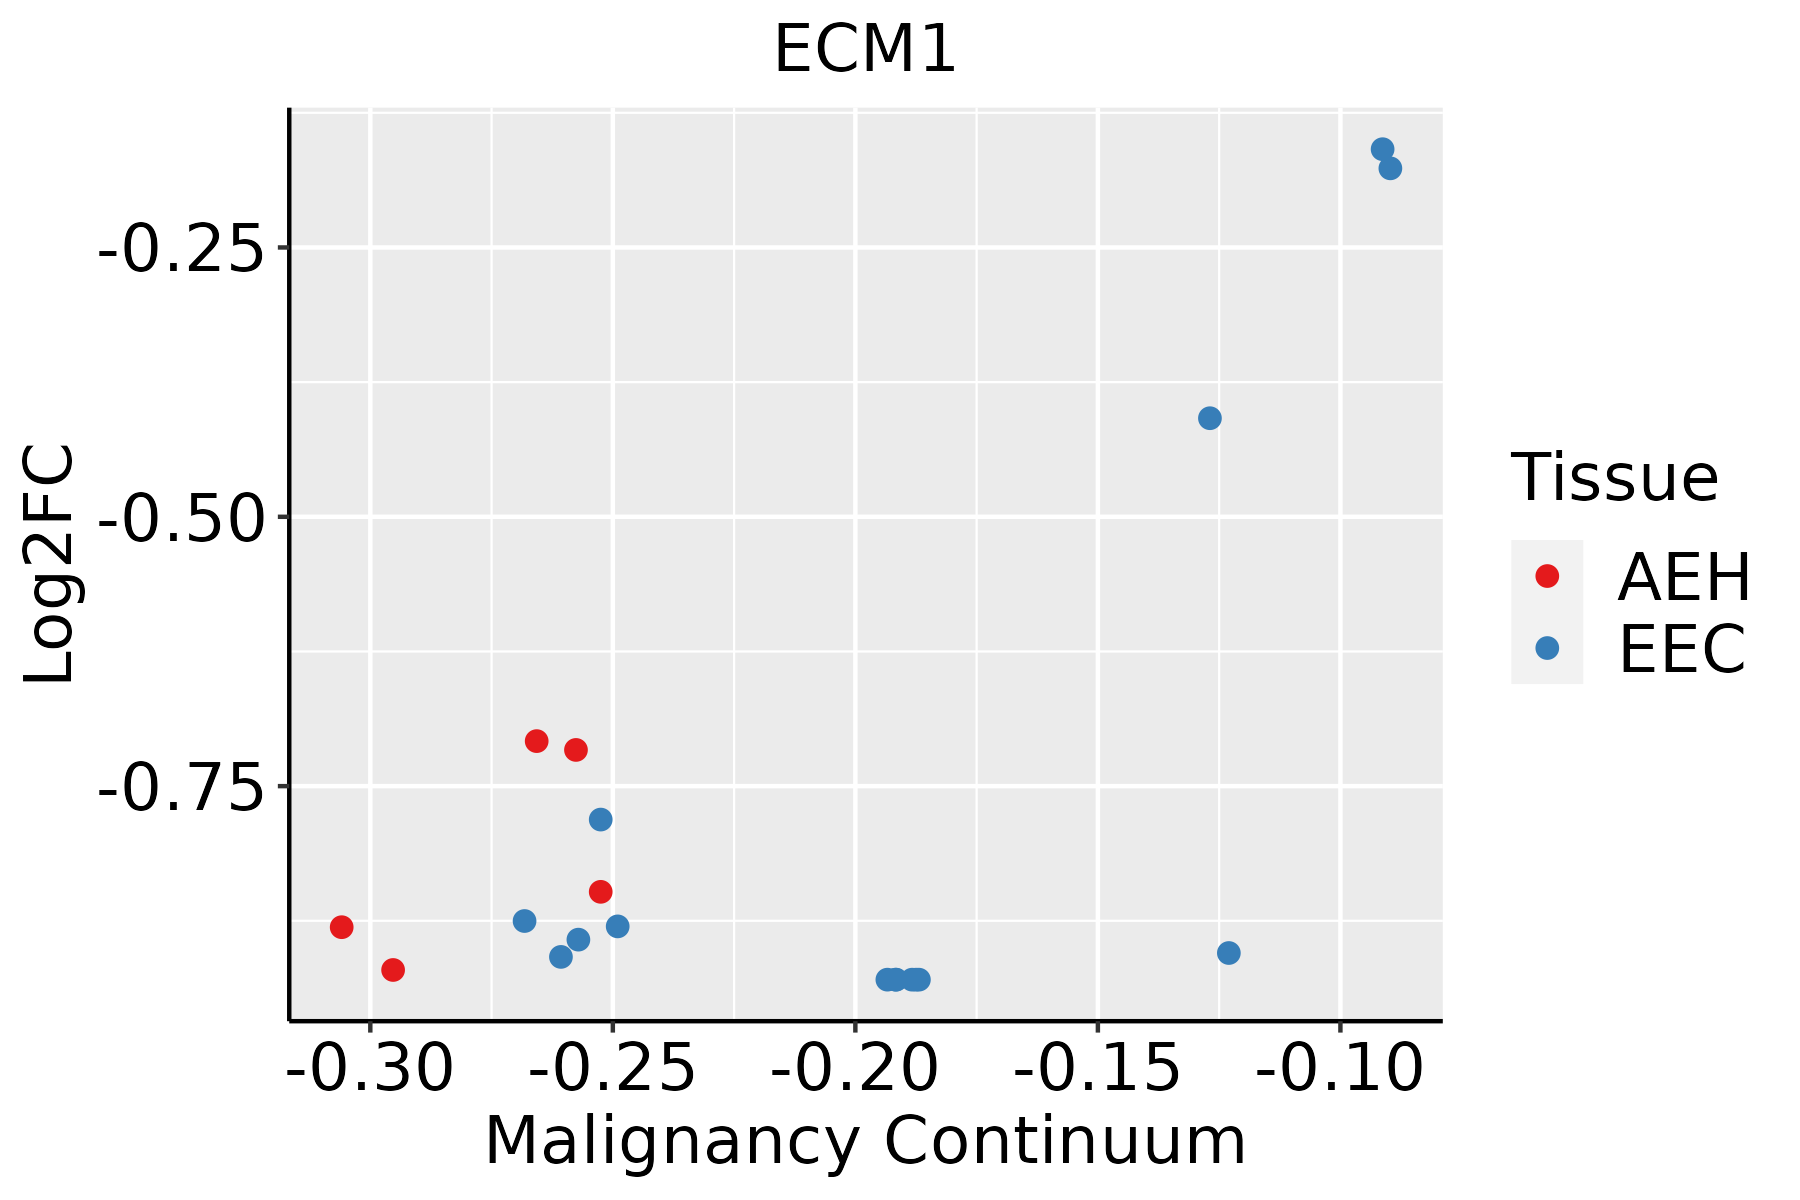 | AEH: Atypical endometrial hyperplasia |
| EEC: Endometrioid Cancer |
| Esophagus | 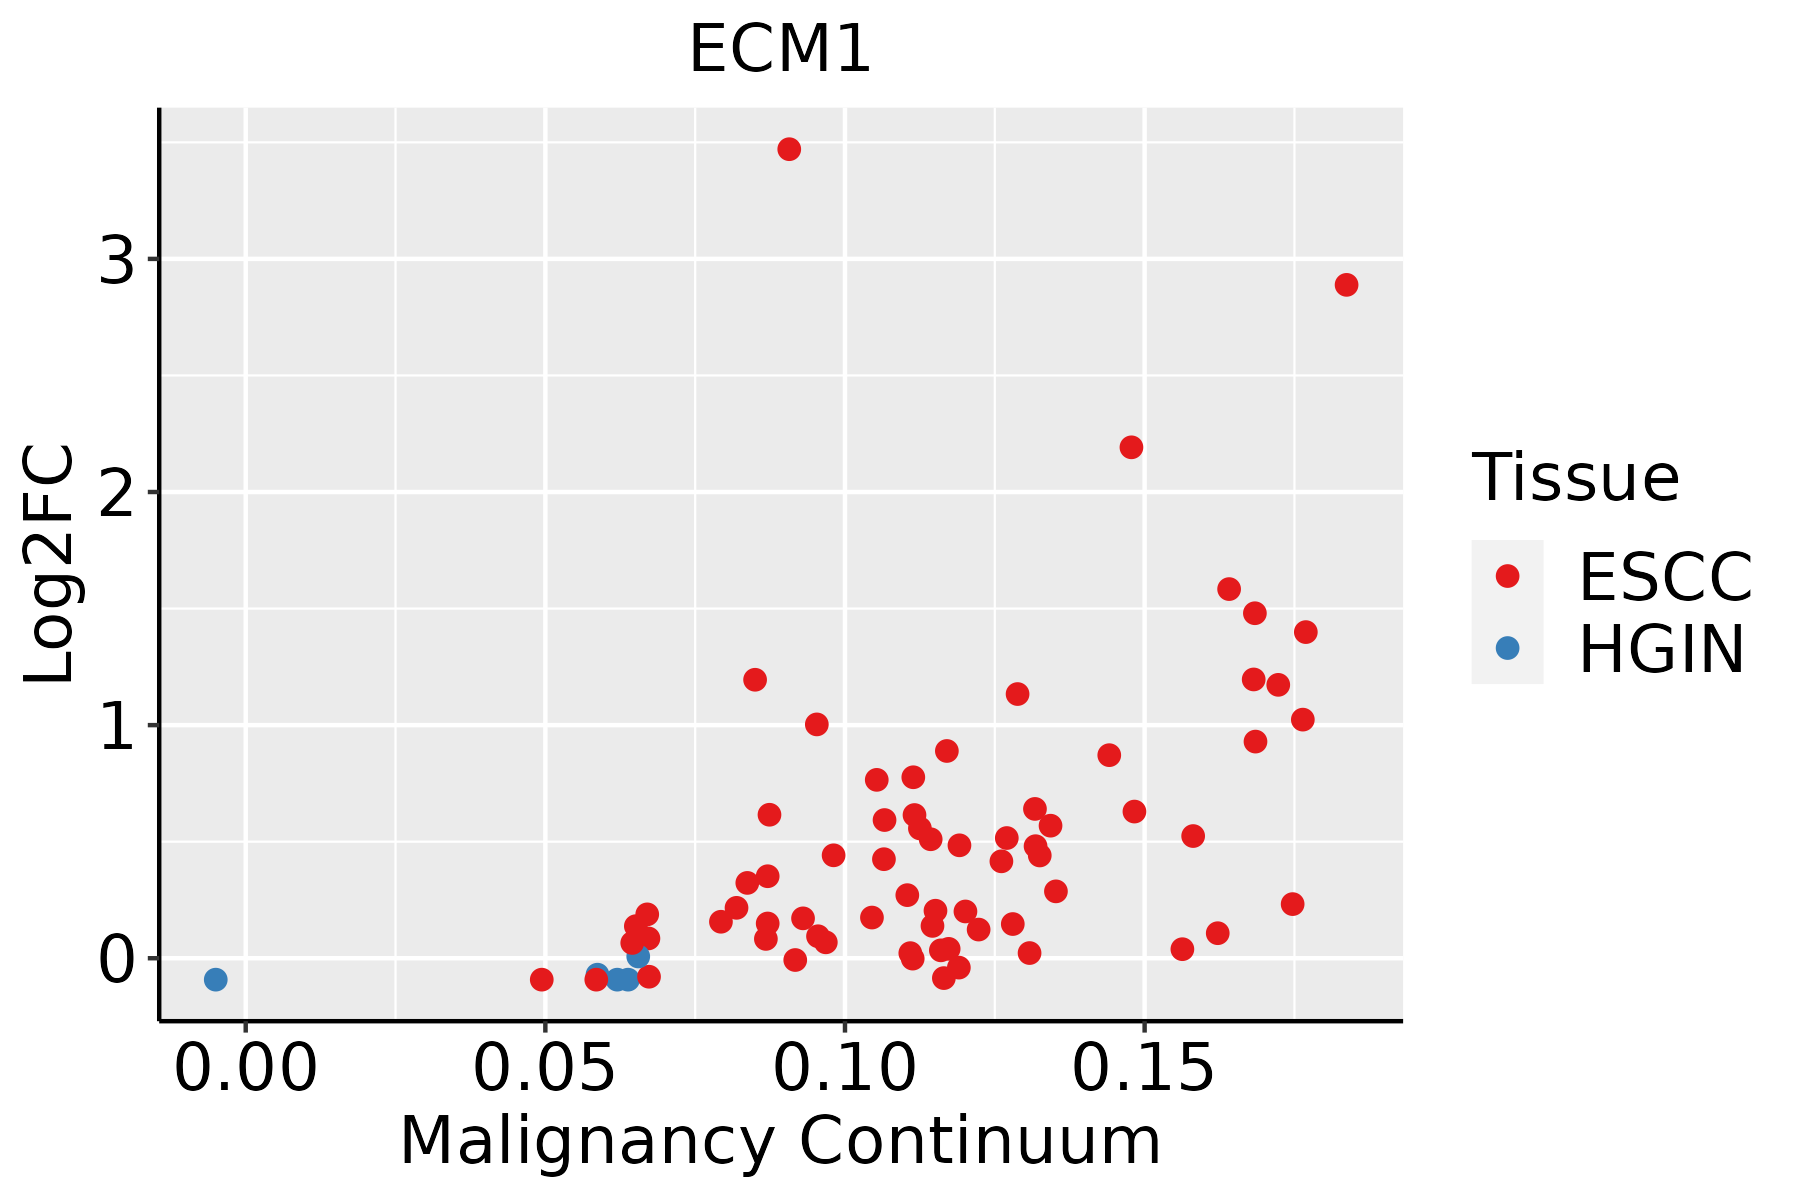 | ESCC: Esophageal squamous cell carcinoma |
| HGIN: High-grade intraepithelial neoplasias |
| LGIN: Low-grade intraepithelial neoplasias |
| Oral Cavity | 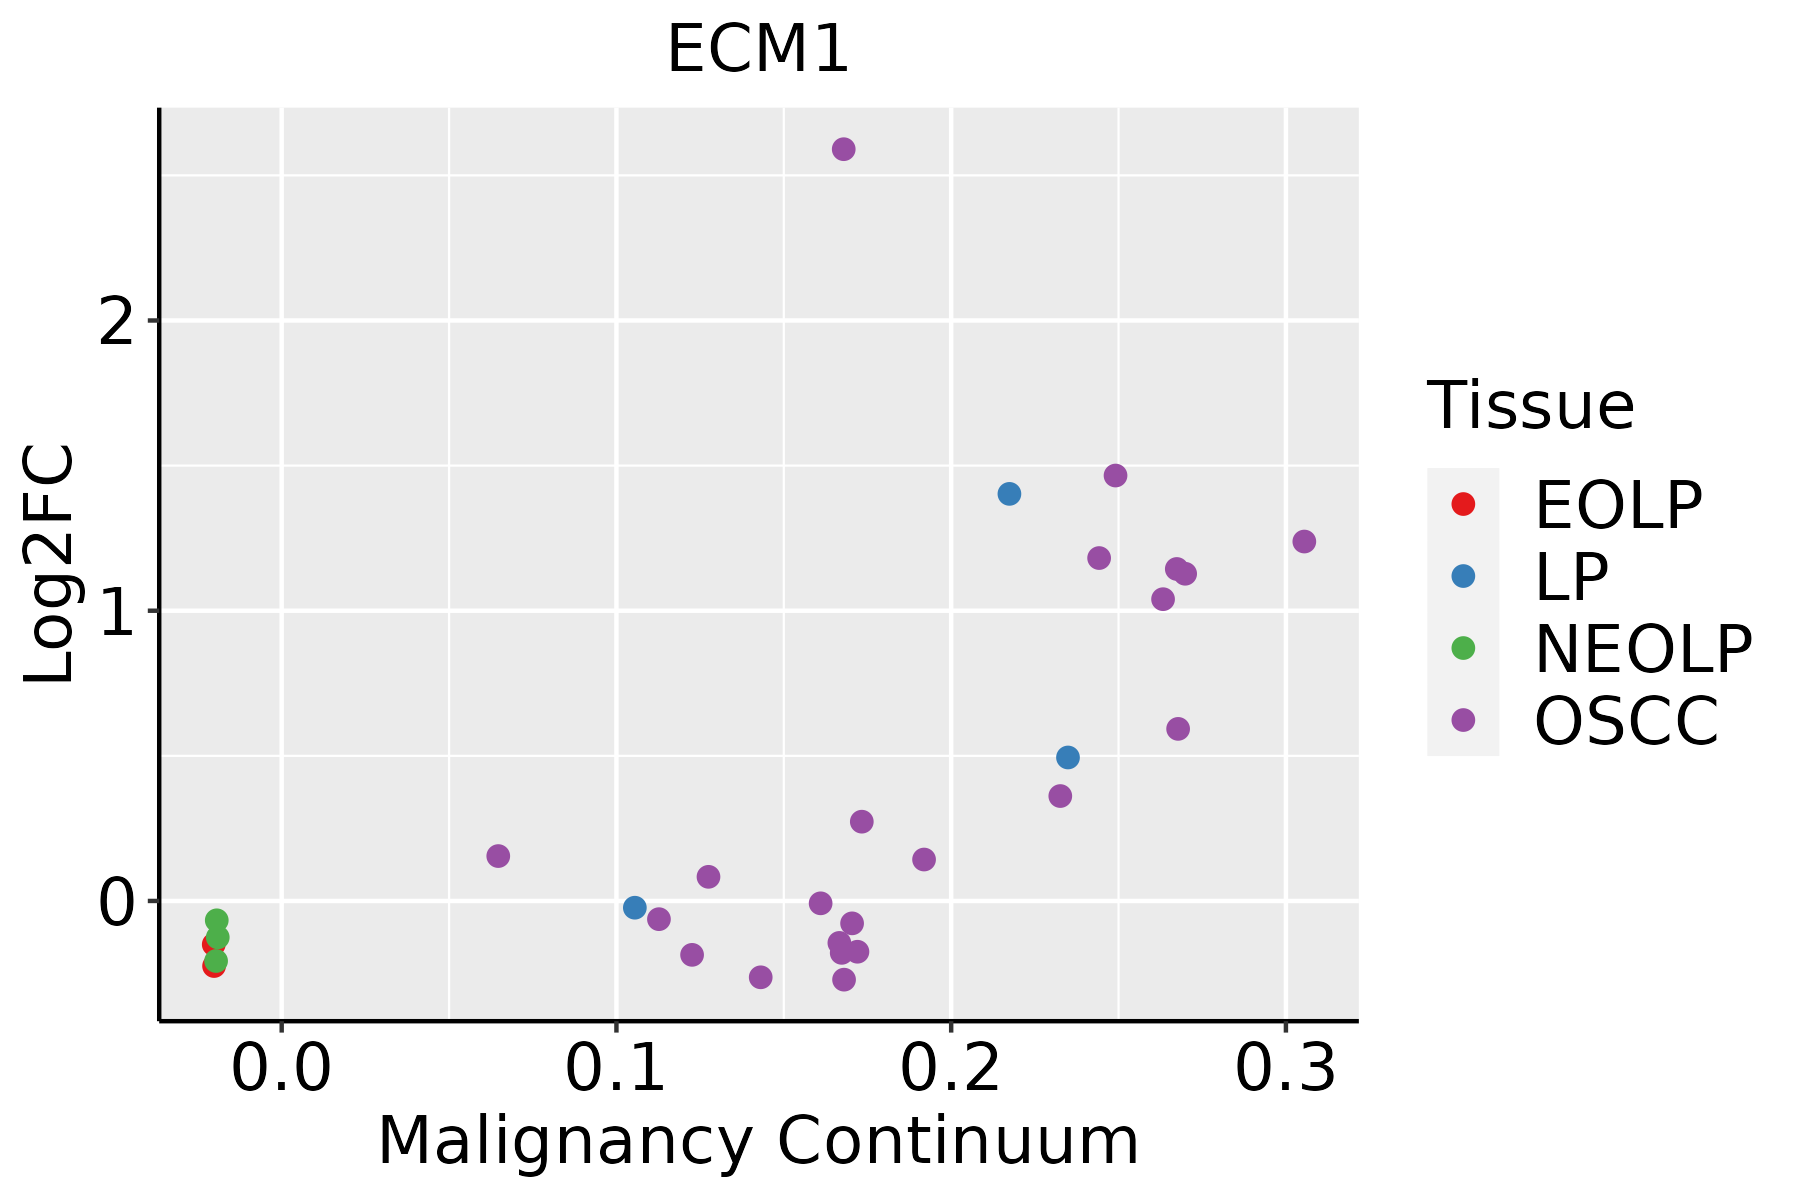 | EOLP: Erosive Oral lichen planus |
| LP: leukoplakia |
| NEOLP: Non-erosive oral lichen planus |
| OSCC: Oral squamous cell carcinoma |
| Skin | 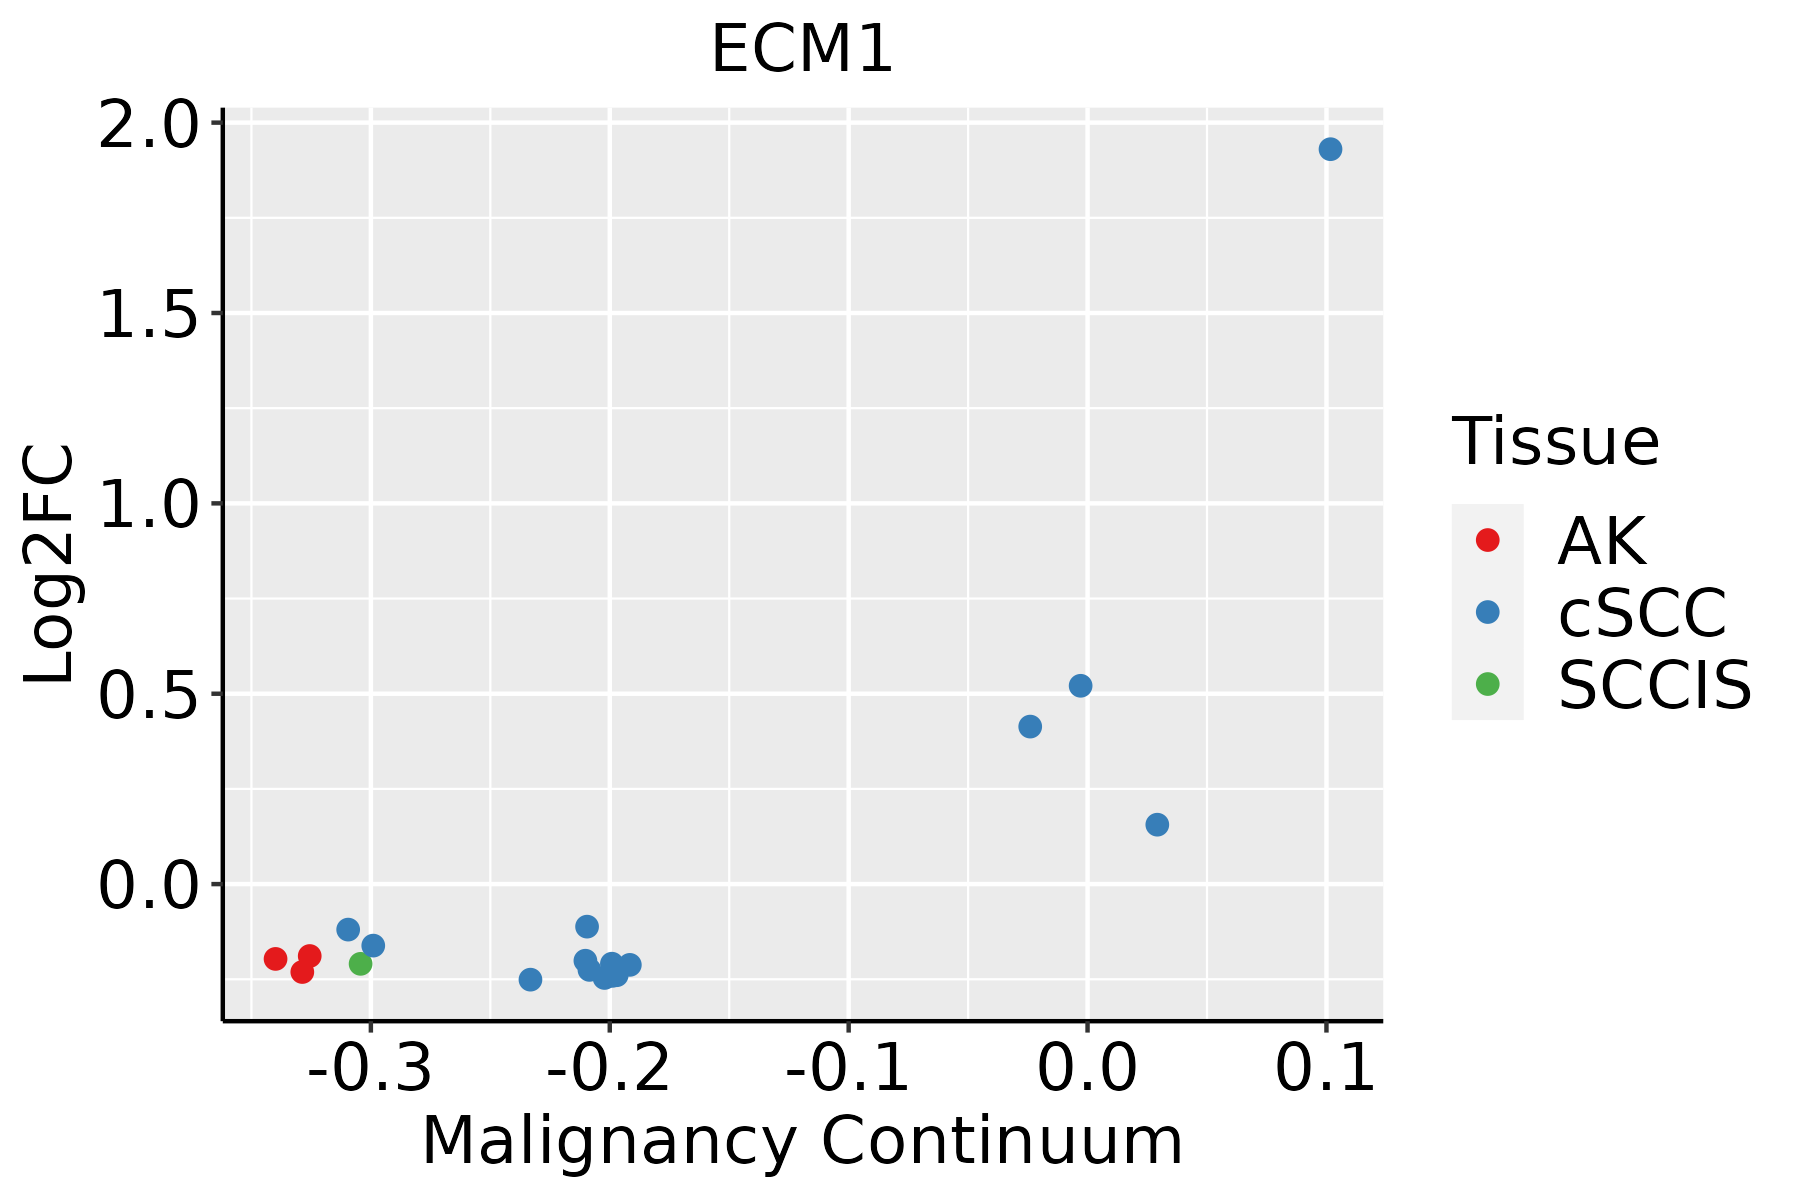 | AK: Actinic keratosis |
| cSCC: Cutaneous squamous cell carcinoma |
| SCCIS:squamous cell carcinoma in situ |
| Thyroid | 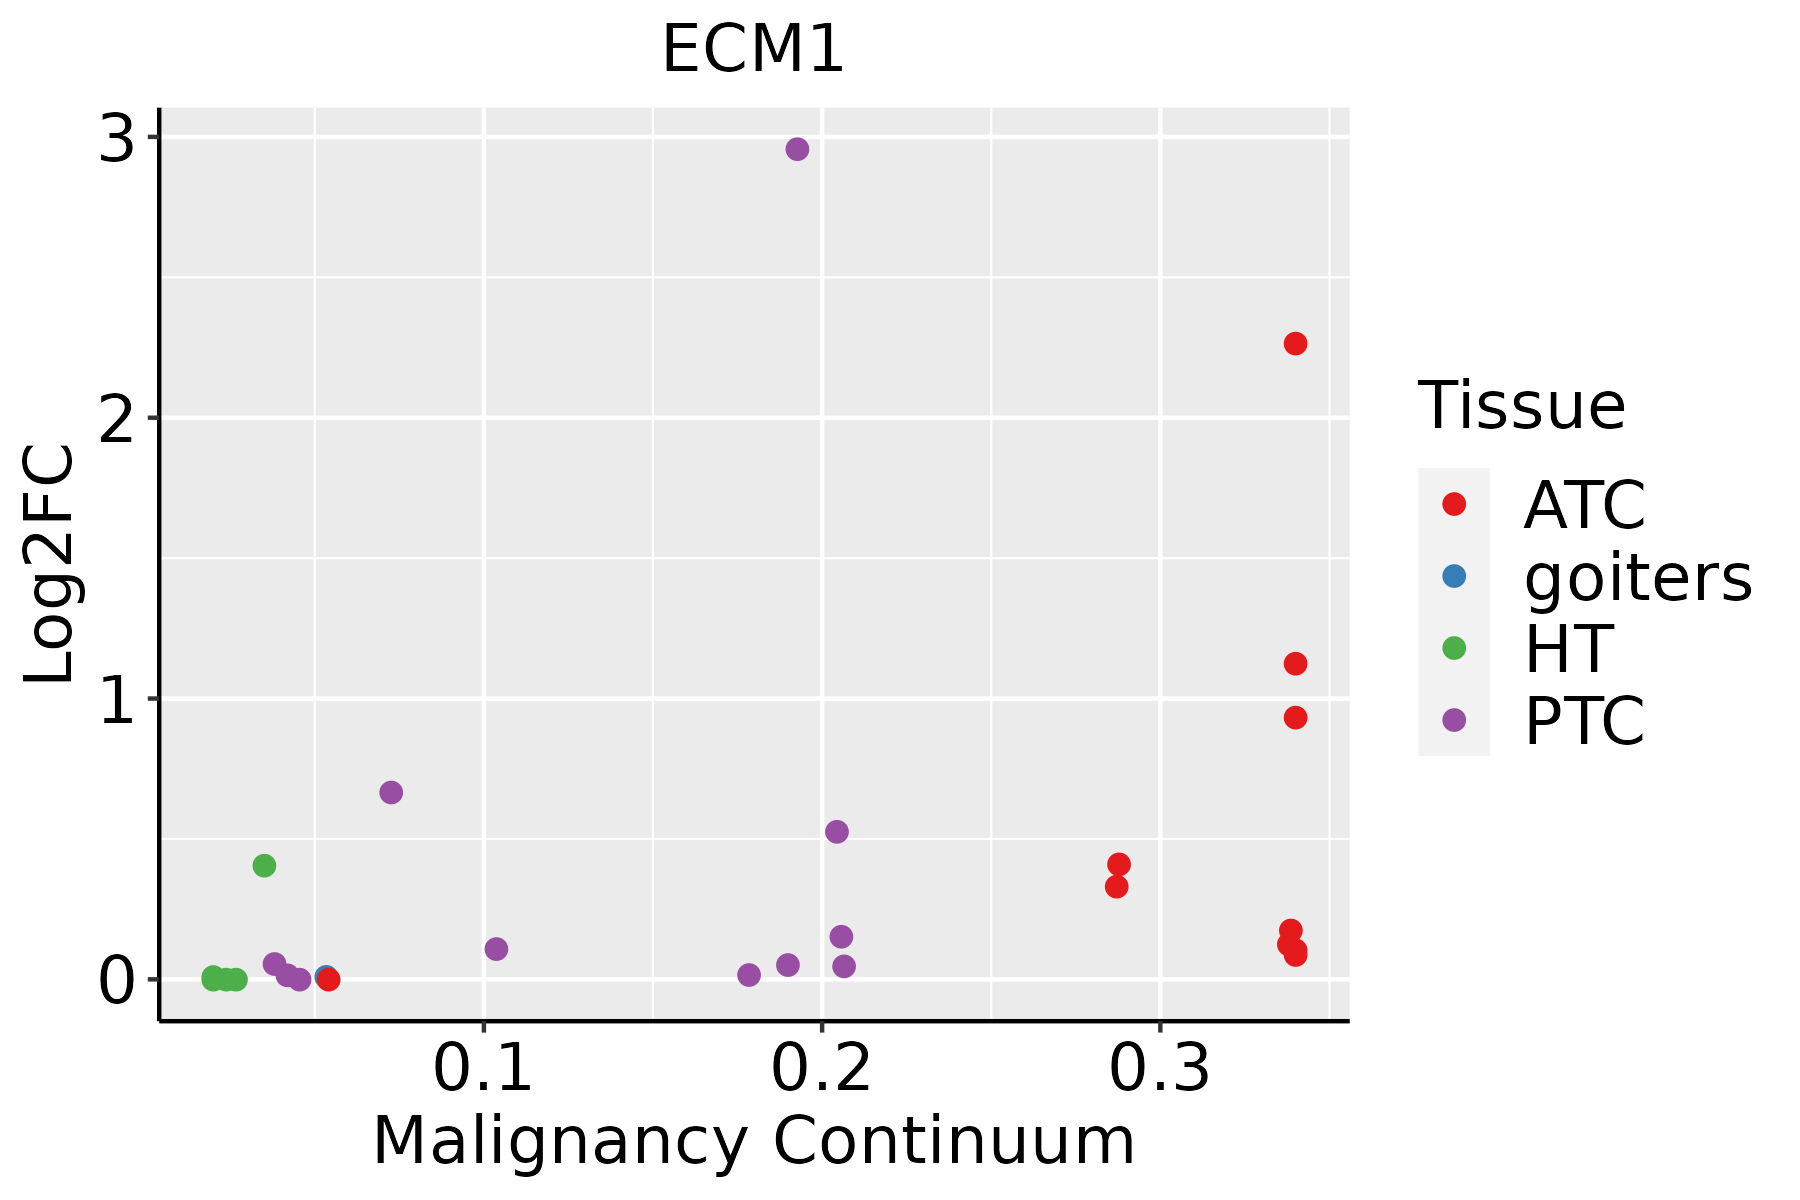 | ATC: Anaplastic thyroid cancer |
| HT: Hashimoto's thyroiditis |
| PTC: Papillary thyroid cancer |
| GO ID | Tissue | Disease Stage | Description | Gene Ratio | Bg Ratio | pvalue | p.adjust | Count |
| GO:005254714 | Breast | IDC | regulation of peptidase activity | 96/1434 | 461/18723 | 7.58e-20 | 6.15e-17 | 96 |
| GO:004586114 | Breast | IDC | negative regulation of proteolysis | 70/1434 | 351/18723 | 8.21e-14 | 2.22e-11 | 70 |
| GO:005134613 | Breast | IDC | negative regulation of hydrolase activity | 71/1434 | 379/18723 | 1.33e-12 | 2.90e-10 | 71 |
| GO:001046613 | Breast | IDC | negative regulation of peptidase activity | 56/1434 | 262/18723 | 1.39e-12 | 2.92e-10 | 56 |
| GO:005090011 | Breast | IDC | leukocyte migration | 54/1434 | 369/18723 | 3.10e-06 | 1.15e-04 | 54 |
| GO:005067313 | Breast | IDC | epithelial cell proliferation | 60/1434 | 437/18723 | 7.13e-06 | 2.15e-04 | 60 |
| GO:005067812 | Breast | IDC | regulation of epithelial cell proliferation | 54/1434 | 381/18723 | 8.07e-06 | 2.39e-04 | 54 |
| GO:000268511 | Breast | IDC | regulation of leukocyte migration | 33/1434 | 210/18723 | 6.10e-05 | 1.27e-03 | 33 |
| GO:00457651 | Breast | IDC | regulation of angiogenesis | 45/1434 | 342/18723 | 2.57e-04 | 3.98e-03 | 45 |
| GO:19013421 | Breast | IDC | regulation of vasculature development | 45/1434 | 348/18723 | 3.78e-04 | 5.38e-03 | 45 |
| GO:007167511 | Breast | IDC | regulation of mononuclear cell migration | 20/1434 | 115/18723 | 4.35e-04 | 5.90e-03 | 20 |
| GO:007167411 | Breast | IDC | mononuclear cell migration | 29/1434 | 196/18723 | 4.68e-04 | 6.26e-03 | 29 |
| GO:000150311 | Breast | IDC | ossification | 50/1434 | 408/18723 | 6.51e-04 | 8.04e-03 | 50 |
| GO:00431227 | Breast | IDC | regulation of I-kappaB kinase/NF-kappaB signaling | 34/1434 | 249/18723 | 7.18e-04 | 8.77e-03 | 34 |
| GO:000724914 | Breast | IDC | I-kappaB kinase/NF-kappaB signaling | 37/1434 | 281/18723 | 8.58e-04 | 9.98e-03 | 37 |
| GO:005067911 | Breast | IDC | positive regulation of epithelial cell proliferation | 29/1434 | 207/18723 | 1.14e-03 | 1.24e-02 | 29 |
| GO:00457661 | Breast | IDC | positive regulation of angiogenesis | 26/1434 | 181/18723 | 1.39e-03 | 1.43e-02 | 26 |
| GO:19040181 | Breast | IDC | positive regulation of vasculature development | 26/1434 | 181/18723 | 1.39e-03 | 1.43e-02 | 26 |
| GO:00431236 | Breast | IDC | positive regulation of I-kappaB kinase/NF-kappaB signaling | 26/1434 | 186/18723 | 2.06e-03 | 1.95e-02 | 26 |
| GO:2000404 | Breast | IDC | regulation of T cell migration | 9/1434 | 42/18723 | 3.91e-03 | 3.20e-02 | 9 |
| Hugo Symbol | Variant Class | Variant Classification | dbSNP RS | HGVSc | HGVSp | HGVSp Short | SWISSPROT | BIOTYPE | SIFT | PolyPhen | Tumor Sample Barcode | Tissue | Histology | Sex | Age | Stage | Therapy Types | Drugs | Outcome |
| ECM1 | SNV | Missense_Mutation | | c.1087C>A | p.Leu363Met | p.L363M | Q16610 | protein_coding | deleterious(0.01) | benign(0.346) | TCGA-A2-A04R-01 | Breast | breast invasive carcinoma | Female | <65 | I/II | Chemotherapy | taxol | SD |
| ECM1 | SNV | Missense_Mutation | | c.1456N>C | p.Cys486Arg | p.C486R | Q16610 | protein_coding | deleterious(0.01) | probably_damaging(0.932) | TCGA-BH-A0B9-01 | Breast | breast invasive carcinoma | Female | <65 | I/II | Chemotherapy | cyclophosphamide | SD |
| ECM1 | SNV | Missense_Mutation | | c.817N>A | p.Glu273Lys | p.E273K | Q16610 | protein_coding | tolerated(0.08) | probably_damaging(0.984) | TCGA-BH-A18P-01 | Breast | breast invasive carcinoma | Female | <65 | I/II | Unknown | Unknown | PD |
| ECM1 | SNV | Missense_Mutation | | c.439N>G | p.Leu147Val | p.L147V | Q16610 | protein_coding | tolerated(0.25) | benign(0.364) | TCGA-EW-A1J5-01 | Breast | breast invasive carcinoma | Female | <65 | I/II | Chemotherapy | adriamycin | SD |
| ECM1 | SNV | Missense_Mutation | novel | c.212G>A | p.Gly71Glu | p.G71E | Q16610 | protein_coding | tolerated_low_confidence(0.34) | benign(0.074) | TCGA-PE-A5DE-01 | Breast | breast invasive carcinoma | Female | <65 | I/II | Chemotherapy | taxotere | CR |
| ECM1 | insertion | Frame_Shift_Ins | novel | c.1534_1535insCTTTCACACCAACA | p.Leu512ProfsTer10 | p.L512Pfs*10 | Q16610 | protein_coding | | | TCGA-A2-A0CM-01 | Breast | breast invasive carcinoma | Female | <65 | I/II | Chemotherapy | adriamycin | PD |
| ECM1 | SNV | Missense_Mutation | rs587674518 | c.703G>A | p.Glu235Lys | p.E235K | Q16610 | protein_coding | tolerated(0.08) | possibly_damaging(0.597) | TCGA-JW-AAVH-01 | Cervix | cervical & endocervical cancer | Female | <65 | I/II | Unknown | Unknown | SD |
| ECM1 | SNV | Missense_Mutation | | c.616N>G | p.Gln206Glu | p.Q206E | Q16610 | protein_coding | deleterious(0.02) | probably_damaging(0.978) | TCGA-MY-A5BE-01 | Cervix | cervical & endocervical cancer | Female | <65 | I/II | Unknown | Unknown | SD |
| ECM1 | SNV | Missense_Mutation | | c.376N>A | p.Glu126Lys | p.E126K | Q16610 | protein_coding | tolerated(0.19) | benign(0.007) | TCGA-Q1-A5R2-01 | Cervix | cervical & endocervical cancer | Female | <65 | I/II | Chemotherapy | cisplatin | PR |
| ECM1 | SNV | Missense_Mutation | novel | c.1103N>C | p.Leu368Pro | p.L368P | Q16610 | protein_coding | deleterious(0) | probably_damaging(0.999) | TCGA-5M-AAT6-01 | Colorectum | colon adenocarcinoma | Female | <65 | III/IV | Unknown | Unknown | PD |


