
|
|||||
|
 | |
| |
| |
| |
| |
| |
|
Gene: ECI2 |
Gene summary for ECI2 |
| Gene information | Species | Human | Gene symbol | ECI2 | Gene ID | 10455 |
| Gene name | enoyl-CoA delta isomerase 2 | |
| Gene Alias | ACBD2 | |
| Cytomap | 6p25.2 | |
| Gene Type | protein-coding | GO ID | GO:0006082 | UniProtAcc | A0A0C4DGA2 |
Top |
Malignant transformation analysis |
| Identification of the aberrant gene expression in precancerous and cancerous lesions by comparing the gene expression of stem-like cells in diseased tissues with normal stem cells |
| Entrez ID | Symbol | Replicates | Species | Organ | Tissue | Adj P-value | Log2FC | Malignancy |
| 10455 | ECI2 | LZE4T | Human | Esophagus | ESCC | 2.42e-12 | 2.89e-01 | 0.0811 |
| 10455 | ECI2 | LZE7T | Human | Esophagus | ESCC | 5.36e-10 | 6.69e-01 | 0.0667 |
| 10455 | ECI2 | LZE8T | Human | Esophagus | ESCC | 6.85e-04 | 4.94e-02 | 0.067 |
| 10455 | ECI2 | LZE20T | Human | Esophagus | ESCC | 8.96e-07 | 1.64e-01 | 0.0662 |
| 10455 | ECI2 | LZE24T | Human | Esophagus | ESCC | 6.64e-10 | 3.78e-01 | 0.0596 |
| 10455 | ECI2 | P2T-E | Human | Esophagus | ESCC | 8.86e-32 | 7.30e-01 | 0.1177 |
| 10455 | ECI2 | P4T-E | Human | Esophagus | ESCC | 5.27e-32 | 8.21e-01 | 0.1323 |
| 10455 | ECI2 | P5T-E | Human | Esophagus | ESCC | 2.28e-10 | 1.93e-01 | 0.1327 |
| 10455 | ECI2 | P8T-E | Human | Esophagus | ESCC | 2.73e-13 | 1.84e-01 | 0.0889 |
| 10455 | ECI2 | P9T-E | Human | Esophagus | ESCC | 1.01e-13 | 2.73e-01 | 0.1131 |
| 10455 | ECI2 | P10T-E | Human | Esophagus | ESCC | 1.41e-18 | 3.22e-01 | 0.116 |
| 10455 | ECI2 | P11T-E | Human | Esophagus | ESCC | 3.43e-19 | 9.66e-01 | 0.1426 |
| 10455 | ECI2 | P12T-E | Human | Esophagus | ESCC | 6.46e-35 | 8.48e-01 | 0.1122 |
| 10455 | ECI2 | P15T-E | Human | Esophagus | ESCC | 1.31e-23 | 4.35e-01 | 0.1149 |
| 10455 | ECI2 | P16T-E | Human | Esophagus | ESCC | 3.79e-25 | 4.47e-01 | 0.1153 |
| 10455 | ECI2 | P17T-E | Human | Esophagus | ESCC | 1.47e-08 | 4.04e-01 | 0.1278 |
| 10455 | ECI2 | P19T-E | Human | Esophagus | ESCC | 5.49e-10 | 8.63e-01 | 0.1662 |
| 10455 | ECI2 | P20T-E | Human | Esophagus | ESCC | 5.23e-19 | 2.67e-01 | 0.1124 |
| 10455 | ECI2 | P21T-E | Human | Esophagus | ESCC | 1.61e-33 | 7.29e-01 | 0.1617 |
| 10455 | ECI2 | P22T-E | Human | Esophagus | ESCC | 2.01e-22 | 4.22e-01 | 0.1236 |
| Page: 1 2 3 4 5 6 |
| Tissue | Expression Dynamics | Abbreviation |
| Esophagus |  | ESCC: Esophageal squamous cell carcinoma |
| HGIN: High-grade intraepithelial neoplasias | ||
| LGIN: Low-grade intraepithelial neoplasias | ||
| Liver | 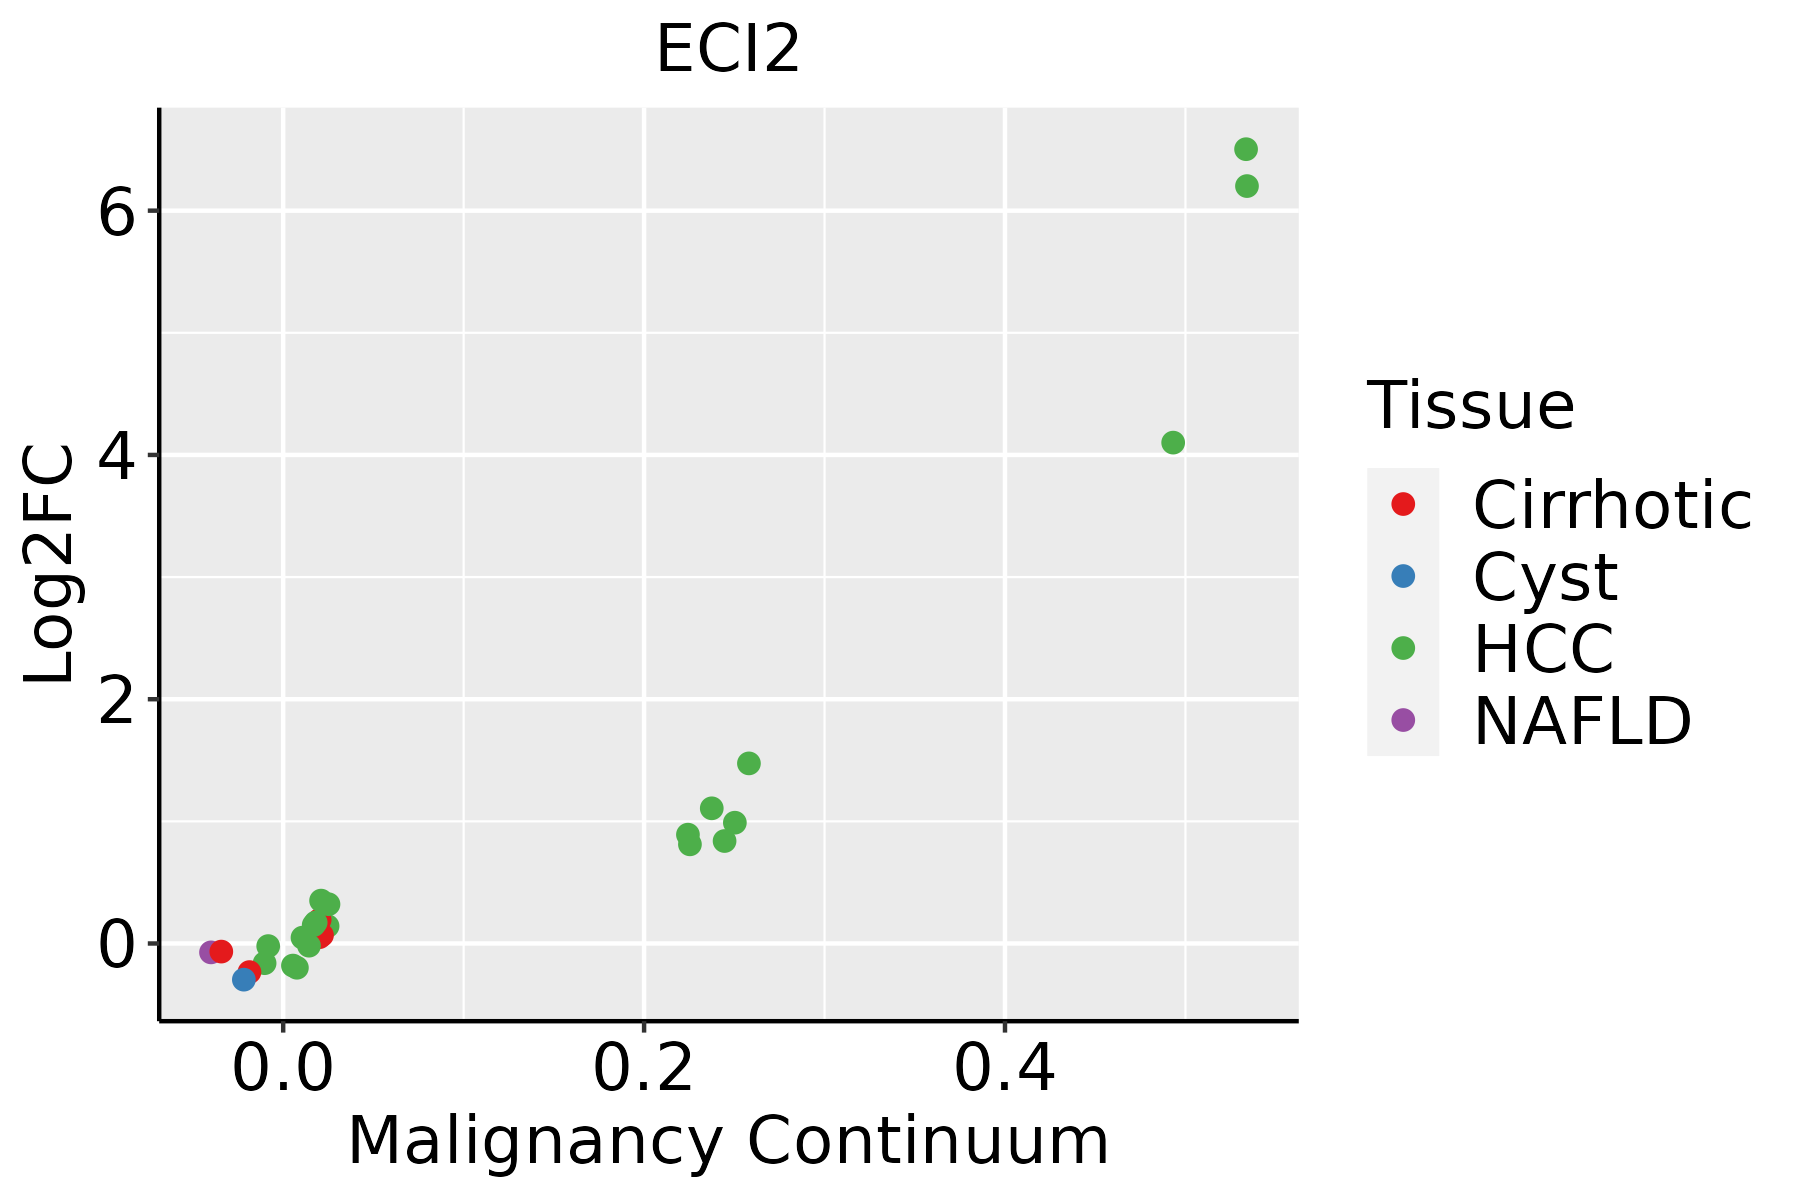 | HCC: Hepatocellular carcinoma |
| NAFLD: Non-alcoholic fatty liver disease | ||
| Oral Cavity | 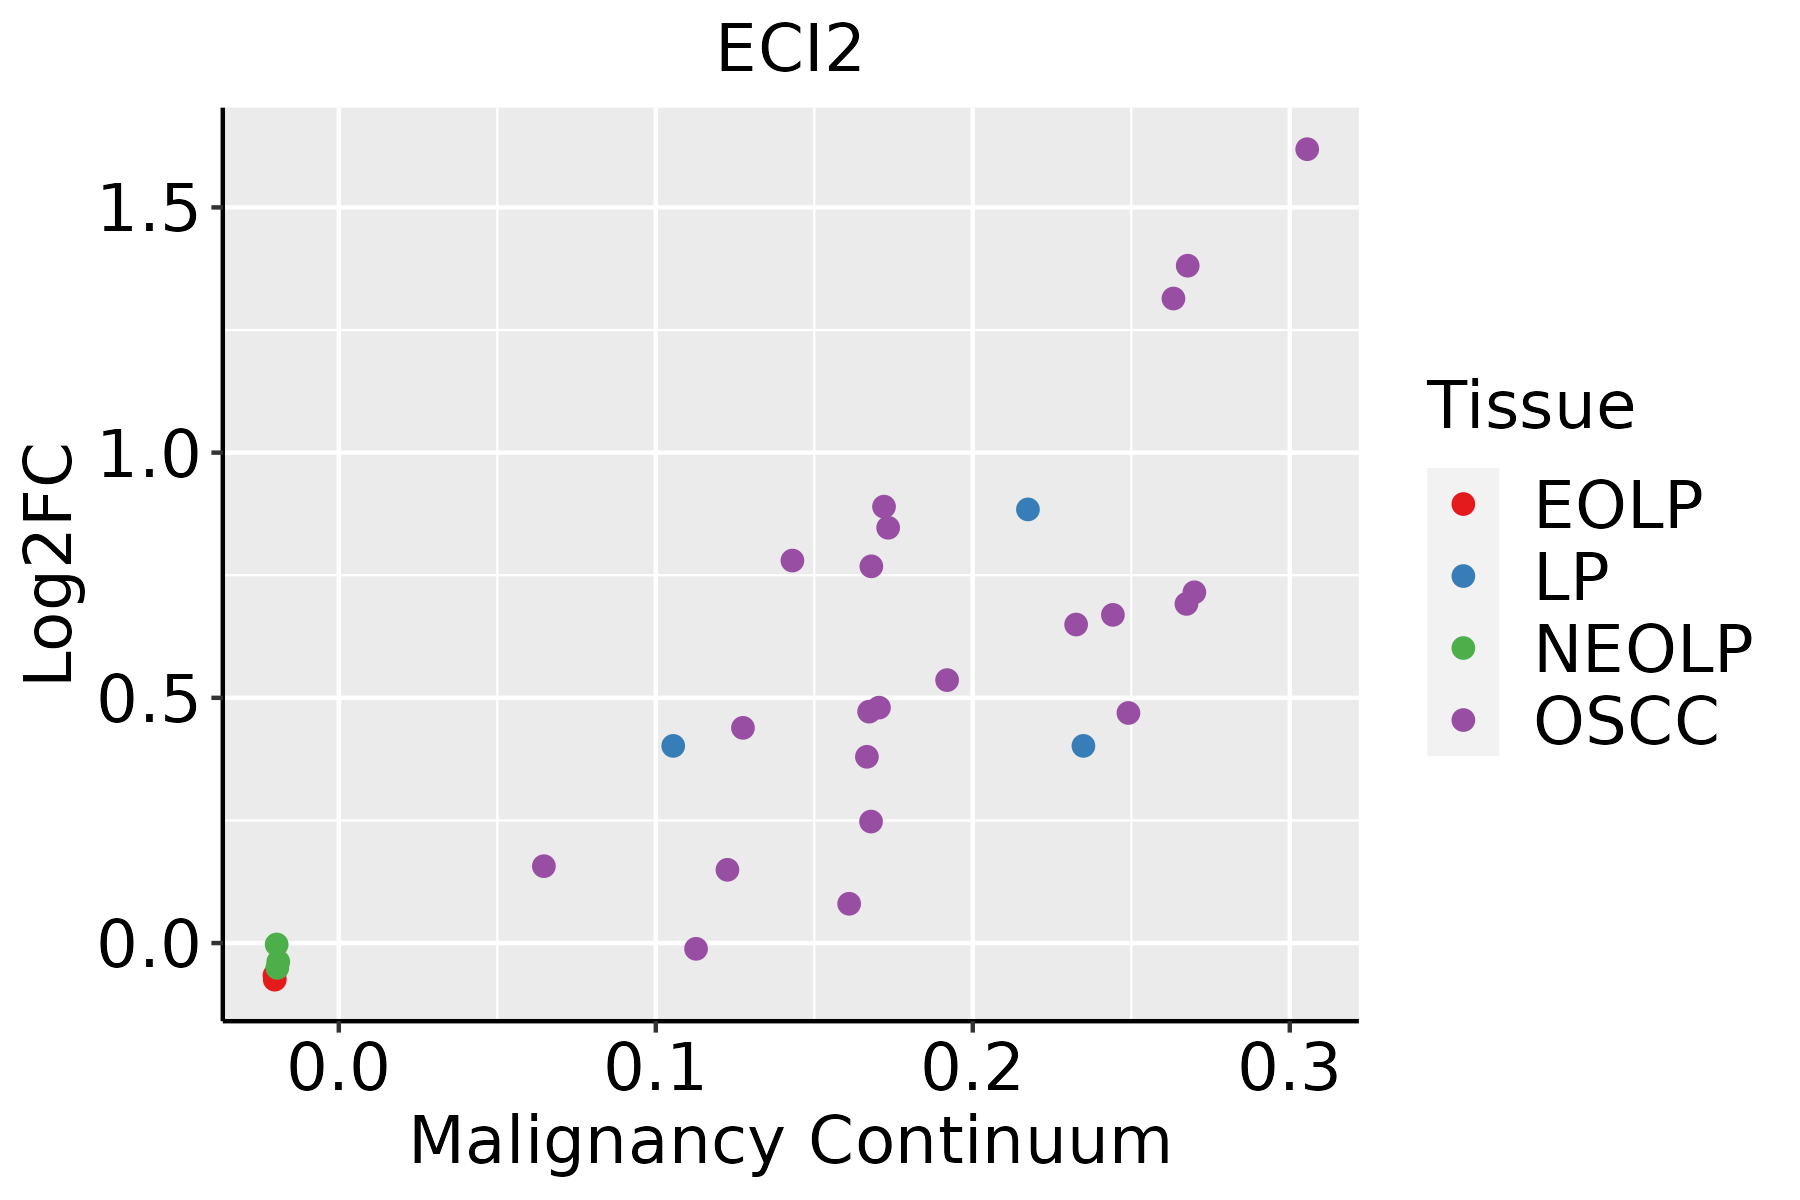 | EOLP: Erosive Oral lichen planus |
| LP: leukoplakia | ||
| NEOLP: Non-erosive oral lichen planus | ||
| OSCC: Oral squamous cell carcinoma | ||
| Prostate |  | BPH: Benign Prostatic Hyperplasia |
| Skin |  | AK: Actinic keratosis |
| cSCC: Cutaneous squamous cell carcinoma | ||
| SCCIS:squamous cell carcinoma in situ | ||
| Thyroid |  | ATC: Anaplastic thyroid cancer |
| HT: Hashimoto's thyroiditis | ||
| PTC: Papillary thyroid cancer |
| ∗log2FC in expression of this searched gene in stem-like cells from each diseased tissue sample relative to stem-like cells in normal samples in each tissue plotted against the malignancy continuum. Samples are colored based on if they are from different disease stage. |
Top |
Malignant transformation related pathway analysis |
| Find out the enriched GO biological processes and KEGG pathways involved in transition from healthy to precancer to cancer |
| Tissue | Disease Stage | Enriched GO biological Processes |
| Colorectum | AD |  |
| Colorectum | SER |  |
| Colorectum | MSS |  |
| Colorectum | MSI-H |  |
| Colorectum | FAP |  |
| ∗Top 15 enriched GO BP terms are showed in the bar plot of each disease state in each tissue. Each row represents a significant GO biological process which is colored according to the -log10(p.adjust). |
| Page: 1 2 3 4 5 6 7 8 9 |
| GO ID | Tissue | Disease Stage | Description | Gene Ratio | Bg Ratio | pvalue | p.adjust | Count |
| GO:00193958 | Esophagus | ESCC | fatty acid oxidation | 69/8552 | 103/18723 | 9.95e-06 | 9.44e-05 | 69 |
| GO:00344407 | Esophagus | ESCC | lipid oxidation | 71/8552 | 108/18723 | 2.00e-05 | 1.74e-04 | 71 |
| GO:00090628 | Esophagus | ESCC | fatty acid catabolic process | 66/8552 | 100/18723 | 3.21e-05 | 2.66e-04 | 66 |
| GO:00066318 | Esophagus | ESCC | fatty acid metabolic process | 217/8552 | 390/18723 | 4.21e-05 | 3.39e-04 | 217 |
| GO:00066358 | Esophagus | ESCC | fatty acid beta-oxidation | 50/8552 | 74/18723 | 1.16e-04 | 8.04e-04 | 50 |
| GO:00723297 | Esophagus | ESCC | monocarboxylic acid catabolic process | 74/8552 | 122/18723 | 6.03e-04 | 3.27e-03 | 74 |
| GO:00442427 | Esophagus | ESCC | cellular lipid catabolic process | 121/8552 | 214/18723 | 8.63e-04 | 4.43e-03 | 121 |
| GO:00442827 | Esophagus | ESCC | small molecule catabolic process | 201/8552 | 376/18723 | 1.35e-03 | 6.41e-03 | 201 |
| GO:00302586 | Esophagus | ESCC | lipid modification | 116/8552 | 212/18723 | 4.90e-03 | 1.89e-02 | 116 |
| GO:00160427 | Esophagus | ESCC | lipid catabolic process | 168/8552 | 320/18723 | 7.97e-03 | 2.84e-02 | 168 |
| GO:000663112 | Liver | Cirrhotic | fatty acid metabolic process | 165/4634 | 390/18723 | 1.29e-14 | 1.26e-12 | 165 |
| GO:004428211 | Liver | Cirrhotic | small molecule catabolic process | 151/4634 | 376/18723 | 2.20e-11 | 1.34e-09 | 151 |
| GO:001605411 | Liver | Cirrhotic | organic acid catabolic process | 104/4634 | 240/18723 | 1.91e-10 | 9.53e-09 | 104 |
| GO:004639511 | Liver | Cirrhotic | carboxylic acid catabolic process | 102/4634 | 236/18723 | 3.41e-10 | 1.63e-08 | 102 |
| GO:001939512 | Liver | Cirrhotic | fatty acid oxidation | 53/4634 | 103/18723 | 4.73e-09 | 1.88e-07 | 53 |
| GO:003444011 | Liver | Cirrhotic | lipid oxidation | 53/4634 | 108/18723 | 3.85e-08 | 1.27e-06 | 53 |
| GO:007232911 | Liver | Cirrhotic | monocarboxylic acid catabolic process | 56/4634 | 122/18723 | 2.87e-07 | 7.01e-06 | 56 |
| GO:000906211 | Liver | Cirrhotic | fatty acid catabolic process | 48/4634 | 100/18723 | 3.87e-07 | 9.13e-06 | 48 |
| GO:000663512 | Liver | Cirrhotic | fatty acid beta-oxidation | 38/4634 | 74/18723 | 7.41e-07 | 1.57e-05 | 38 |
| GO:004424212 | Liver | Cirrhotic | cellular lipid catabolic process | 82/4634 | 214/18723 | 6.91e-06 | 1.08e-04 | 82 |
| Page: 1 2 3 |
| Pathway ID | Tissue | Disease Stage | Description | Gene Ratio | Bg Ratio | pvalue | p.adjust | qvalue | Count |
| hsa041467 | Esophagus | ESCC | Peroxisome | 55/4205 | 82/8465 | 1.04e-03 | 3.27e-03 | 1.68e-03 | 55 |
| hsa0414612 | Esophagus | ESCC | Peroxisome | 55/4205 | 82/8465 | 1.04e-03 | 3.27e-03 | 1.68e-03 | 55 |
| hsa0007121 | Liver | Cirrhotic | Fatty acid degradation | 29/2530 | 43/8465 | 3.87e-07 | 4.95e-06 | 3.05e-06 | 29 |
| hsa041462 | Liver | Cirrhotic | Peroxisome | 36/2530 | 82/8465 | 4.79e-03 | 1.74e-02 | 1.07e-02 | 36 |
| hsa0007131 | Liver | Cirrhotic | Fatty acid degradation | 29/2530 | 43/8465 | 3.87e-07 | 4.95e-06 | 3.05e-06 | 29 |
| hsa041463 | Liver | Cirrhotic | Peroxisome | 36/2530 | 82/8465 | 4.79e-03 | 1.74e-02 | 1.07e-02 | 36 |
| hsa041464 | Liver | HCC | Peroxisome | 58/4020 | 82/8465 | 1.57e-05 | 1.05e-04 | 5.85e-05 | 58 |
| hsa0007141 | Liver | HCC | Fatty acid degradation | 33/4020 | 43/8465 | 8.41e-05 | 4.27e-04 | 2.37e-04 | 33 |
| hsa041465 | Liver | HCC | Peroxisome | 58/4020 | 82/8465 | 1.57e-05 | 1.05e-04 | 5.85e-05 | 58 |
| hsa0007151 | Liver | HCC | Fatty acid degradation | 33/4020 | 43/8465 | 8.41e-05 | 4.27e-04 | 2.37e-04 | 33 |
| hsa041466 | Oral cavity | OSCC | Peroxisome | 47/3704 | 82/8465 | 9.01e-03 | 2.01e-02 | 1.03e-02 | 47 |
| hsa0414611 | Oral cavity | OSCC | Peroxisome | 47/3704 | 82/8465 | 9.01e-03 | 2.01e-02 | 1.03e-02 | 47 |
| hsa0414621 | Oral cavity | LP | Peroxisome | 33/2418 | 82/8465 | 1.48e-02 | 4.69e-02 | 3.03e-02 | 33 |
| hsa0414631 | Oral cavity | LP | Peroxisome | 33/2418 | 82/8465 | 1.48e-02 | 4.69e-02 | 3.03e-02 | 33 |
| hsa000719 | Prostate | Tumor | Fatty acid degradation | 16/1791 | 43/8465 | 1.15e-02 | 3.59e-02 | 2.23e-02 | 16 |
| hsa0007112 | Prostate | Tumor | Fatty acid degradation | 16/1791 | 43/8465 | 1.15e-02 | 3.59e-02 | 2.23e-02 | 16 |
| Page: 1 |
Top |
Cell-cell communication analysis |
| Identification of potential cell-cell interactions between two cell types and their ligand-receptor pairs for different disease states |
| Ligand | Receptor | LRpair | Pathway | Tissue | Disease Stage |
| Page: 1 |
Top |
Single-cell gene regulatory network inference analysis |
| Find out the significant the regulons (TFs) and the target genes of each regulon across cell types for different disease states |
| TF | Cell Type | Tissue | Disease Stage | Target Gene | RSS | Regulon Activity |
| ∗The dot plots of a searched regulon are shown for all cell subpopulations in each disease state of each tissue based on the regulon specific score inferred using pySCENIC and by calculating the average expression. |
| Page: 1 |
Top |
Somatic mutation of malignant transformation related genes |
| Annotation of somatic variants for genes involved in malignant transformation |
| Hugo Symbol | Variant Class | Variant Classification | dbSNP RS | HGVSc | HGVSp | HGVSp Short | SWISSPROT | BIOTYPE | SIFT | PolyPhen | Tumor Sample Barcode | Tissue | Histology | Sex | Age | Stage | Therapy Types | Drugs | Outcome |
| ECI2 | insertion | Nonsense_Mutation | novel | c.887_888insCCTAAGAAAAAGCTGCAGTGAGACTGTTTAGG | p.Thr297LeufsTer10 | p.T297Lfs*10 | O75521 | protein_coding | TCGA-A8-A09C-01 | Breast | breast invasive carcinoma | Female | >=65 | I/II | Unknown | Unknown | SD | ||
| ECI2 | deletion | Frame_Shift_Del | novel | c.1081delN | p.His361ThrfsTer25 | p.H361Tfs*25 | O75521 | protein_coding | TCGA-AO-A128-01 | Breast | breast invasive carcinoma | Female | <65 | I/II | Chemotherapy | doxorubicin | SD | ||
| ECI2 | insertion | Frame_Shift_Ins | novel | c.740_741insTCCTTGCCCAGAAC | p.Gly248ProfsTer33 | p.G248Pfs*33 | O75521 | protein_coding | TCGA-BH-A0HF-01 | Breast | breast invasive carcinoma | Female | >=65 | I/II | Hormone Therapy | arimidex | SD | ||
| ECI2 | insertion | Frame_Shift_Ins | novel | c.738_739insCTGAGAA | p.Val247LeufsTer20 | p.V247Lfs*20 | O75521 | protein_coding | TCGA-BH-A0HF-01 | Breast | breast invasive carcinoma | Female | >=65 | I/II | Hormone Therapy | arimidex | SD | ||
| ECI2 | SNV | Missense_Mutation | novel | c.499N>A | p.Glu167Lys | p.E167K | O75521 | protein_coding | tolerated(0.45) | benign(0.024) | TCGA-C5-A7CK-01 | Cervix | cervical & endocervical cancer | Female | <65 | I/II | Chemotherapy | cisplatin | SD |
| ECI2 | SNV | Missense_Mutation | c.511G>C | p.Glu171Gln | p.E171Q | O75521 | protein_coding | tolerated(0.09) | possibly_damaging(0.495) | TCGA-Q1-A5R2-01 | Cervix | cervical & endocervical cancer | Female | <65 | I/II | Chemotherapy | cisplatin | PR | |
| ECI2 | SNV | Missense_Mutation | c.1035N>T | p.Leu345Phe | p.L345F | O75521 | protein_coding | deleterious(0.01) | possibly_damaging(0.825) | TCGA-Q1-A73P-01 | Cervix | cervical & endocervical cancer | Female | <65 | I/II | Unknown | Unknown | SD | |
| ECI2 | SNV | Missense_Mutation | novel | c.14N>G | p.Tyr5Cys | p.Y5C | O75521 | protein_coding | tolerated_low_confidence(0.17) | benign(0) | TCGA-AA-3845-01 | Colorectum | colon adenocarcinoma | Female | >=65 | I/II | Unknown | Unknown | PD |
| ECI2 | SNV | Missense_Mutation | c.583T>G | p.Tyr195Asp | p.Y195D | O75521 | protein_coding | deleterious(0.01) | probably_damaging(0.996) | TCGA-AA-3977-01 | Colorectum | colon adenocarcinoma | Male | >=65 | I/II | Unknown | Unknown | SD | |
| ECI2 | SNV | Missense_Mutation | rs548867219 | c.439N>A | p.Glu147Lys | p.E147K | O75521 | protein_coding | tolerated(0.27) | benign(0.069) | TCGA-AA-3984-01 | Colorectum | colon adenocarcinoma | Female | <65 | I/II | Unknown | Unknown | SD |
| Page: 1 2 3 4 |
Top |
Related drugs of malignant transformation related genes |
| Identification of chemicals and drugs interact with genes involved in malignant transfromation |
| (DGIdb 4.0) |
| Entrez ID | Symbol | Category | Interaction Types | Drug Claim Name | Drug Name | PMIDs |
| Page: 1 |

Copyright 2023-Present -The University of Texas Health Science Center at Houston |