
|
|||||
|
 | |
| |
| |
| |
| |
| |
|
Gene: ECI1 |
Gene summary for ECI1 |
| Gene information | Species | Human | Gene symbol | ECI1 | Gene ID | 1632 |
| Gene name | enoyl-CoA delta isomerase 1 | |
| Gene Alias | DCI | |
| Cytomap | 16p13.3 | |
| Gene Type | protein-coding | GO ID | GO:0006082 | UniProtAcc | P42126 |
Top |
Malignant transformation analysis |
| Identification of the aberrant gene expression in precancerous and cancerous lesions by comparing the gene expression of stem-like cells in diseased tissues with normal stem cells |
| Entrez ID | Symbol | Replicates | Species | Organ | Tissue | Adj P-value | Log2FC | Malignancy |
| 1632 | ECI1 | GSM4909281 | Human | Breast | IDC | 1.94e-03 | 2.26e-01 | 0.21 |
| 1632 | ECI1 | GSM4909282 | Human | Breast | IDC | 8.68e-11 | 3.35e-01 | -0.0288 |
| 1632 | ECI1 | GSM4909290 | Human | Breast | IDC | 3.72e-04 | 2.86e-01 | 0.2096 |
| 1632 | ECI1 | GSM4909296 | Human | Breast | IDC | 2.22e-03 | -1.31e-01 | 0.1524 |
| 1632 | ECI1 | GSM4909298 | Human | Breast | IDC | 1.66e-11 | 3.51e-01 | 0.1551 |
| 1632 | ECI1 | GSM4909304 | Human | Breast | IDC | 5.45e-36 | 6.52e-01 | 0.1636 |
| 1632 | ECI1 | GSM4909306 | Human | Breast | IDC | 1.89e-13 | 4.62e-01 | 0.1564 |
| 1632 | ECI1 | GSM4909308 | Human | Breast | IDC | 5.06e-04 | 2.27e-01 | 0.158 |
| 1632 | ECI1 | GSM4909311 | Human | Breast | IDC | 5.47e-05 | -1.30e-01 | 0.1534 |
| 1632 | ECI1 | GSM4909312 | Human | Breast | IDC | 7.98e-03 | -1.62e-01 | 0.1552 |
| 1632 | ECI1 | GSM4909317 | Human | Breast | IDC | 7.39e-05 | 2.82e-01 | 0.1355 |
| 1632 | ECI1 | GSM4909318 | Human | Breast | IDC | 4.41e-02 | 4.79e-01 | 0.2031 |
| 1632 | ECI1 | GSM4909319 | Human | Breast | IDC | 7.83e-16 | 1.06e-01 | 0.1563 |
| 1632 | ECI1 | GSM4909321 | Human | Breast | IDC | 1.89e-11 | 3.49e-01 | 0.1559 |
| 1632 | ECI1 | brca1 | Human | Breast | Precancer | 2.69e-05 | 2.05e-01 | -0.0338 |
| 1632 | ECI1 | M1 | Human | Breast | IDC | 2.65e-08 | 4.53e-01 | 0.1577 |
| 1632 | ECI1 | M5 | Human | Breast | IDC | 6.95e-05 | 6.41e-01 | 0.1598 |
| 1632 | ECI1 | NCCBC5 | Human | Breast | DCIS | 1.47e-02 | 1.24e-01 | 0.2046 |
| 1632 | ECI1 | P1 | Human | Breast | IDC | 1.54e-03 | 4.48e-03 | 0.1527 |
| 1632 | ECI1 | DCIS2 | Human | Breast | DCIS | 1.05e-60 | 1.96e-01 | 0.0085 |
| Page: 1 2 3 4 5 6 7 8 |
| Tissue | Expression Dynamics | Abbreviation |
| Breast |  | IDC: Invasive ductal carcinoma |
| DCIS: Ductal carcinoma in situ | ||
| Precancer(BRCA1-mut): Precancerous lesion from BRCA1 mutation carriers | ||
| Colorectum (GSE201348) |  | FAP: Familial adenomatous polyposis |
| CRC: Colorectal cancer | ||
| Colorectum (HTA11) |  | AD: Adenomas |
| SER: Sessile serrated lesions | ||
| MSI-H: Microsatellite-high colorectal cancer | ||
| MSS: Microsatellite stable colorectal cancer | ||
| Esophagus | 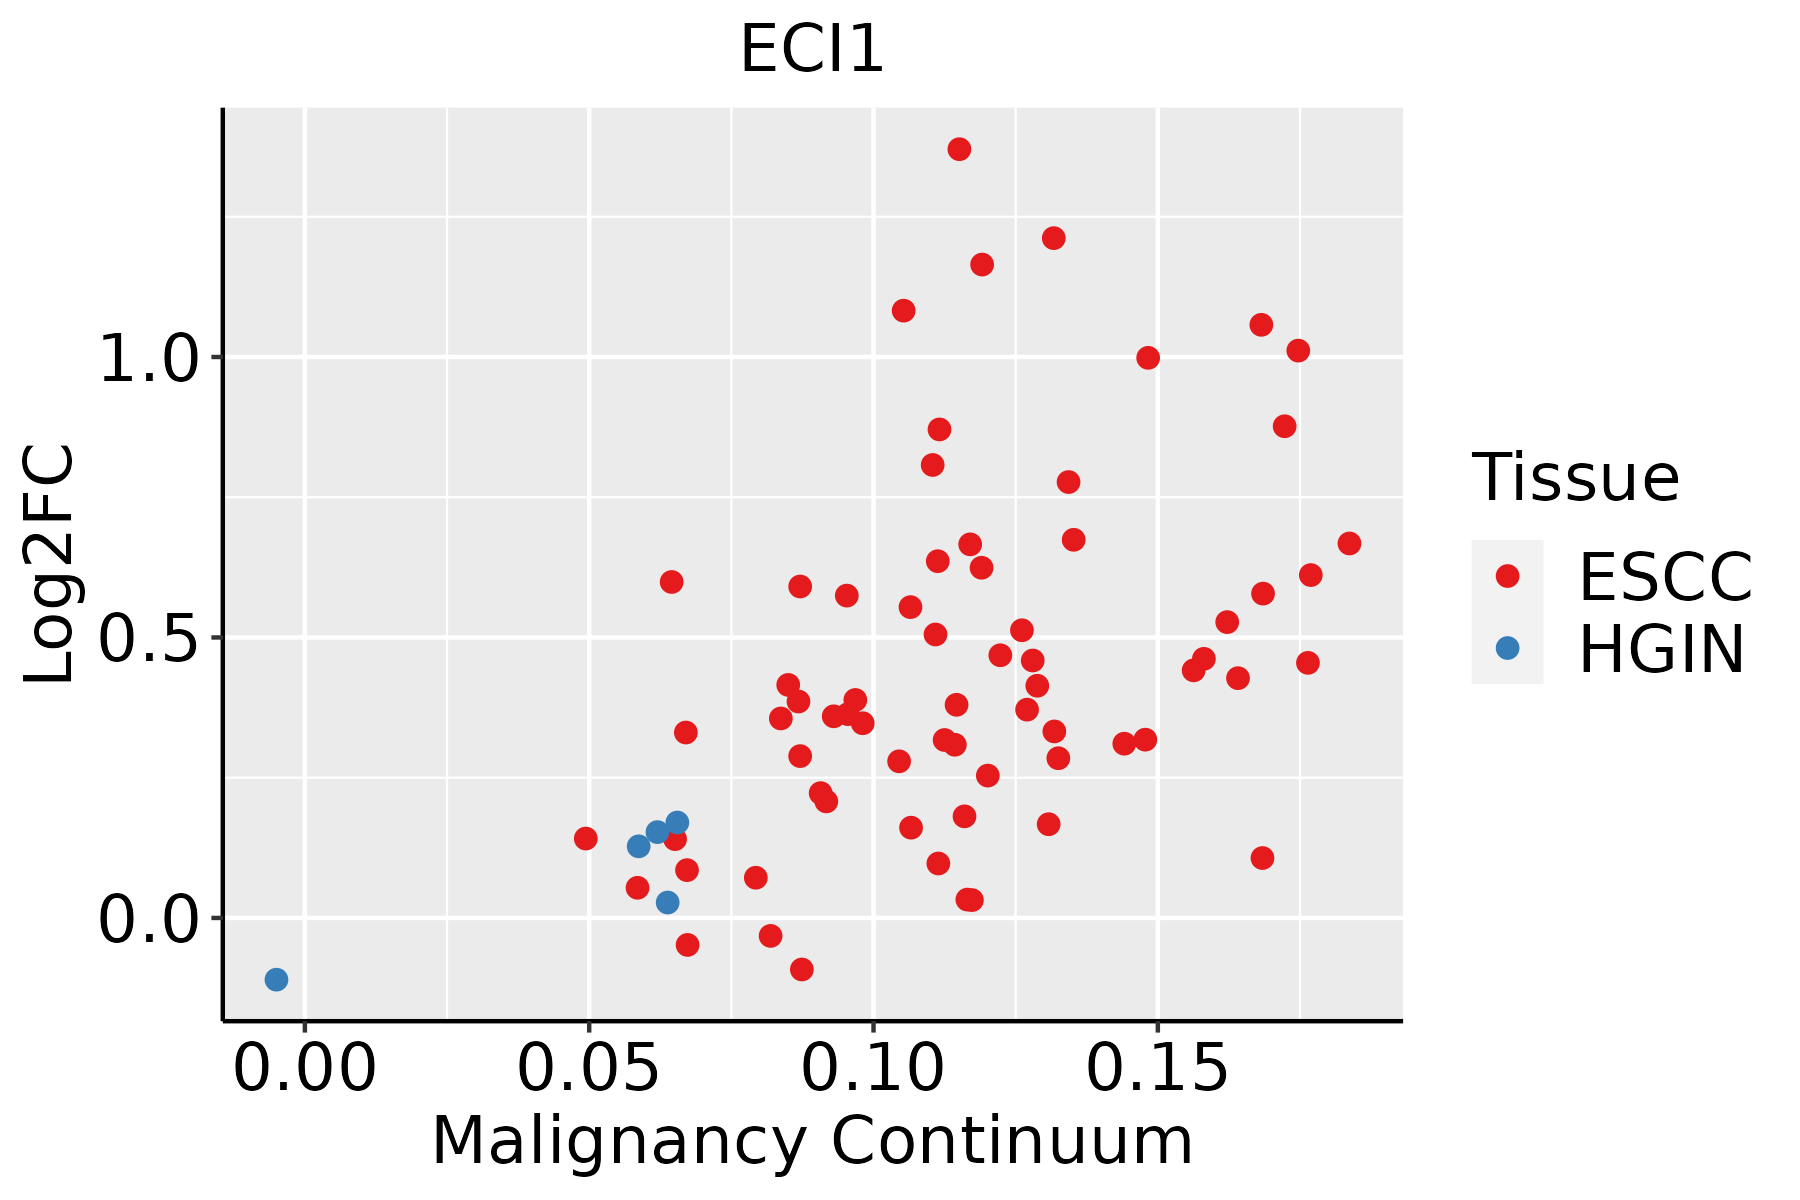 | ESCC: Esophageal squamous cell carcinoma |
| HGIN: High-grade intraepithelial neoplasias | ||
| LGIN: Low-grade intraepithelial neoplasias | ||
| Liver |  | HCC: Hepatocellular carcinoma |
| NAFLD: Non-alcoholic fatty liver disease | ||
| Oral Cavity | 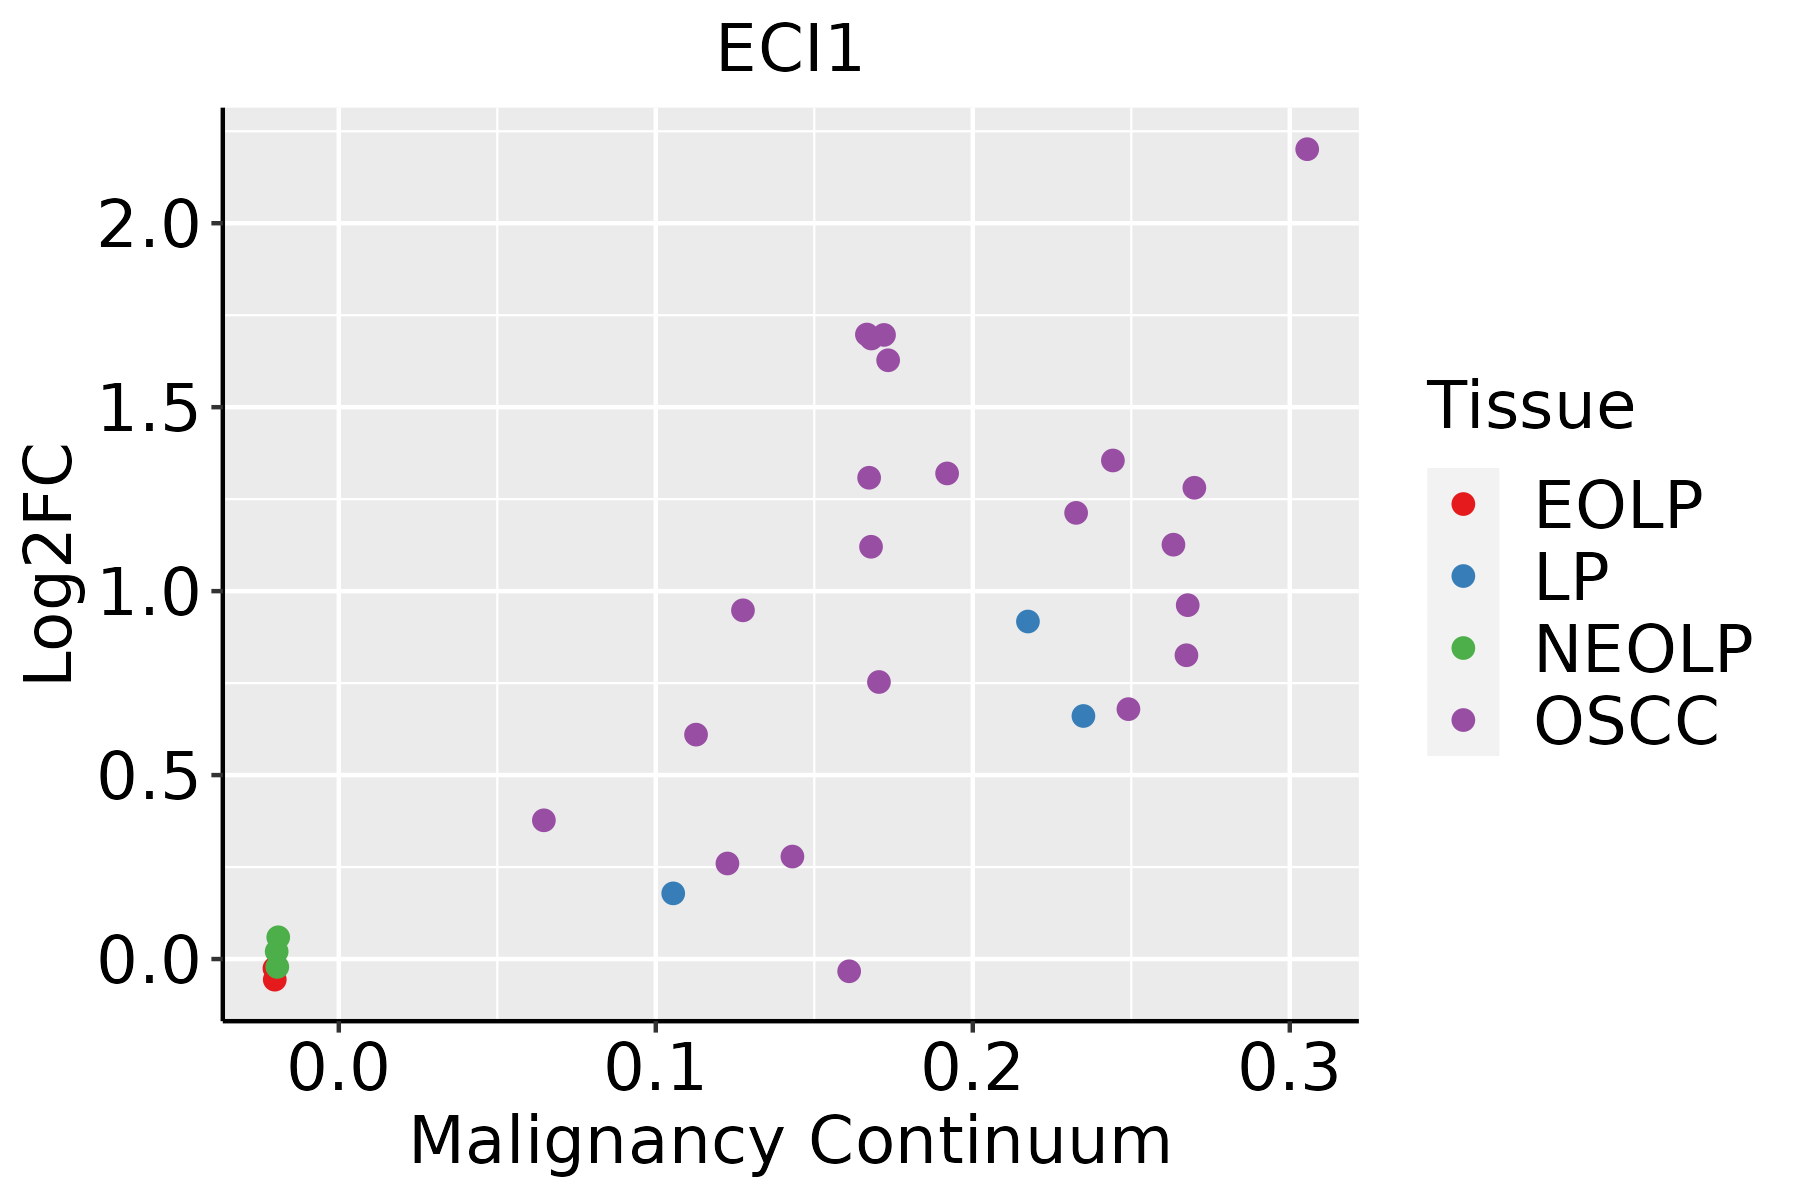 | EOLP: Erosive Oral lichen planus |
| LP: leukoplakia | ||
| NEOLP: Non-erosive oral lichen planus | ||
| OSCC: Oral squamous cell carcinoma | ||
| Prostate |  | BPH: Benign Prostatic Hyperplasia |
| Skin | 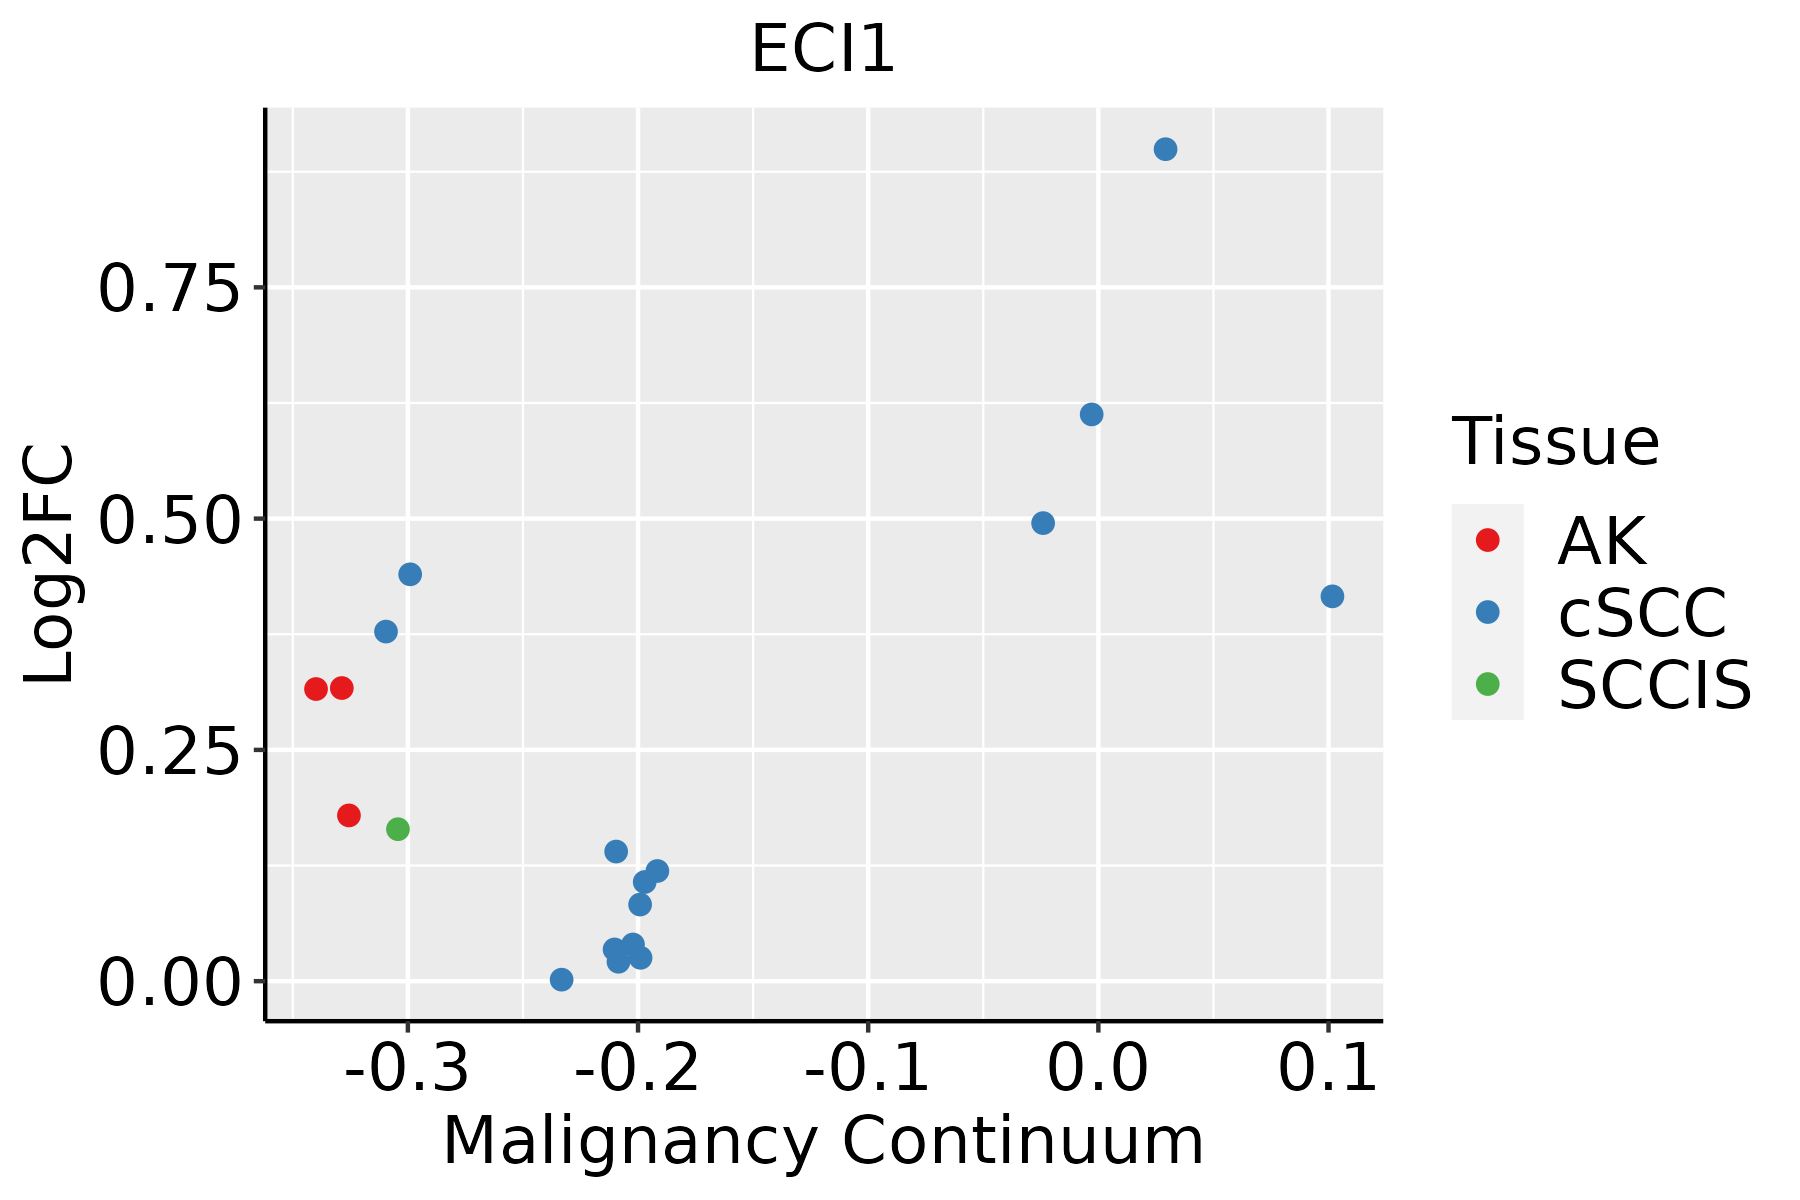 | AK: Actinic keratosis |
| cSCC: Cutaneous squamous cell carcinoma | ||
| SCCIS:squamous cell carcinoma in situ | ||
| Thyroid | 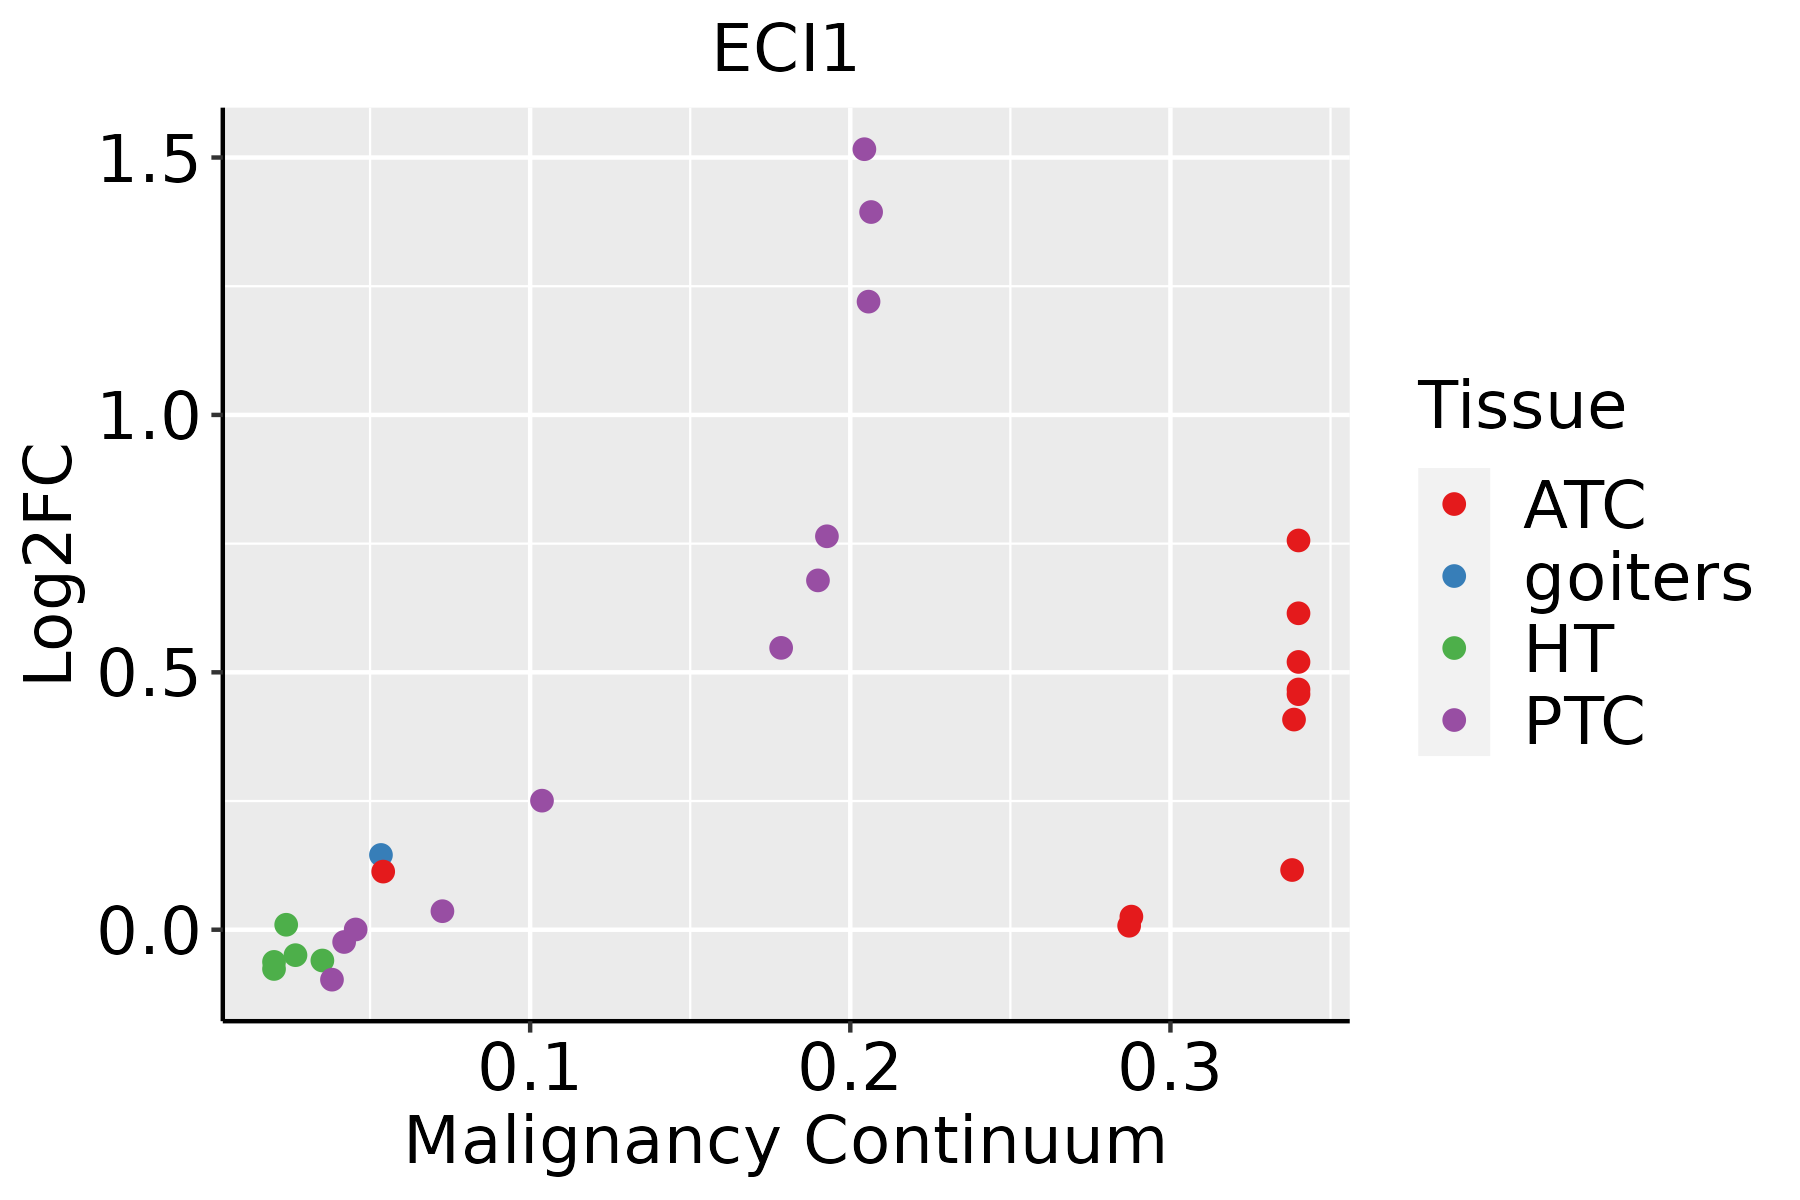 | ATC: Anaplastic thyroid cancer |
| HT: Hashimoto's thyroiditis | ||
| PTC: Papillary thyroid cancer |
| ∗log2FC in expression of this searched gene in stem-like cells from each diseased tissue sample relative to stem-like cells in normal samples in each tissue plotted against the malignancy continuum. Samples are colored based on if they are from different disease stage. |
Top |
Malignant transformation related pathway analysis |
| Find out the enriched GO biological processes and KEGG pathways involved in transition from healthy to precancer to cancer |
| Tissue | Disease Stage | Enriched GO biological Processes |
| Colorectum | AD |  |
| Colorectum | SER |  |
| Colorectum | MSS |  |
| Colorectum | MSI-H |  |
| Colorectum | FAP |  |
| ∗Top 15 enriched GO BP terms are showed in the bar plot of each disease state in each tissue. Each row represents a significant GO biological process which is colored according to the -log10(p.adjust). |
| Page: 1 2 3 4 5 6 7 8 9 |
| GO ID | Tissue | Disease Stage | Description | Gene Ratio | Bg Ratio | pvalue | p.adjust | Count |
| GO:0044282 | Colorectum | AD | small molecule catabolic process | 118/3918 | 376/18723 | 1.05e-06 | 3.55e-05 | 118 |
| GO:0006635 | Colorectum | AD | fatty acid beta-oxidation | 33/3918 | 74/18723 | 3.98e-06 | 1.09e-04 | 33 |
| GO:0009062 | Colorectum | AD | fatty acid catabolic process | 41/3918 | 100/18723 | 4.02e-06 | 1.09e-04 | 41 |
| GO:0019395 | Colorectum | AD | fatty acid oxidation | 40/3918 | 103/18723 | 2.43e-05 | 4.69e-04 | 40 |
| GO:0016042 | Colorectum | AD | lipid catabolic process | 97/3918 | 320/18723 | 4.31e-05 | 7.56e-04 | 97 |
| GO:0006631 | Colorectum | AD | fatty acid metabolic process | 114/3918 | 390/18723 | 5.58e-05 | 9.44e-04 | 114 |
| GO:0072329 | Colorectum | AD | monocarboxylic acid catabolic process | 44/3918 | 122/18723 | 8.05e-05 | 1.28e-03 | 44 |
| GO:0034440 | Colorectum | AD | lipid oxidation | 40/3918 | 108/18723 | 8.52e-05 | 1.32e-03 | 40 |
| GO:0030258 | Colorectum | AD | lipid modification | 67/3918 | 212/18723 | 1.66e-04 | 2.27e-03 | 67 |
| GO:0016054 | Colorectum | AD | organic acid catabolic process | 73/3918 | 240/18723 | 3.20e-04 | 3.81e-03 | 73 |
| GO:0044242 | Colorectum | AD | cellular lipid catabolic process | 66/3918 | 214/18723 | 3.96e-04 | 4.50e-03 | 66 |
| GO:0046395 | Colorectum | AD | carboxylic acid catabolic process | 70/3918 | 236/18723 | 9.06e-04 | 8.71e-03 | 70 |
| GO:00160421 | Colorectum | SER | lipid catabolic process | 77/2897 | 320/18723 | 3.52e-05 | 9.18e-04 | 77 |
| GO:00442821 | Colorectum | SER | small molecule catabolic process | 87/2897 | 376/18723 | 5.31e-05 | 1.27e-03 | 87 |
| GO:00090621 | Colorectum | SER | fatty acid catabolic process | 31/2897 | 100/18723 | 7.09e-05 | 1.61e-03 | 31 |
| GO:00066351 | Colorectum | SER | fatty acid beta-oxidation | 24/2897 | 74/18723 | 2.09e-04 | 3.77e-03 | 24 |
| GO:00723291 | Colorectum | SER | monocarboxylic acid catabolic process | 34/2897 | 122/18723 | 3.27e-04 | 5.22e-03 | 34 |
| GO:00193951 | Colorectum | SER | fatty acid oxidation | 29/2897 | 103/18723 | 7.24e-04 | 9.44e-03 | 29 |
| GO:00442421 | Colorectum | SER | cellular lipid catabolic process | 51/2897 | 214/18723 | 8.60e-04 | 1.05e-02 | 51 |
| GO:00344401 | Colorectum | SER | lipid oxidation | 29/2897 | 108/18723 | 1.63e-03 | 1.72e-02 | 29 |
| Page: 1 2 3 4 5 |
| Pathway ID | Tissue | Disease Stage | Description | Gene Ratio | Bg Ratio | pvalue | p.adjust | qvalue | Count |
| hsa000712 | Colorectum | SER | Fatty acid degradation | 15/1580 | 43/8465 | 8.60e-03 | 4.26e-02 | 3.09e-02 | 15 |
| hsa000713 | Colorectum | SER | Fatty acid degradation | 15/1580 | 43/8465 | 8.60e-03 | 4.26e-02 | 3.09e-02 | 15 |
| hsa0007121 | Liver | Cirrhotic | Fatty acid degradation | 29/2530 | 43/8465 | 3.87e-07 | 4.95e-06 | 3.05e-06 | 29 |
| hsa0007131 | Liver | Cirrhotic | Fatty acid degradation | 29/2530 | 43/8465 | 3.87e-07 | 4.95e-06 | 3.05e-06 | 29 |
| hsa0007141 | Liver | HCC | Fatty acid degradation | 33/4020 | 43/8465 | 8.41e-05 | 4.27e-04 | 2.37e-04 | 33 |
| hsa0007151 | Liver | HCC | Fatty acid degradation | 33/4020 | 43/8465 | 8.41e-05 | 4.27e-04 | 2.37e-04 | 33 |
| hsa000719 | Prostate | Tumor | Fatty acid degradation | 16/1791 | 43/8465 | 1.15e-02 | 3.59e-02 | 2.23e-02 | 16 |
| hsa0007112 | Prostate | Tumor | Fatty acid degradation | 16/1791 | 43/8465 | 1.15e-02 | 3.59e-02 | 2.23e-02 | 16 |
| Page: 1 |
Top |
Cell-cell communication analysis |
| Identification of potential cell-cell interactions between two cell types and their ligand-receptor pairs for different disease states |
| Ligand | Receptor | LRpair | Pathway | Tissue | Disease Stage |
| Page: 1 |
Top |
Single-cell gene regulatory network inference analysis |
| Find out the significant the regulons (TFs) and the target genes of each regulon across cell types for different disease states |
| TF | Cell Type | Tissue | Disease Stage | Target Gene | RSS | Regulon Activity |
| ∗The dot plots of a searched regulon are shown for all cell subpopulations in each disease state of each tissue based on the regulon specific score inferred using pySCENIC and by calculating the average expression. |
| Page: 1 |
Top |
Somatic mutation of malignant transformation related genes |
| Annotation of somatic variants for genes involved in malignant transformation |
| Hugo Symbol | Variant Class | Variant Classification | dbSNP RS | HGVSc | HGVSp | HGVSp Short | SWISSPROT | BIOTYPE | SIFT | PolyPhen | Tumor Sample Barcode | Tissue | Histology | Sex | Age | Stage | Therapy Types | Drugs | Outcome |
| ECI1 | SNV | Missense_Mutation | novel | c.253N>G | p.Leu85Val | p.L85V | P42126 | protein_coding | deleterious(0.01) | possibly_damaging(0.671) | TCGA-E9-A3HO-01 | Breast | breast invasive carcinoma | Female | <65 | I/II | Chemotherapy | cyclophosphamide | CR |
| ECI1 | deletion | Frame_Shift_Del | novel | c.745delC | p.His249MetfsTer5 | p.H249Mfs*5 | P42126 | protein_coding | TCGA-EW-A2FV-01 | Breast | breast invasive carcinoma | Female | <65 | III/IV | Chemotherapy | docetaxel | SD | ||
| ECI1 | SNV | Missense_Mutation | c.484N>A | p.Asp162Asn | p.D162N | P42126 | protein_coding | deleterious(0) | probably_damaging(0.998) | TCGA-JW-A5VL-01 | Cervix | cervical & endocervical cancer | Female | <65 | I/II | Unknown | Unknown | SD | |
| ECI1 | SNV | Missense_Mutation | novel | c.607N>C | p.Glu203Gln | p.E203Q | P42126 | protein_coding | deleterious(0) | probably_damaging(0.998) | TCGA-MA-AA41-01 | Cervix | cervical & endocervical cancer | Female | <65 | I/II | Unknown | Unknown | SD |
| ECI1 | SNV | Missense_Mutation | novel | c.473C>T | p.Ala158Val | p.A158V | P42126 | protein_coding | deleterious(0) | probably_damaging(0.946) | TCGA-VS-A9U6-01 | Cervix | cervical & endocervical cancer | Female | <65 | I/II | Chemotherapy | cisplatin | PD |
| ECI1 | SNV | Missense_Mutation | novel | c.574N>G | p.Thr192Ala | p.T192A | P42126 | protein_coding | deleterious(0.01) | benign(0.019) | TCGA-A6-5665-01 | Colorectum | colon adenocarcinoma | Female | >=65 | I/II | Unknown | Unknown | PD |
| ECI1 | SNV | Missense_Mutation | c.643N>A | p.Ala215Thr | p.A215T | P42126 | protein_coding | tolerated(0.37) | benign(0.006) | TCGA-CM-6674-01 | Colorectum | colon adenocarcinoma | Male | <65 | I/II | Unknown | Unknown | SD | |
| ECI1 | SNV | Missense_Mutation | c.900A>C | p.Glu300Asp | p.E300D | P42126 | protein_coding | deleterious(0) | benign(0.009) | TCGA-G5-6235-01 | Colorectum | rectum adenocarcinoma | Male | >=65 | III/IV | Chemotherapy | oxaliplatin | PD | |
| ECI1 | SNV | Missense_Mutation | c.490N>A | p.Arg164Ser | p.R164S | P42126 | protein_coding | deleterious(0) | probably_damaging(1) | TCGA-AP-A059-01 | Endometrium | uterine corpus endometrioid carcinoma | Female | >=65 | I/II | Unknown | Unknown | SD | |
| ECI1 | SNV | Missense_Mutation | novel | c.815N>T | p.Ala272Val | p.A272V | P42126 | protein_coding | deleterious(0.02) | benign(0.067) | TCGA-B5-A3FA-01 | Endometrium | uterine corpus endometrioid carcinoma | Female | >=65 | I/II | Unknown | Unknown | SD |
| Page: 1 2 3 |
Top |
Related drugs of malignant transformation related genes |
| Identification of chemicals and drugs interact with genes involved in malignant transfromation |
| (DGIdb 4.0) |
| Entrez ID | Symbol | Category | Interaction Types | Drug Claim Name | Drug Name | PMIDs |
| Page: 1 |

Copyright 2023-Present -The University of Texas Health Science Center at Houston |