
|
|||||
|
 | |
| |
| |
| |
| |
| |
|
Gene: ECHS1 |
Gene summary for ECHS1 |
| Gene information | Species | Human | Gene symbol | ECHS1 | Gene ID | 1892 |
| Gene name | enoyl-CoA hydratase, short chain 1 | |
| Gene Alias | ECHS1D | |
| Cytomap | 10q26.3 | |
| Gene Type | protein-coding | GO ID | GO:0006082 | UniProtAcc | P30084 |
Top |
Malignant transformation analysis |
| Identification of the aberrant gene expression in precancerous and cancerous lesions by comparing the gene expression of stem-like cells in diseased tissues with normal stem cells |
| Entrez ID | Symbol | Replicates | Species | Organ | Tissue | Adj P-value | Log2FC | Malignancy |
| 1892 | ECHS1 | GSM4909281 | Human | Breast | IDC | 1.27e-05 | 3.59e-01 | 0.21 |
| 1892 | ECHS1 | GSM4909282 | Human | Breast | IDC | 8.77e-06 | 3.78e-01 | -0.0288 |
| 1892 | ECHS1 | GSM4909288 | Human | Breast | IDC | 4.33e-03 | 1.01e-01 | 0.0988 |
| 1892 | ECHS1 | GSM4909291 | Human | Breast | IDC | 2.09e-03 | 3.45e-01 | 0.1753 |
| 1892 | ECHS1 | GSM4909293 | Human | Breast | IDC | 2.99e-18 | 4.97e-01 | 0.1581 |
| 1892 | ECHS1 | GSM4909296 | Human | Breast | IDC | 5.23e-29 | 5.89e-01 | 0.1524 |
| 1892 | ECHS1 | GSM4909297 | Human | Breast | IDC | 1.95e-06 | -4.48e-02 | 0.1517 |
| 1892 | ECHS1 | GSM4909304 | Human | Breast | IDC | 1.16e-16 | 4.75e-01 | 0.1636 |
| 1892 | ECHS1 | GSM4909306 | Human | Breast | IDC | 1.73e-03 | 3.02e-01 | 0.1564 |
| 1892 | ECHS1 | GSM4909311 | Human | Breast | IDC | 1.89e-22 | 4.43e-02 | 0.1534 |
| 1892 | ECHS1 | GSM4909312 | Human | Breast | IDC | 3.51e-09 | 1.89e-01 | 0.1552 |
| 1892 | ECHS1 | GSM4909315 | Human | Breast | IDC | 1.58e-06 | 3.77e-01 | 0.21 |
| 1892 | ECHS1 | GSM4909316 | Human | Breast | IDC | 1.51e-13 | 6.65e-01 | 0.21 |
| 1892 | ECHS1 | GSM4909318 | Human | Breast | IDC | 2.03e-02 | 3.59e-01 | 0.2031 |
| 1892 | ECHS1 | GSM4909319 | Human | Breast | IDC | 7.85e-41 | 9.61e-02 | 0.1563 |
| 1892 | ECHS1 | GSM4909320 | Human | Breast | IDC | 9.15e-07 | 4.98e-02 | 0.1575 |
| 1892 | ECHS1 | GSM4909321 | Human | Breast | IDC | 4.03e-15 | 1.47e-01 | 0.1559 |
| 1892 | ECHS1 | brca1 | Human | Breast | Precancer | 1.74e-02 | 2.63e-01 | -0.0338 |
| 1892 | ECHS1 | brca2 | Human | Breast | Precancer | 4.06e-07 | 3.09e-01 | -0.024 |
| 1892 | ECHS1 | M2 | Human | Breast | IDC | 2.65e-07 | 3.61e-01 | 0.21 |
| Page: 1 2 3 4 5 6 7 8 9 10 11 |
| Tissue | Expression Dynamics | Abbreviation |
| Breast | 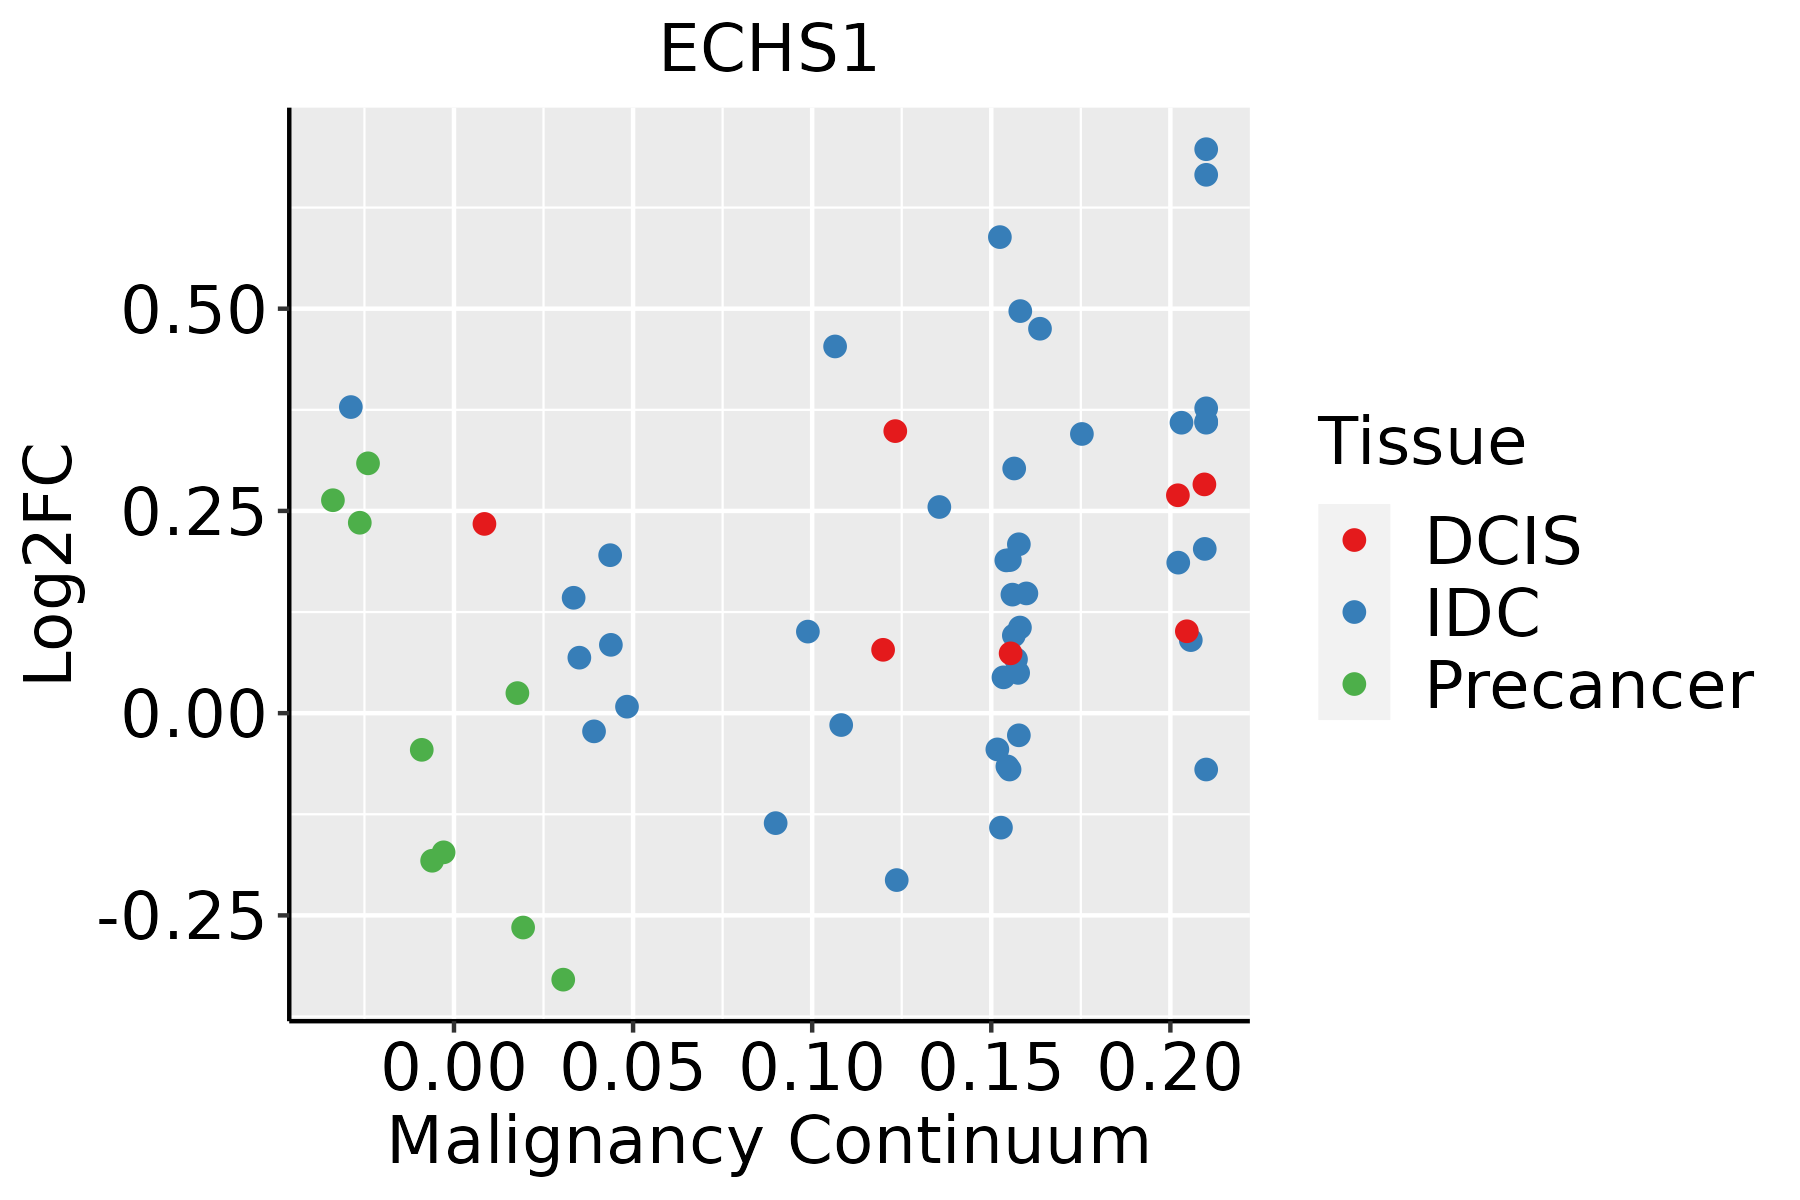 | IDC: Invasive ductal carcinoma |
| DCIS: Ductal carcinoma in situ | ||
| Precancer(BRCA1-mut): Precancerous lesion from BRCA1 mutation carriers | ||
| Colorectum (GSE201348) |  | FAP: Familial adenomatous polyposis |
| CRC: Colorectal cancer | ||
| Colorectum (HTA11) |  | AD: Adenomas |
| SER: Sessile serrated lesions | ||
| MSI-H: Microsatellite-high colorectal cancer | ||
| MSS: Microsatellite stable colorectal cancer | ||
| Endometrium |  | AEH: Atypical endometrial hyperplasia |
| EEC: Endometrioid Cancer | ||
| Esophagus |  | ESCC: Esophageal squamous cell carcinoma |
| HGIN: High-grade intraepithelial neoplasias | ||
| LGIN: Low-grade intraepithelial neoplasias | ||
| Liver | 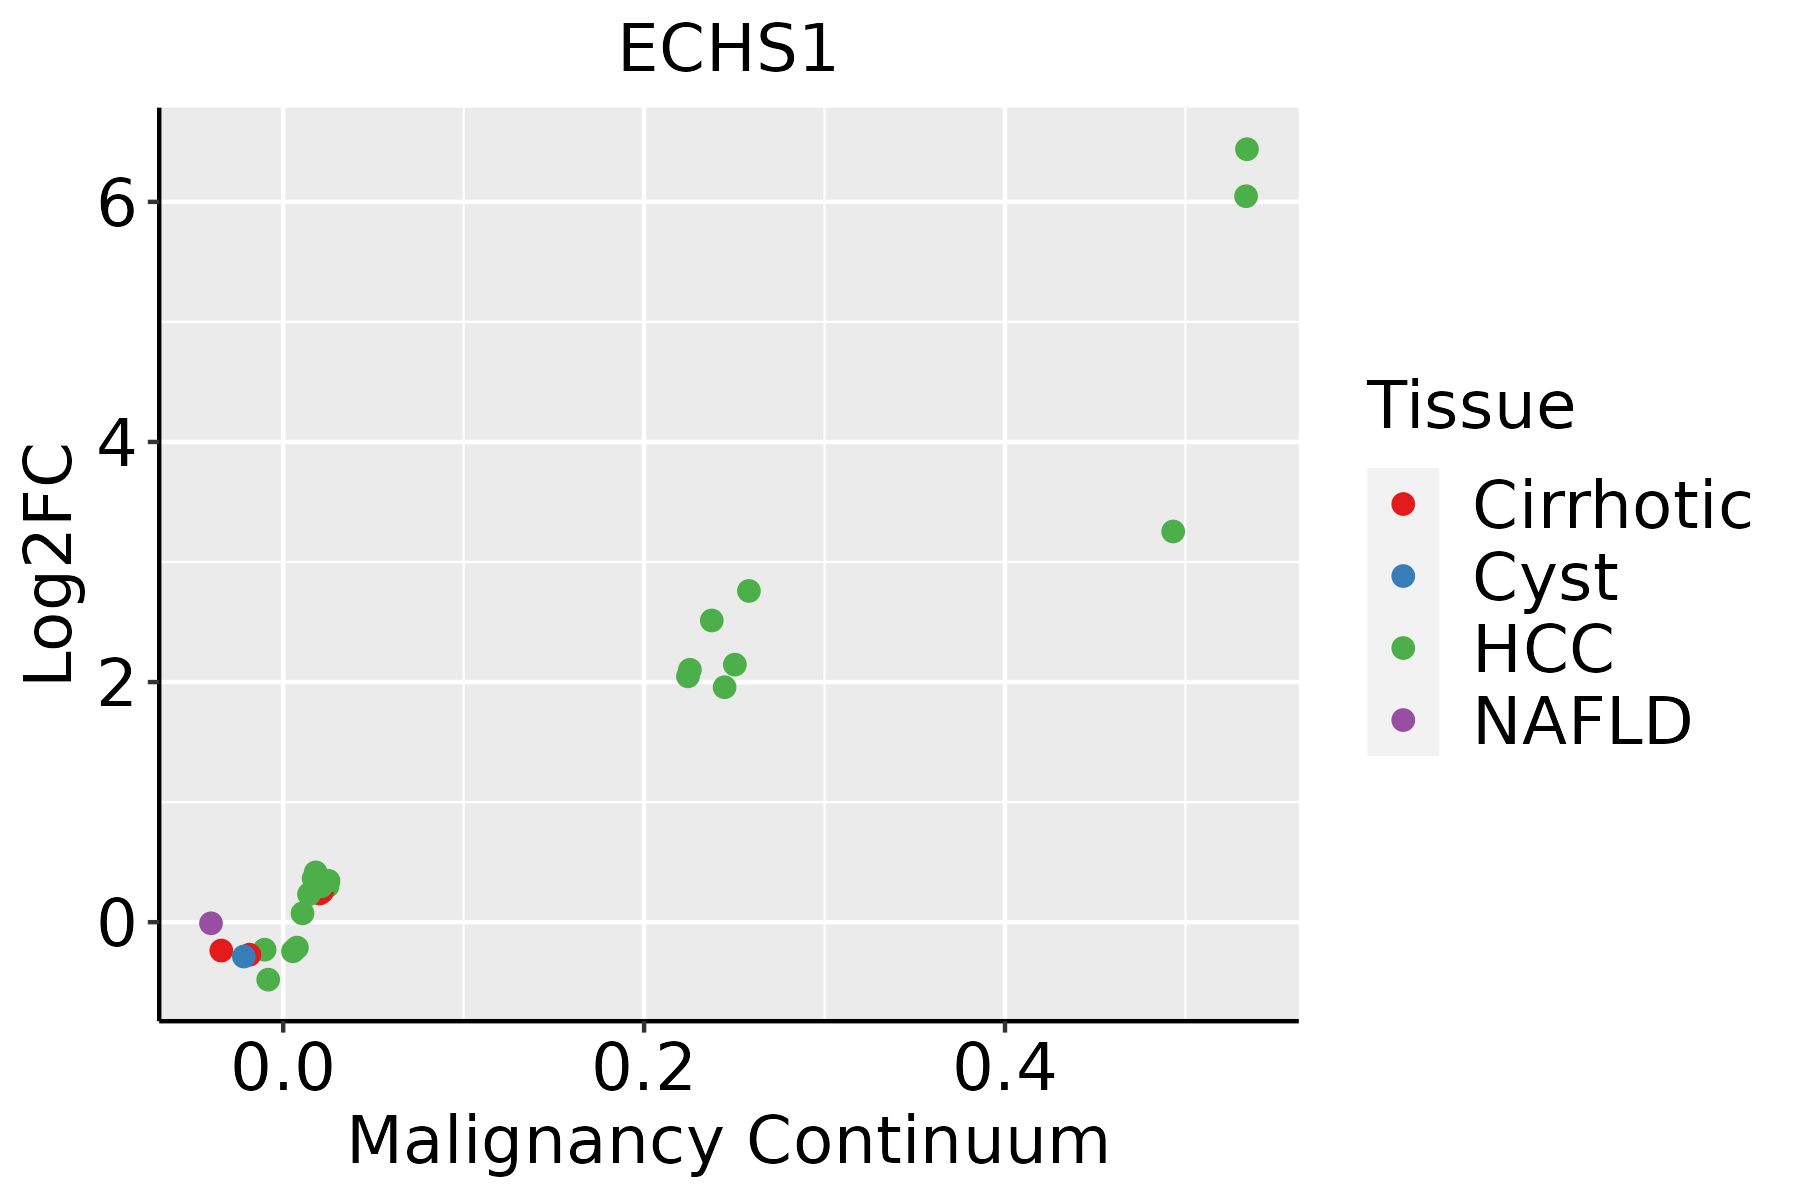 | HCC: Hepatocellular carcinoma |
| NAFLD: Non-alcoholic fatty liver disease | ||
| Oral Cavity | 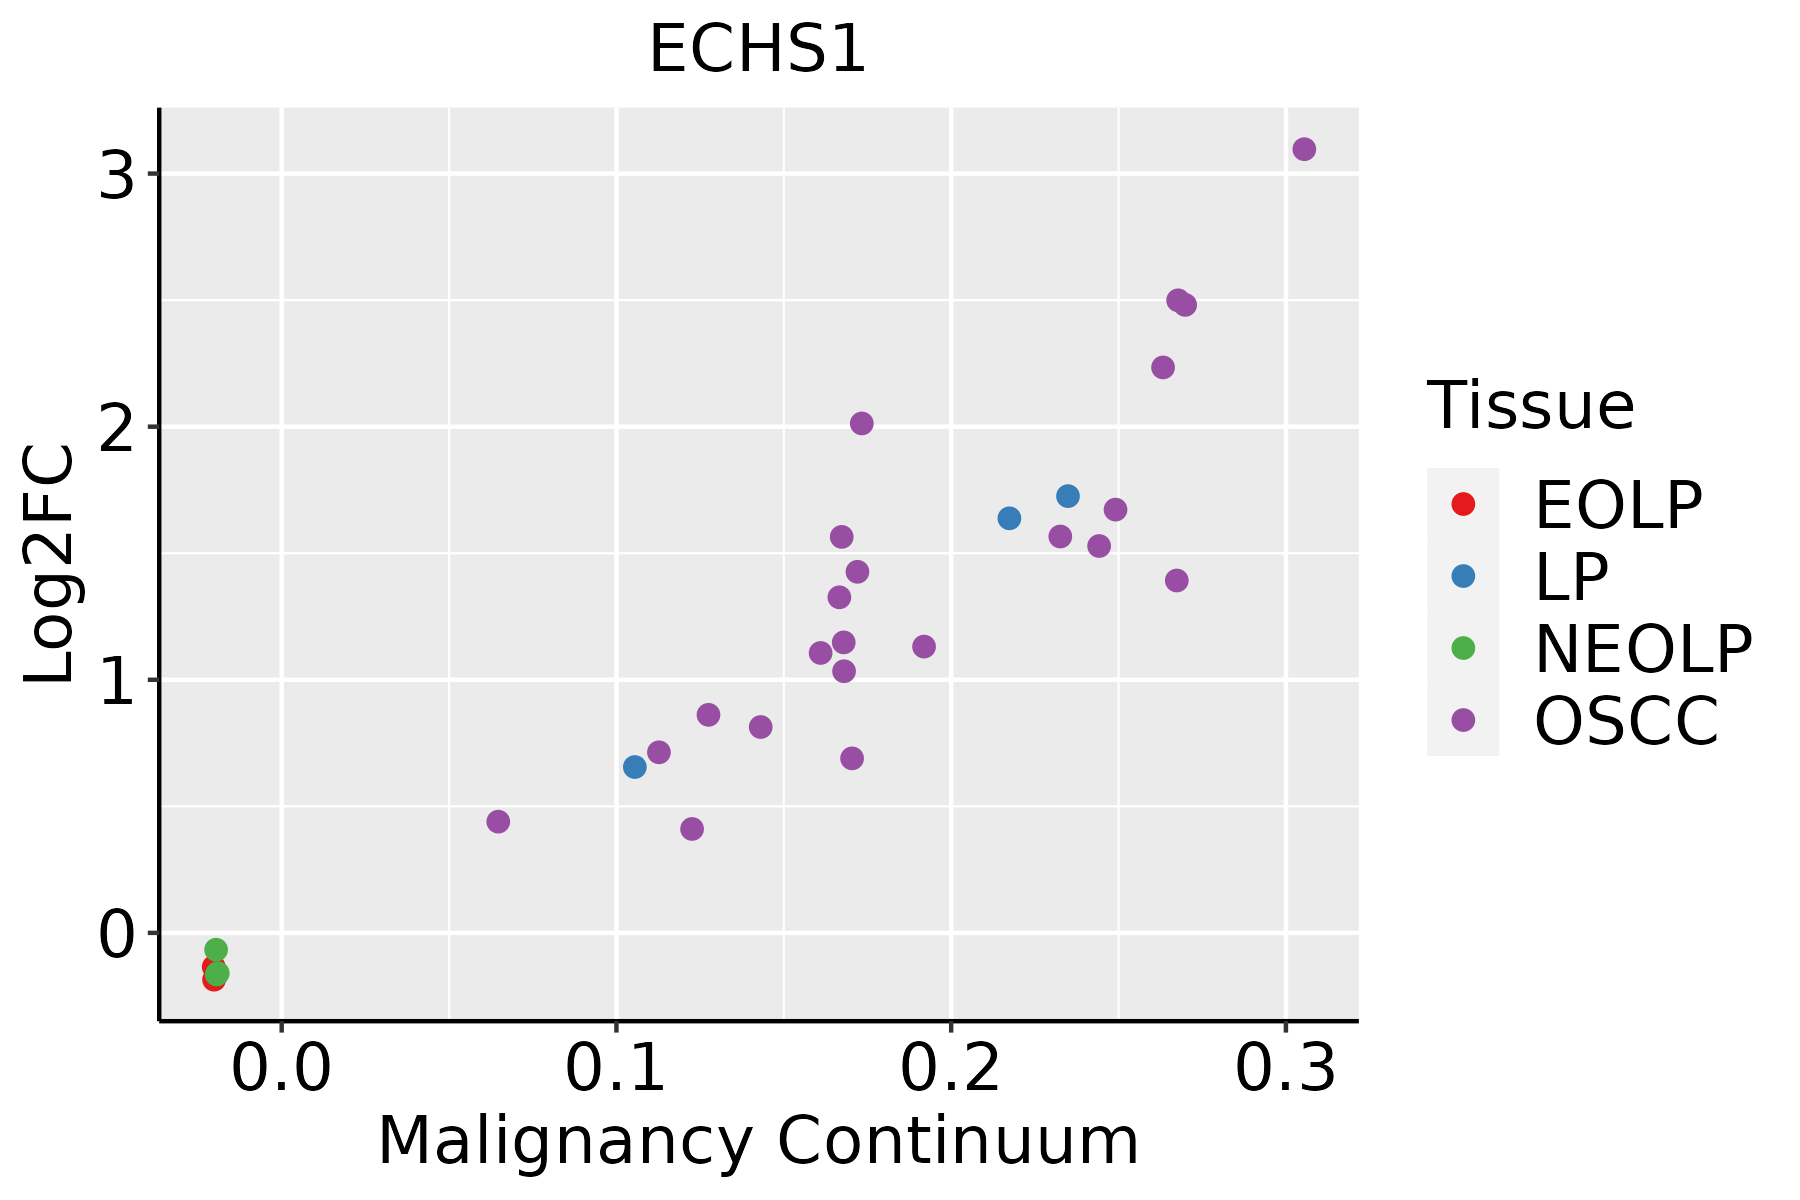 | EOLP: Erosive Oral lichen planus |
| LP: leukoplakia | ||
| NEOLP: Non-erosive oral lichen planus | ||
| OSCC: Oral squamous cell carcinoma | ||
| Prostate |  | BPH: Benign Prostatic Hyperplasia |
| Skin |  | AK: Actinic keratosis |
| cSCC: Cutaneous squamous cell carcinoma | ||
| SCCIS:squamous cell carcinoma in situ | ||
| Thyroid |  | ATC: Anaplastic thyroid cancer |
| HT: Hashimoto's thyroiditis | ||
| PTC: Papillary thyroid cancer |
| ∗log2FC in expression of this searched gene in stem-like cells from each diseased tissue sample relative to stem-like cells in normal samples in each tissue plotted against the malignancy continuum. Samples are colored based on if they are from different disease stage. |
Top |
Malignant transformation related pathway analysis |
| Find out the enriched GO biological processes and KEGG pathways involved in transition from healthy to precancer to cancer |
| Tissue | Disease Stage | Enriched GO biological Processes |
| Colorectum | AD |  |
| Colorectum | SER |  |
| Colorectum | MSS |  |
| Colorectum | MSI-H |  |
| Colorectum | FAP |  |
| ∗Top 15 enriched GO BP terms are showed in the bar plot of each disease state in each tissue. Each row represents a significant GO biological process which is colored according to the -log10(p.adjust). |
| Page: 1 2 3 4 5 6 7 8 9 |
| GO ID | Tissue | Disease Stage | Description | Gene Ratio | Bg Ratio | pvalue | p.adjust | Count |
| GO:0044282 | Colorectum | AD | small molecule catabolic process | 118/3918 | 376/18723 | 1.05e-06 | 3.55e-05 | 118 |
| GO:0006635 | Colorectum | AD | fatty acid beta-oxidation | 33/3918 | 74/18723 | 3.98e-06 | 1.09e-04 | 33 |
| GO:0009062 | Colorectum | AD | fatty acid catabolic process | 41/3918 | 100/18723 | 4.02e-06 | 1.09e-04 | 41 |
| GO:0019395 | Colorectum | AD | fatty acid oxidation | 40/3918 | 103/18723 | 2.43e-05 | 4.69e-04 | 40 |
| GO:0016042 | Colorectum | AD | lipid catabolic process | 97/3918 | 320/18723 | 4.31e-05 | 7.56e-04 | 97 |
| GO:0006631 | Colorectum | AD | fatty acid metabolic process | 114/3918 | 390/18723 | 5.58e-05 | 9.44e-04 | 114 |
| GO:0072329 | Colorectum | AD | monocarboxylic acid catabolic process | 44/3918 | 122/18723 | 8.05e-05 | 1.28e-03 | 44 |
| GO:0034440 | Colorectum | AD | lipid oxidation | 40/3918 | 108/18723 | 8.52e-05 | 1.32e-03 | 40 |
| GO:0030258 | Colorectum | AD | lipid modification | 67/3918 | 212/18723 | 1.66e-04 | 2.27e-03 | 67 |
| GO:0009083 | Colorectum | AD | branched-chain amino acid catabolic process | 10/3918 | 15/18723 | 1.68e-04 | 2.29e-03 | 10 |
| GO:0016054 | Colorectum | AD | organic acid catabolic process | 73/3918 | 240/18723 | 3.20e-04 | 3.81e-03 | 73 |
| GO:0044242 | Colorectum | AD | cellular lipid catabolic process | 66/3918 | 214/18723 | 3.96e-04 | 4.50e-03 | 66 |
| GO:0046395 | Colorectum | AD | carboxylic acid catabolic process | 70/3918 | 236/18723 | 9.06e-04 | 8.71e-03 | 70 |
| GO:0006520 | Colorectum | AD | cellular amino acid metabolic process | 81/3918 | 284/18723 | 1.37e-03 | 1.19e-02 | 81 |
| GO:0009081 | Colorectum | AD | branched-chain amino acid metabolic process | 10/3918 | 19/18723 | 2.25e-03 | 1.77e-02 | 10 |
| GO:00160421 | Colorectum | SER | lipid catabolic process | 77/2897 | 320/18723 | 3.52e-05 | 9.18e-04 | 77 |
| GO:00442821 | Colorectum | SER | small molecule catabolic process | 87/2897 | 376/18723 | 5.31e-05 | 1.27e-03 | 87 |
| GO:00090621 | Colorectum | SER | fatty acid catabolic process | 31/2897 | 100/18723 | 7.09e-05 | 1.61e-03 | 31 |
| GO:00066351 | Colorectum | SER | fatty acid beta-oxidation | 24/2897 | 74/18723 | 2.09e-04 | 3.77e-03 | 24 |
| GO:00723291 | Colorectum | SER | monocarboxylic acid catabolic process | 34/2897 | 122/18723 | 3.27e-04 | 5.22e-03 | 34 |
| Page: 1 2 3 4 5 |
| Pathway ID | Tissue | Disease Stage | Description | Gene Ratio | Bg Ratio | pvalue | p.adjust | qvalue | Count |
| hsa0120012 | Breast | Precancer | Carbon metabolism | 18/684 | 115/8465 | 4.79e-03 | 2.75e-02 | 2.11e-02 | 18 |
| hsa0120013 | Breast | Precancer | Carbon metabolism | 18/684 | 115/8465 | 4.79e-03 | 2.75e-02 | 2.11e-02 | 18 |
| hsa01200 | Colorectum | AD | Carbon metabolism | 55/2092 | 115/8465 | 5.53e-08 | 8.42e-07 | 5.37e-07 | 55 |
| hsa00280 | Colorectum | AD | Valine, leucine and isoleucine degradation | 25/2092 | 48/8465 | 3.97e-05 | 3.41e-04 | 2.18e-04 | 25 |
| hsa00640 | Colorectum | AD | Propanoate metabolism | 18/2092 | 32/8465 | 1.33e-04 | 1.11e-03 | 7.08e-04 | 18 |
| hsa00310 | Colorectum | AD | Lysine degradation | 27/2092 | 63/8465 | 1.17e-03 | 7.75e-03 | 4.94e-03 | 27 |
| hsa00071 | Colorectum | AD | Fatty acid degradation | 20/2092 | 43/8465 | 1.50e-03 | 8.69e-03 | 5.54e-03 | 20 |
| hsa012001 | Colorectum | AD | Carbon metabolism | 55/2092 | 115/8465 | 5.53e-08 | 8.42e-07 | 5.37e-07 | 55 |
| hsa002801 | Colorectum | AD | Valine, leucine and isoleucine degradation | 25/2092 | 48/8465 | 3.97e-05 | 3.41e-04 | 2.18e-04 | 25 |
| hsa006401 | Colorectum | AD | Propanoate metabolism | 18/2092 | 32/8465 | 1.33e-04 | 1.11e-03 | 7.08e-04 | 18 |
| hsa003101 | Colorectum | AD | Lysine degradation | 27/2092 | 63/8465 | 1.17e-03 | 7.75e-03 | 4.94e-03 | 27 |
| hsa000711 | Colorectum | AD | Fatty acid degradation | 20/2092 | 43/8465 | 1.50e-03 | 8.69e-03 | 5.54e-03 | 20 |
| hsa012002 | Colorectum | SER | Carbon metabolism | 40/1580 | 115/8465 | 2.77e-05 | 3.41e-04 | 2.47e-04 | 40 |
| hsa006402 | Colorectum | SER | Propanoate metabolism | 13/1580 | 32/8465 | 3.20e-03 | 2.12e-02 | 1.54e-02 | 13 |
| hsa00062 | Colorectum | SER | Fatty acid elongation | 11/1580 | 27/8465 | 6.38e-03 | 3.68e-02 | 2.67e-02 | 11 |
| hsa000712 | Colorectum | SER | Fatty acid degradation | 15/1580 | 43/8465 | 8.60e-03 | 4.26e-02 | 3.09e-02 | 15 |
| hsa012003 | Colorectum | SER | Carbon metabolism | 40/1580 | 115/8465 | 2.77e-05 | 3.41e-04 | 2.47e-04 | 40 |
| hsa006403 | Colorectum | SER | Propanoate metabolism | 13/1580 | 32/8465 | 3.20e-03 | 2.12e-02 | 1.54e-02 | 13 |
| hsa000621 | Colorectum | SER | Fatty acid elongation | 11/1580 | 27/8465 | 6.38e-03 | 3.68e-02 | 2.67e-02 | 11 |
| hsa000713 | Colorectum | SER | Fatty acid degradation | 15/1580 | 43/8465 | 8.60e-03 | 4.26e-02 | 3.09e-02 | 15 |
| Page: 1 2 3 4 5 |
Top |
Cell-cell communication analysis |
| Identification of potential cell-cell interactions between two cell types and their ligand-receptor pairs for different disease states |
| Ligand | Receptor | LRpair | Pathway | Tissue | Disease Stage |
| Page: 1 |
Top |
Single-cell gene regulatory network inference analysis |
| Find out the significant the regulons (TFs) and the target genes of each regulon across cell types for different disease states |
| TF | Cell Type | Tissue | Disease Stage | Target Gene | RSS | Regulon Activity |
| ∗The dot plots of a searched regulon are shown for all cell subpopulations in each disease state of each tissue based on the regulon specific score inferred using pySCENIC and by calculating the average expression. |
| Page: 1 |
Top |
Somatic mutation of malignant transformation related genes |
| Annotation of somatic variants for genes involved in malignant transformation |
| Hugo Symbol | Variant Class | Variant Classification | dbSNP RS | HGVSc | HGVSp | HGVSp Short | SWISSPROT | BIOTYPE | SIFT | PolyPhen | Tumor Sample Barcode | Tissue | Histology | Sex | Age | Stage | Therapy Types | Drugs | Outcome |
| ECHS1 | SNV | Missense_Mutation | novel | c.700N>C | p.Lys234Gln | p.K234Q | P30084 | protein_coding | tolerated(0.59) | benign(0.035) | TCGA-AN-A0FW-01 | Breast | breast invasive carcinoma | Female | >=65 | III/IV | Unknown | Unknown | SD |
| ECHS1 | SNV | Missense_Mutation | novel | c.300N>G | p.Ile100Met | p.I100M | P30084 | protein_coding | deleterious(0) | probably_damaging(0.998) | TCGA-LD-A7W5-01 | Breast | breast invasive carcinoma | Female | <65 | III/IV | Chemotherapy | taxotere | SD |
| ECHS1 | insertion | Frame_Shift_Ins | novel | c.701_702insGTTTACTG | p.Ile235PhefsTer5 | p.I235Ffs*5 | P30084 | protein_coding | TCGA-AN-A0FW-01 | Breast | breast invasive carcinoma | Female | >=65 | III/IV | Unknown | Unknown | SD | ||
| ECHS1 | SNV | Missense_Mutation | rs575638199 | c.815N>A | p.Arg272Gln | p.R272Q | P30084 | protein_coding | tolerated(1) | possibly_damaging(0.757) | TCGA-A6-6780-01 | Colorectum | colon adenocarcinoma | Male | >=65 | I/II | Unknown | Unknown | SD |
| ECHS1 | SNV | Missense_Mutation | c.531N>T | p.Gln177His | p.Q177H | P30084 | protein_coding | deleterious(0.02) | possibly_damaging(0.902) | TCGA-AD-6889-01 | Colorectum | colon adenocarcinoma | Male | >=65 | I/II | Chemotherapy | xeloda | PD | |
| ECHS1 | SNV | Missense_Mutation | rs745362960 | c.112N>A | p.Ala38Thr | p.A38T | P30084 | protein_coding | tolerated(0.54) | benign(0) | TCGA-AY-6386-01 | Colorectum | colon adenocarcinoma | Female | >=65 | III/IV | Chemotherapy | 5-fu | SD |
| ECHS1 | SNV | Missense_Mutation | c.53N>T | p.Pro18Leu | p.P18L | P30084 | protein_coding | tolerated(0.74) | benign(0) | TCGA-NH-A5IV-01 | Colorectum | colon adenocarcinoma | Female | >=65 | I/II | Unknown | Unknown | SD | |
| ECHS1 | deletion | Frame_Shift_Del | novel | c.147_150delNNNN | p.Leu49PhefsTer3 | p.L49Ffs*3 | P30084 | protein_coding | TCGA-A6-3808-01 | Colorectum | colon adenocarcinoma | Male | >=65 | I/II | Unknown | Unknown | SD | ||
| ECHS1 | insertion | Frame_Shift_Ins | novel | c.685dupA | p.Ile229AsnfsTer6 | p.I229Nfs*6 | P30084 | protein_coding | TCGA-EI-6507-01 | Colorectum | rectum adenocarcinoma | Male | <65 | I/II | Unknown | Unknown | SD | ||
| ECHS1 | SNV | Missense_Mutation | rs200293355 | c.557N>T | p.Ser186Leu | p.S186L | P30084 | protein_coding | deleterious(0) | probably_damaging(0.999) | TCGA-A5-A1OF-01 | Endometrium | uterine corpus endometrioid carcinoma | Female | <65 | I/II | Unknown | Unknown | SD |
| Page: 1 2 3 4 |
Top |
Related drugs of malignant transformation related genes |
| Identification of chemicals and drugs interact with genes involved in malignant transfromation |
| (DGIdb 4.0) |
| Entrez ID | Symbol | Category | Interaction Types | Drug Claim Name | Drug Name | PMIDs |
| Page: 1 |

Copyright 2023-Present -The University of Texas Health Science Center at Houston |