
|
|||||
|
 | |
| |
| |
| |
| |
| |
|
Gene: ECHDC3 |
Gene summary for ECHDC3 |
| Gene information | Species | Human | Gene symbol | ECHDC3 | Gene ID | 79746 |
| Gene name | enoyl-CoA hydratase domain containing 3 | |
| Gene Alias | ECHDC3 | |
| Cytomap | 10p14 | |
| Gene Type | protein-coding | GO ID | GO:0006082 | UniProtAcc | A0A140VKF9 |
Top |
Malignant transformation analysis |
| Identification of the aberrant gene expression in precancerous and cancerous lesions by comparing the gene expression of stem-like cells in diseased tissues with normal stem cells |
| Entrez ID | Symbol | Replicates | Species | Organ | Tissue | Adj P-value | Log2FC | Malignancy |
| 79746 | ECHDC3 | LZE4T | Human | Esophagus | ESCC | 2.26e-02 | 1.30e-01 | 0.0811 |
| 79746 | ECHDC3 | P1T-E | Human | Esophagus | ESCC | 8.88e-03 | 2.76e-01 | 0.0875 |
| 79746 | ECHDC3 | P2T-E | Human | Esophagus | ESCC | 9.14e-50 | 6.62e-01 | 0.1177 |
| 79746 | ECHDC3 | P5T-E | Human | Esophagus | ESCC | 2.56e-16 | 3.77e-01 | 0.1327 |
| 79746 | ECHDC3 | P9T-E | Human | Esophagus | ESCC | 2.21e-13 | 4.34e-01 | 0.1131 |
| 79746 | ECHDC3 | P12T-E | Human | Esophagus | ESCC | 5.30e-21 | 3.84e-01 | 0.1122 |
| 79746 | ECHDC3 | P15T-E | Human | Esophagus | ESCC | 3.83e-24 | 5.60e-01 | 0.1149 |
| 79746 | ECHDC3 | P16T-E | Human | Esophagus | ESCC | 2.93e-15 | 2.51e-01 | 0.1153 |
| 79746 | ECHDC3 | P17T-E | Human | Esophagus | ESCC | 1.65e-06 | 3.28e-01 | 0.1278 |
| 79746 | ECHDC3 | P21T-E | Human | Esophagus | ESCC | 1.02e-31 | 5.73e-01 | 0.1617 |
| 79746 | ECHDC3 | P22T-E | Human | Esophagus | ESCC | 3.89e-12 | 2.28e-01 | 0.1236 |
| 79746 | ECHDC3 | P23T-E | Human | Esophagus | ESCC | 1.83e-08 | 3.09e-01 | 0.108 |
| 79746 | ECHDC3 | P24T-E | Human | Esophagus | ESCC | 5.95e-29 | 5.54e-01 | 0.1287 |
| 79746 | ECHDC3 | P26T-E | Human | Esophagus | ESCC | 6.38e-31 | 6.10e-01 | 0.1276 |
| 79746 | ECHDC3 | P31T-E | Human | Esophagus | ESCC | 1.25e-26 | 4.33e-01 | 0.1251 |
| 79746 | ECHDC3 | P32T-E | Human | Esophagus | ESCC | 9.56e-08 | 1.83e-01 | 0.1666 |
| 79746 | ECHDC3 | P37T-E | Human | Esophagus | ESCC | 6.15e-13 | 3.41e-01 | 0.1371 |
| 79746 | ECHDC3 | P39T-E | Human | Esophagus | ESCC | 1.96e-05 | 1.26e-01 | 0.0894 |
| 79746 | ECHDC3 | P40T-E | Human | Esophagus | ESCC | 3.78e-19 | 5.68e-01 | 0.109 |
| 79746 | ECHDC3 | P44T-E | Human | Esophagus | ESCC | 4.30e-03 | 1.63e-01 | 0.1096 |
| Page: 1 2 3 |
| Tissue | Expression Dynamics | Abbreviation |
| Esophagus |  | ESCC: Esophageal squamous cell carcinoma |
| HGIN: High-grade intraepithelial neoplasias | ||
| LGIN: Low-grade intraepithelial neoplasias | ||
| Liver | 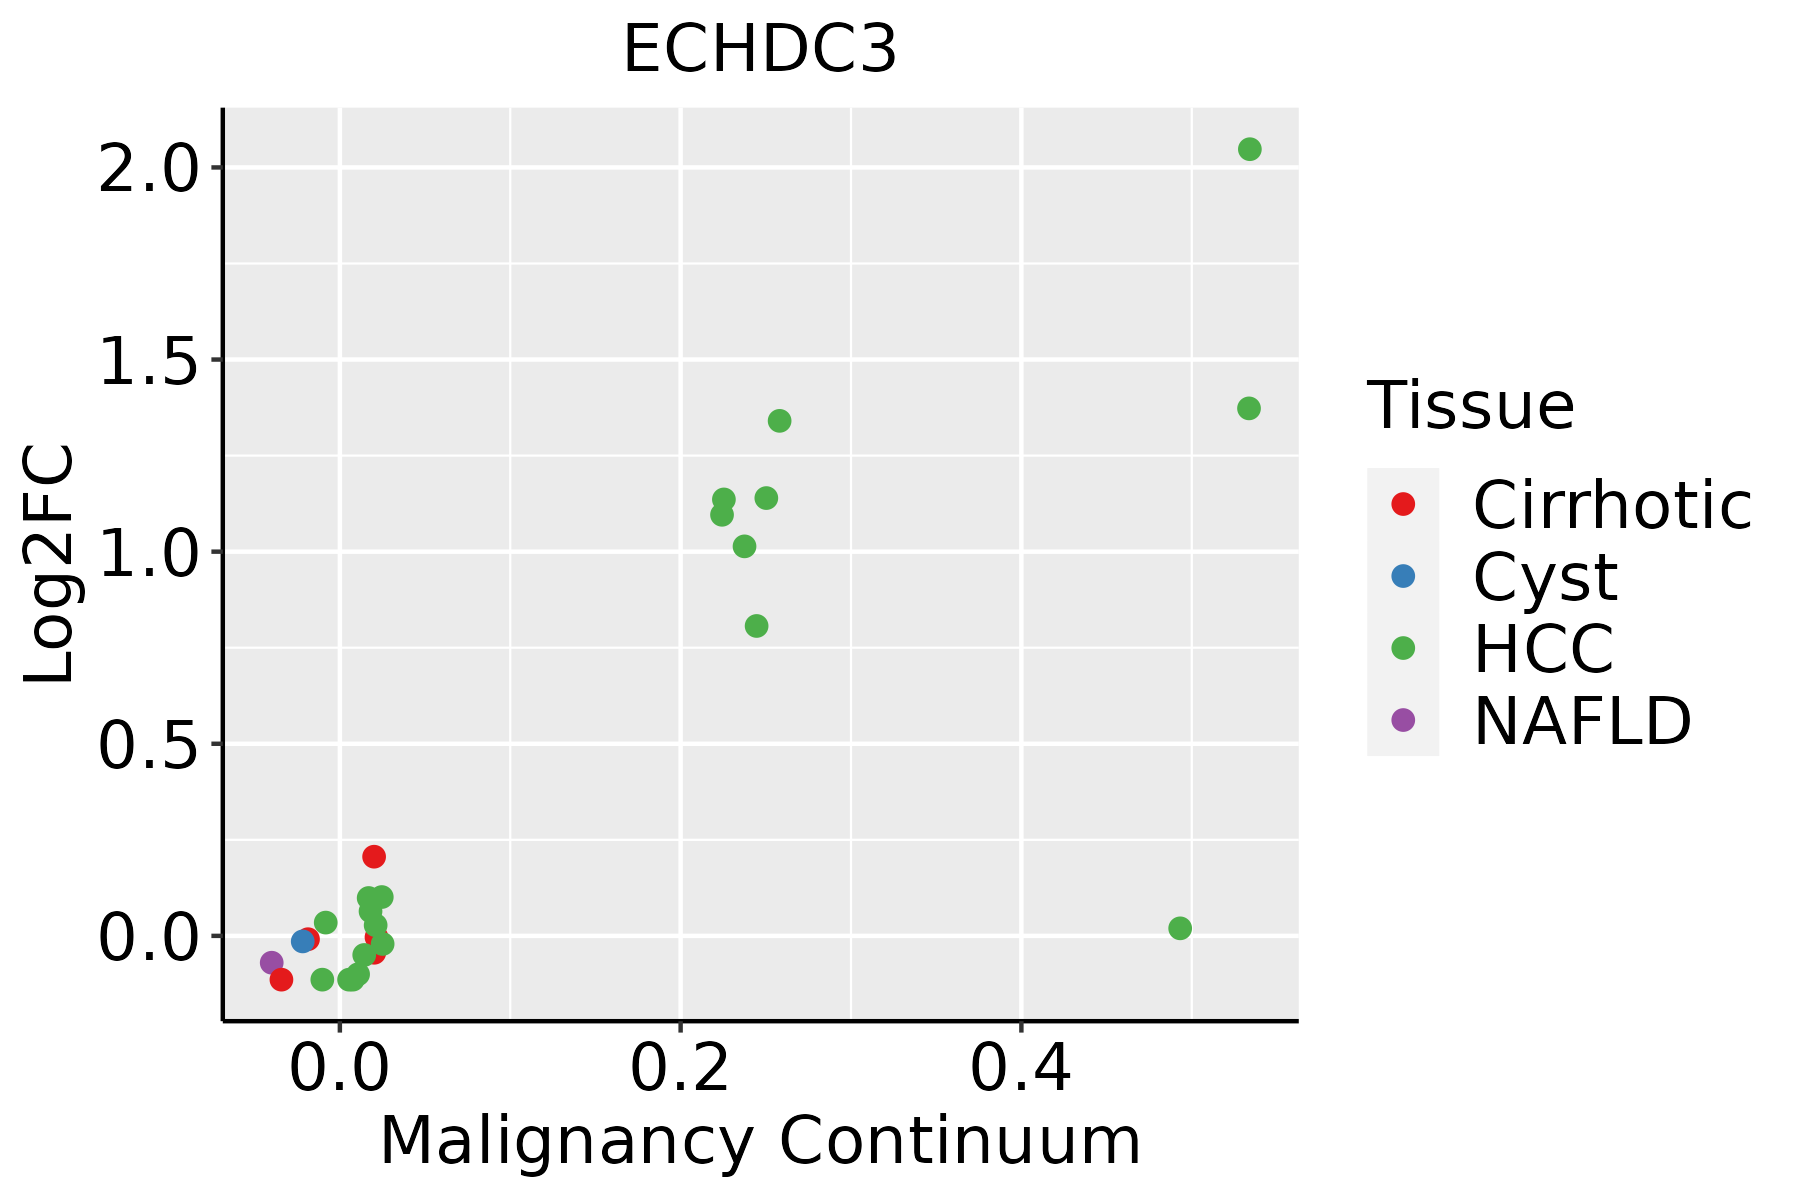 | HCC: Hepatocellular carcinoma |
| NAFLD: Non-alcoholic fatty liver disease | ||
| Oral Cavity | 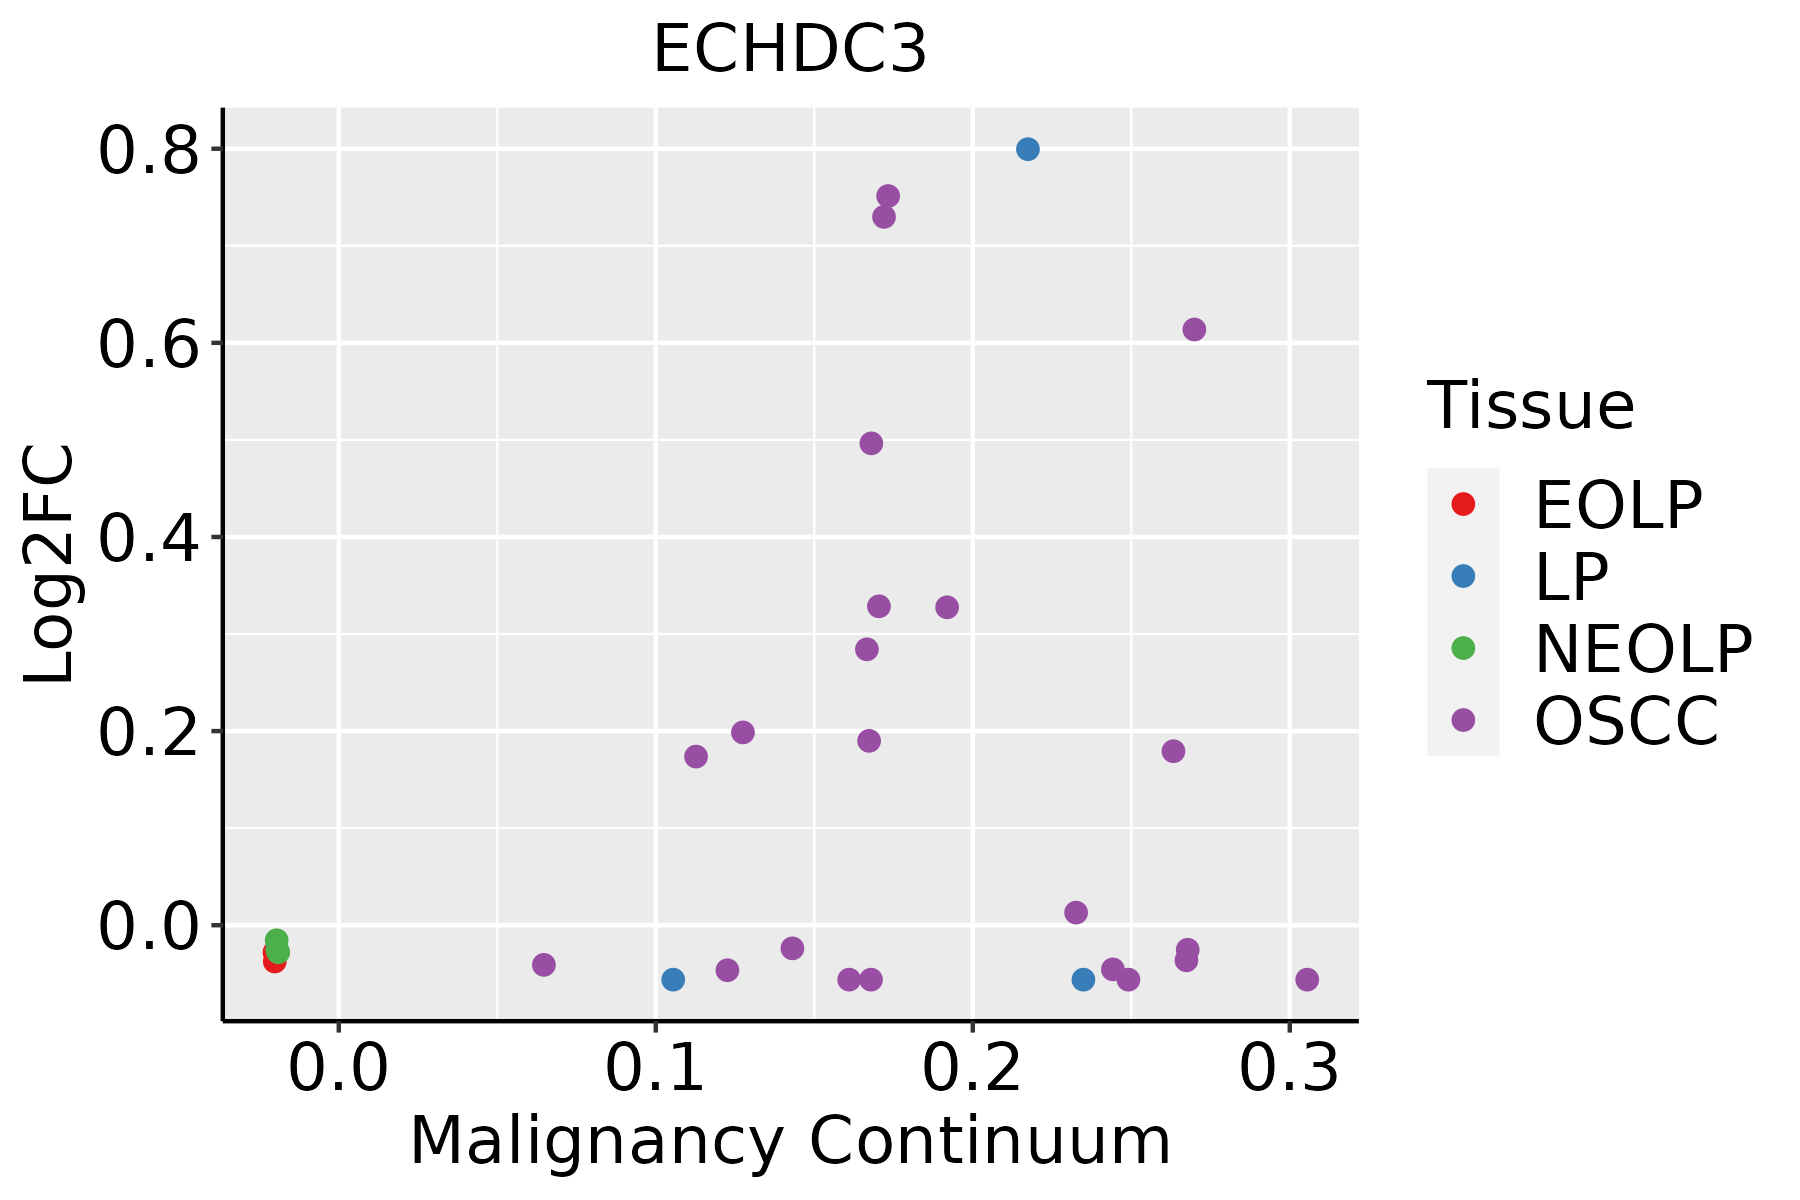 | EOLP: Erosive Oral lichen planus |
| LP: leukoplakia | ||
| NEOLP: Non-erosive oral lichen planus | ||
| OSCC: Oral squamous cell carcinoma |
| ∗log2FC in expression of this searched gene in stem-like cells from each diseased tissue sample relative to stem-like cells in normal samples in each tissue plotted against the malignancy continuum. Samples are colored based on if they are from different disease stage. |
Top |
Malignant transformation related pathway analysis |
| Find out the enriched GO biological processes and KEGG pathways involved in transition from healthy to precancer to cancer |
| Tissue | Disease Stage | Enriched GO biological Processes |
| Colorectum | AD |  |
| Colorectum | SER |  |
| Colorectum | MSS |  |
| Colorectum | MSI-H |  |
| Colorectum | FAP |  |
| ∗Top 15 enriched GO BP terms are showed in the bar plot of each disease state in each tissue. Each row represents a significant GO biological process which is colored according to the -log10(p.adjust). |
| Page: 1 2 3 4 5 6 7 8 9 |
| GO ID | Tissue | Disease Stage | Description | Gene Ratio | Bg Ratio | pvalue | p.adjust | Count |
| GO:190165319 | Esophagus | ESCC | cellular response to peptide | 208/8552 | 359/18723 | 1.68e-06 | 2.01e-05 | 208 |
| GO:0043434111 | Esophagus | ESCC | response to peptide hormone | 234/8552 | 414/18723 | 4.93e-06 | 5.21e-05 | 234 |
| GO:003286918 | Esophagus | ESCC | cellular response to insulin stimulus | 124/8552 | 203/18723 | 6.63e-06 | 6.75e-05 | 124 |
| GO:003286818 | Esophagus | ESCC | response to insulin | 156/8552 | 264/18723 | 7.21e-06 | 7.20e-05 | 156 |
| GO:00066318 | Esophagus | ESCC | fatty acid metabolic process | 217/8552 | 390/18723 | 4.21e-05 | 3.39e-04 | 217 |
| GO:007137516 | Esophagus | ESCC | cellular response to peptide hormone stimulus | 166/8552 | 290/18723 | 4.48e-05 | 3.55e-04 | 166 |
| GO:000663112 | Liver | Cirrhotic | fatty acid metabolic process | 165/4634 | 390/18723 | 1.29e-14 | 1.26e-12 | 165 |
| GO:004343412 | Liver | Cirrhotic | response to peptide hormone | 149/4634 | 414/18723 | 1.70e-07 | 4.49e-06 | 149 |
| GO:007137511 | Liver | Cirrhotic | cellular response to peptide hormone stimulus | 110/4634 | 290/18723 | 3.73e-07 | 8.82e-06 | 110 |
| GO:190165311 | Liver | Cirrhotic | cellular response to peptide | 129/4634 | 359/18723 | 1.23e-06 | 2.49e-05 | 129 |
| GO:003286911 | Liver | Cirrhotic | cellular response to insulin stimulus | 80/4634 | 203/18723 | 2.55e-06 | 4.63e-05 | 80 |
| GO:003286811 | Liver | Cirrhotic | response to insulin | 95/4634 | 264/18723 | 2.77e-05 | 3.54e-04 | 95 |
| GO:19000782 | Liver | Cirrhotic | positive regulation of cellular response to insulin stimulus | 15/4634 | 25/18723 | 1.88e-04 | 1.75e-03 | 15 |
| GO:19000761 | Liver | Cirrhotic | regulation of cellular response to insulin stimulus | 26/4634 | 64/18723 | 3.69e-03 | 2.03e-02 | 26 |
| GO:003286821 | Liver | HCC | response to insulin | 172/7958 | 264/18723 | 7.14e-14 | 4.23e-12 | 172 |
| GO:000663122 | Liver | HCC | fatty acid metabolic process | 238/7958 | 390/18723 | 8.24e-14 | 4.84e-12 | 238 |
| GO:003286921 | Liver | HCC | cellular response to insulin stimulus | 137/7958 | 203/18723 | 4.69e-13 | 2.44e-11 | 137 |
| GO:004343422 | Liver | HCC | response to peptide hormone | 247/7958 | 414/18723 | 9.55e-13 | 4.77e-11 | 247 |
| GO:007137521 | Liver | HCC | cellular response to peptide hormone stimulus | 179/7958 | 290/18723 | 2.54e-11 | 9.88e-10 | 179 |
| GO:190165321 | Liver | HCC | cellular response to peptide | 211/7958 | 359/18723 | 2.86e-10 | 9.63e-09 | 211 |
| Page: 1 2 |
| Pathway ID | Tissue | Disease Stage | Description | Gene Ratio | Bg Ratio | pvalue | p.adjust | qvalue | Count |
| Page: 1 |
Top |
Cell-cell communication analysis |
| Identification of potential cell-cell interactions between two cell types and their ligand-receptor pairs for different disease states |
| Ligand | Receptor | LRpair | Pathway | Tissue | Disease Stage |
| Page: 1 |
Top |
Single-cell gene regulatory network inference analysis |
| Find out the significant the regulons (TFs) and the target genes of each regulon across cell types for different disease states |
| TF | Cell Type | Tissue | Disease Stage | Target Gene | RSS | Regulon Activity |
| ∗The dot plots of a searched regulon are shown for all cell subpopulations in each disease state of each tissue based on the regulon specific score inferred using pySCENIC and by calculating the average expression. |
| Page: 1 |
Top |
Somatic mutation of malignant transformation related genes |
| Annotation of somatic variants for genes involved in malignant transformation |
| Hugo Symbol | Variant Class | Variant Classification | dbSNP RS | HGVSc | HGVSp | HGVSp Short | SWISSPROT | BIOTYPE | SIFT | PolyPhen | Tumor Sample Barcode | Tissue | Histology | Sex | Age | Stage | Therapy Types | Drugs | Outcome |
| ECHDC3 | SNV | Missense_Mutation | c.343G>C | p.Glu115Gln | p.E115Q | Q96DC8 | protein_coding | tolerated(0.11) | benign(0.006) | TCGA-C8-A1HM-01 | Breast | breast invasive carcinoma | Female | >=65 | I/II | Chemotherapy | doxorubicin | CR | |
| ECHDC3 | SNV | Missense_Mutation | c.887N>A | p.Pro296His | p.P296H | Q96DC8 | protein_coding | deleterious(0) | probably_damaging(0.999) | TCGA-AP-A059-01 | Endometrium | uterine corpus endometrioid carcinoma | Female | >=65 | I/II | Unknown | Unknown | SD | |
| ECHDC3 | SNV | Missense_Mutation | novel | c.202N>G | p.Asn68Asp | p.N68D | Q96DC8 | protein_coding | deleterious(0.02) | probably_damaging(0.999) | TCGA-B5-A1MR-01 | Endometrium | uterine corpus endometrioid carcinoma | Female | >=65 | III/IV | Unknown | Unknown | SD |
| ECHDC3 | SNV | Missense_Mutation | rs767063336 | c.230N>A | p.Ser77Tyr | p.S77Y | Q96DC8 | protein_coding | deleterious(0.02) | possibly_damaging(0.515) | TCGA-B5-A3FA-01 | Endometrium | uterine corpus endometrioid carcinoma | Female | >=65 | I/II | Unknown | Unknown | SD |
| ECHDC3 | SNV | Missense_Mutation | novel | c.370N>T | p.Val124Leu | p.V124L | Q96DC8 | protein_coding | deleterious(0.02) | benign(0.023) | TCGA-B5-A3FC-01 | Endometrium | uterine corpus endometrioid carcinoma | Female | <65 | I/II | Unknown | Unknown | SD |
| ECHDC3 | SNV | Missense_Mutation | rs375815859 | c.460N>A | p.Gly154Ser | p.G154S | Q96DC8 | protein_coding | deleterious(0) | probably_damaging(1) | TCGA-B5-A3FC-01 | Endometrium | uterine corpus endometrioid carcinoma | Female | <65 | I/II | Unknown | Unknown | SD |
| ECHDC3 | SNV | Missense_Mutation | novel | c.500G>A | p.Ser167Asn | p.S167N | Q96DC8 | protein_coding | deleterious(0) | possibly_damaging(0.854) | TCGA-B5-A5OC-01 | Endometrium | uterine corpus endometrioid carcinoma | Female | >=65 | III/IV | Chemotherapy | cisplatin | SD |
| ECHDC3 | SNV | Missense_Mutation | novel | c.595G>A | p.Ala199Thr | p.A199T | Q96DC8 | protein_coding | deleterious(0) | probably_damaging(0.921) | TCGA-D1-A103-01 | Endometrium | uterine corpus endometrioid carcinoma | Female | >=65 | I/II | Unknown | Unknown | SD |
| ECHDC3 | SNV | Missense_Mutation | novel | c.518C>T | p.Ala173Val | p.A173V | Q96DC8 | protein_coding | deleterious(0) | possibly_damaging(0.461) | TCGA-DF-A2KU-01 | Endometrium | uterine corpus endometrioid carcinoma | Female | Unknown | I/II | Unknown | Unknown | SD |
| ECHDC3 | SNV | Missense_Mutation | novel | c.901N>A | p.Glu301Lys | p.E301K | Q96DC8 | protein_coding | tolerated(0.59) | benign(0.062) | TCGA-EO-A22U-01 | Endometrium | uterine corpus endometrioid carcinoma | Female | >=65 | I/II | Unknown | Unknown | SD |
| Page: 1 2 |
Top |
Related drugs of malignant transformation related genes |
| Identification of chemicals and drugs interact with genes involved in malignant transfromation |
| (DGIdb 4.0) |
| Entrez ID | Symbol | Category | Interaction Types | Drug Claim Name | Drug Name | PMIDs |
| Page: 1 |

Copyright 2023-Present -The University of Texas Health Science Center at Houston |