
|
|||||
|
 | |
| |
| |
| |
| |
| |
|
Gene: ECHDC2 |
Gene summary for ECHDC2 |
| Gene information | Species | Human | Gene symbol | ECHDC2 | Gene ID | 55268 |
| Gene name | enoyl-CoA hydratase domain containing 2 | |
| Gene Alias | ECHDC2 | |
| Cytomap | 1p32.3 | |
| Gene Type | protein-coding | GO ID | GO:0006082 | UniProtAcc | Q86YB7 |
Top |
Malignant transformation analysis |
| Identification of the aberrant gene expression in precancerous and cancerous lesions by comparing the gene expression of stem-like cells in diseased tissues with normal stem cells |
| Entrez ID | Symbol | Replicates | Species | Organ | Tissue | Adj P-value | Log2FC | Malignancy |
| 55268 | ECHDC2 | HTA11_1938_2000001011 | Human | Colorectum | AD | 2.95e-04 | 5.47e-01 | -0.0811 |
| 55268 | ECHDC2 | HTA11_347_2000001011 | Human | Colorectum | AD | 5.34e-15 | 6.65e-01 | -0.1954 |
| 55268 | ECHDC2 | HTA11_696_2000001011 | Human | Colorectum | AD | 4.36e-12 | 5.85e-01 | -0.1464 |
| 55268 | ECHDC2 | HTA11_866_2000001011 | Human | Colorectum | AD | 5.15e-07 | 5.39e-01 | -0.1001 |
| 55268 | ECHDC2 | HTA11_1391_2000001011 | Human | Colorectum | AD | 4.03e-07 | 6.01e-01 | -0.059 |
| 55268 | ECHDC2 | HTA11_546_2000001011 | Human | Colorectum | AD | 3.23e-02 | 5.48e-01 | -0.0842 |
| 55268 | ECHDC2 | HTA11_7663_2000001011 | Human | Colorectum | SER | 8.71e-03 | 8.49e-01 | 0.0131 |
| 55268 | ECHDC2 | HTA11_10711_2000001011 | Human | Colorectum | AD | 2.96e-07 | 5.22e-01 | 0.0338 |
| 55268 | ECHDC2 | HTA11_7696_3000711011 | Human | Colorectum | AD | 1.04e-04 | 5.31e-01 | 0.0674 |
| 55268 | ECHDC2 | A015-C-203 | Human | Colorectum | FAP | 1.17e-21 | -1.33e-01 | -0.1294 |
| 55268 | ECHDC2 | A002-C-201 | Human | Colorectum | FAP | 2.10e-08 | -3.27e-01 | 0.0324 |
| 55268 | ECHDC2 | A002-C-203 | Human | Colorectum | FAP | 1.55e-07 | -1.80e-01 | 0.2786 |
| 55268 | ECHDC2 | A001-C-119 | Human | Colorectum | FAP | 9.43e-05 | -4.48e-01 | -0.1557 |
| 55268 | ECHDC2 | A001-C-108 | Human | Colorectum | FAP | 1.51e-09 | -1.74e-01 | -0.0272 |
| 55268 | ECHDC2 | A002-C-205 | Human | Colorectum | FAP | 5.84e-16 | -3.77e-01 | -0.1236 |
| 55268 | ECHDC2 | A001-C-104 | Human | Colorectum | FAP | 3.32e-03 | -1.26e-01 | 0.0184 |
| 55268 | ECHDC2 | A015-C-006 | Human | Colorectum | FAP | 3.07e-10 | -3.46e-01 | -0.0994 |
| 55268 | ECHDC2 | A015-C-106 | Human | Colorectum | FAP | 4.23e-06 | -3.94e-02 | -0.0511 |
| 55268 | ECHDC2 | A002-C-114 | Human | Colorectum | FAP | 1.93e-10 | -1.93e-01 | -0.1561 |
| 55268 | ECHDC2 | A015-C-104 | Human | Colorectum | FAP | 8.05e-21 | -1.73e-01 | -0.1899 |
| Page: 1 2 3 4 5 6 7 8 9 |
| Tissue | Expression Dynamics | Abbreviation |
| Colorectum (GSE201348) |  | FAP: Familial adenomatous polyposis |
| CRC: Colorectal cancer | ||
| Colorectum (HTA11) |  | AD: Adenomas |
| SER: Sessile serrated lesions | ||
| MSI-H: Microsatellite-high colorectal cancer | ||
| MSS: Microsatellite stable colorectal cancer | ||
| Esophagus |  | ESCC: Esophageal squamous cell carcinoma |
| HGIN: High-grade intraepithelial neoplasias | ||
| LGIN: Low-grade intraepithelial neoplasias | ||
| Liver | 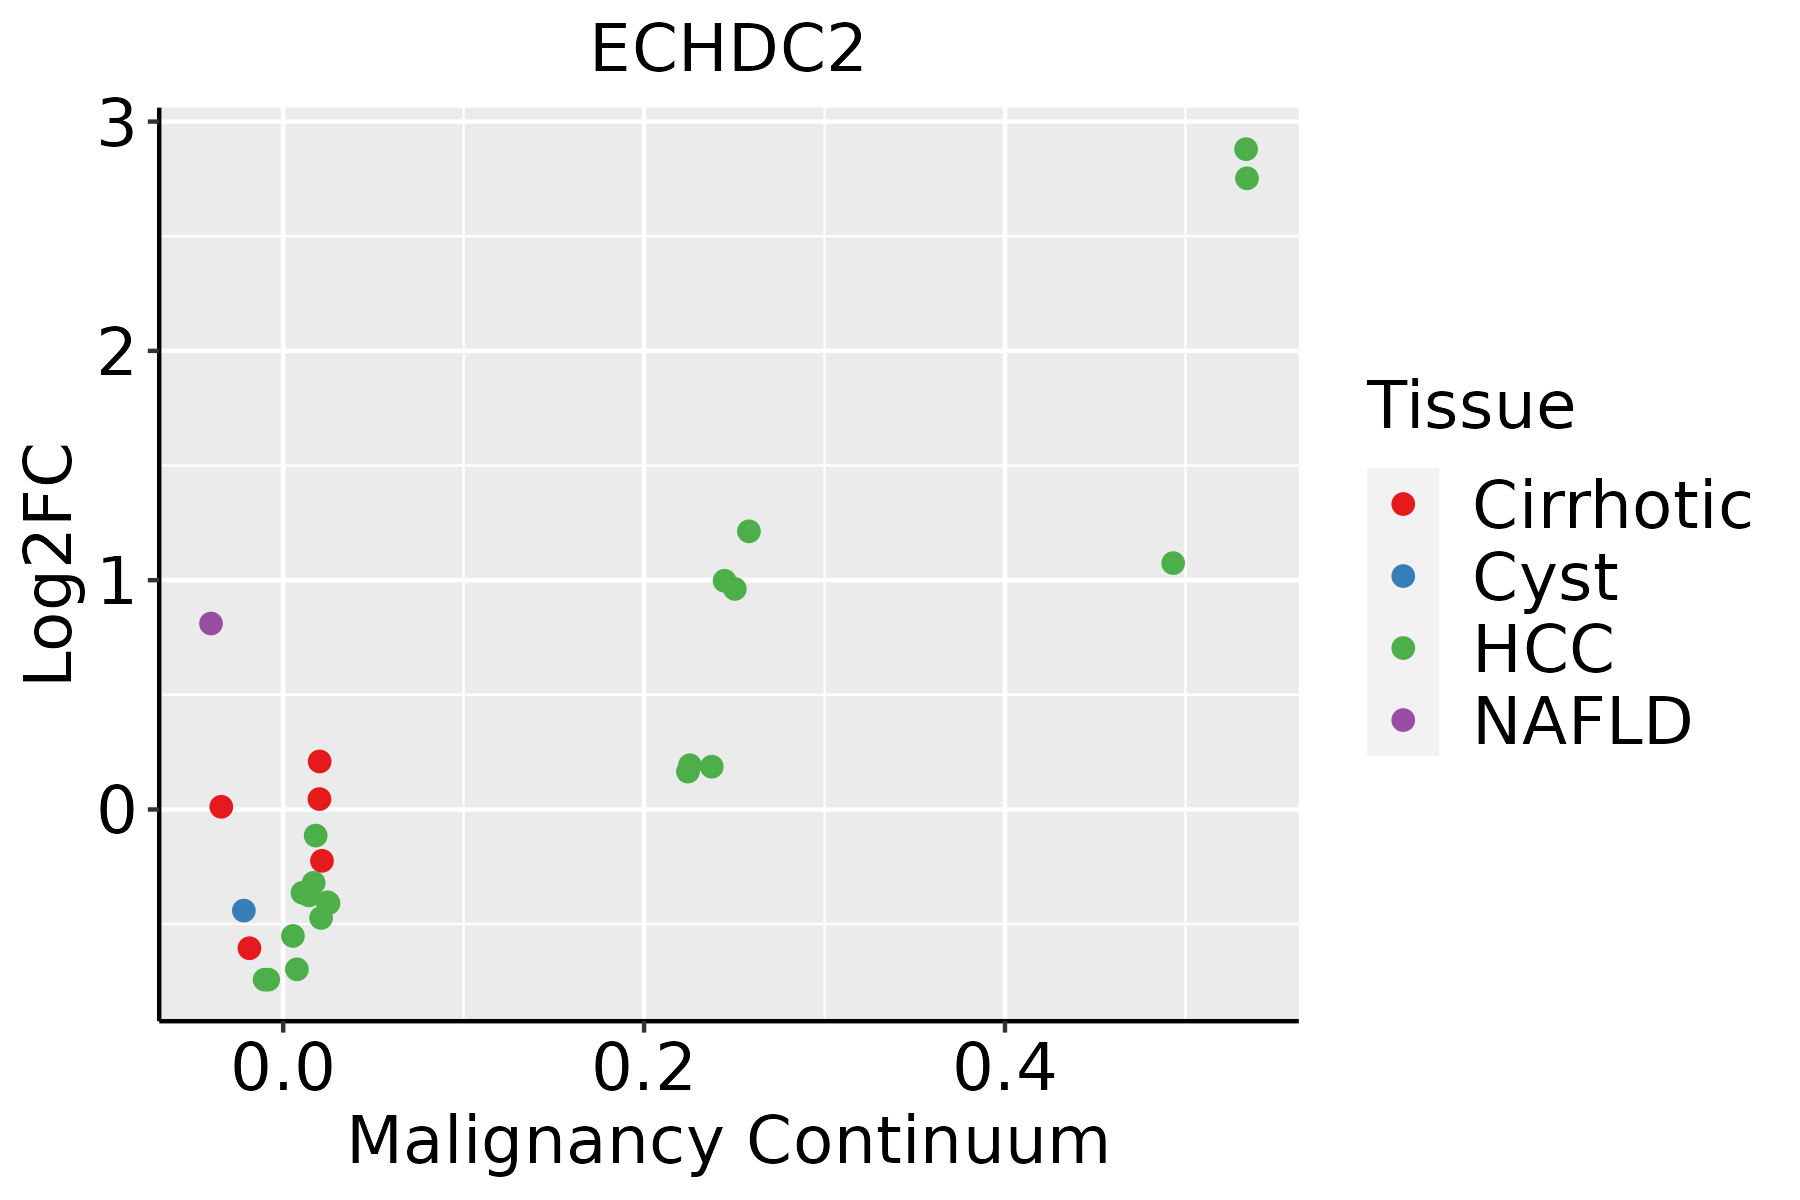 | HCC: Hepatocellular carcinoma |
| NAFLD: Non-alcoholic fatty liver disease | ||
| Lung |  | AAH: Atypical adenomatous hyperplasia |
| AIS: Adenocarcinoma in situ | ||
| IAC: Invasive lung adenocarcinoma | ||
| MIA: Minimally invasive adenocarcinoma | ||
| Oral Cavity | 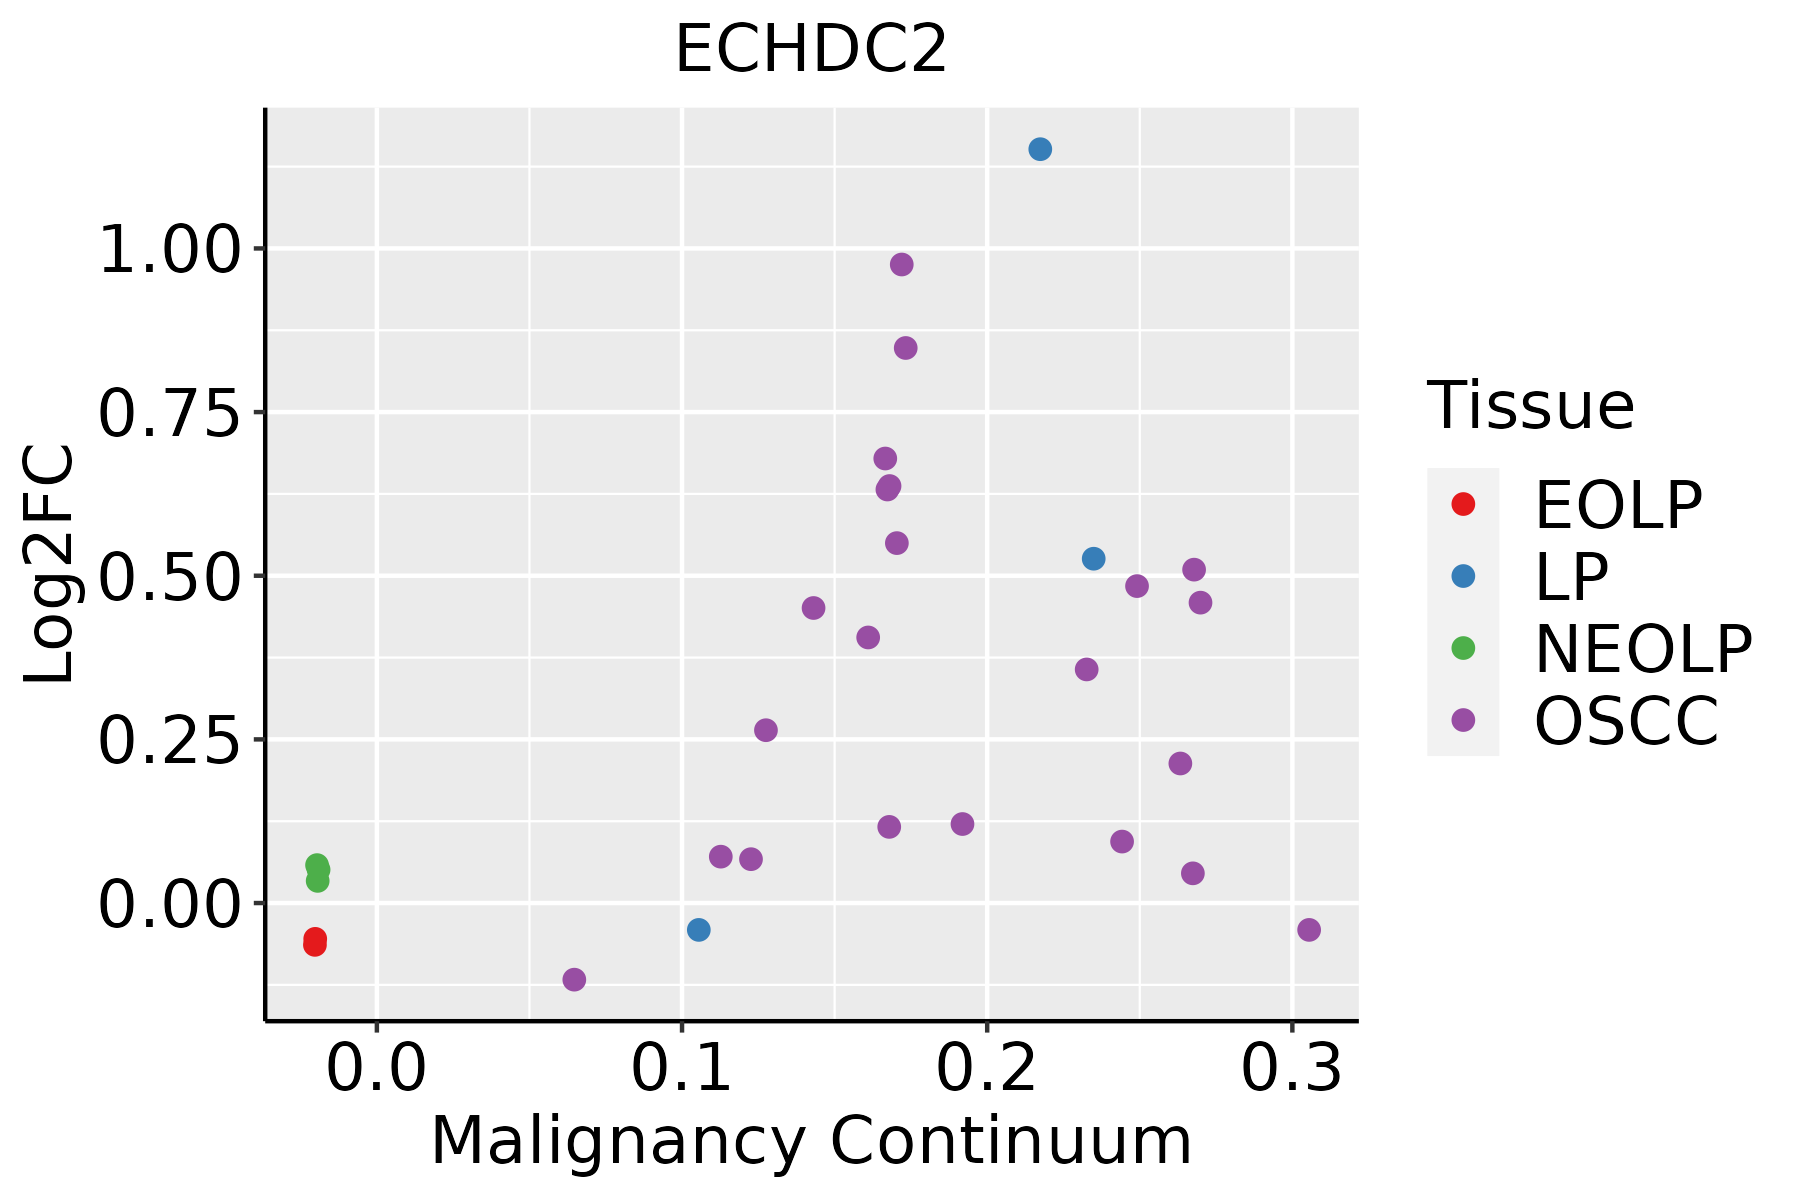 | EOLP: Erosive Oral lichen planus |
| LP: leukoplakia | ||
| NEOLP: Non-erosive oral lichen planus | ||
| OSCC: Oral squamous cell carcinoma | ||
| Prostate | 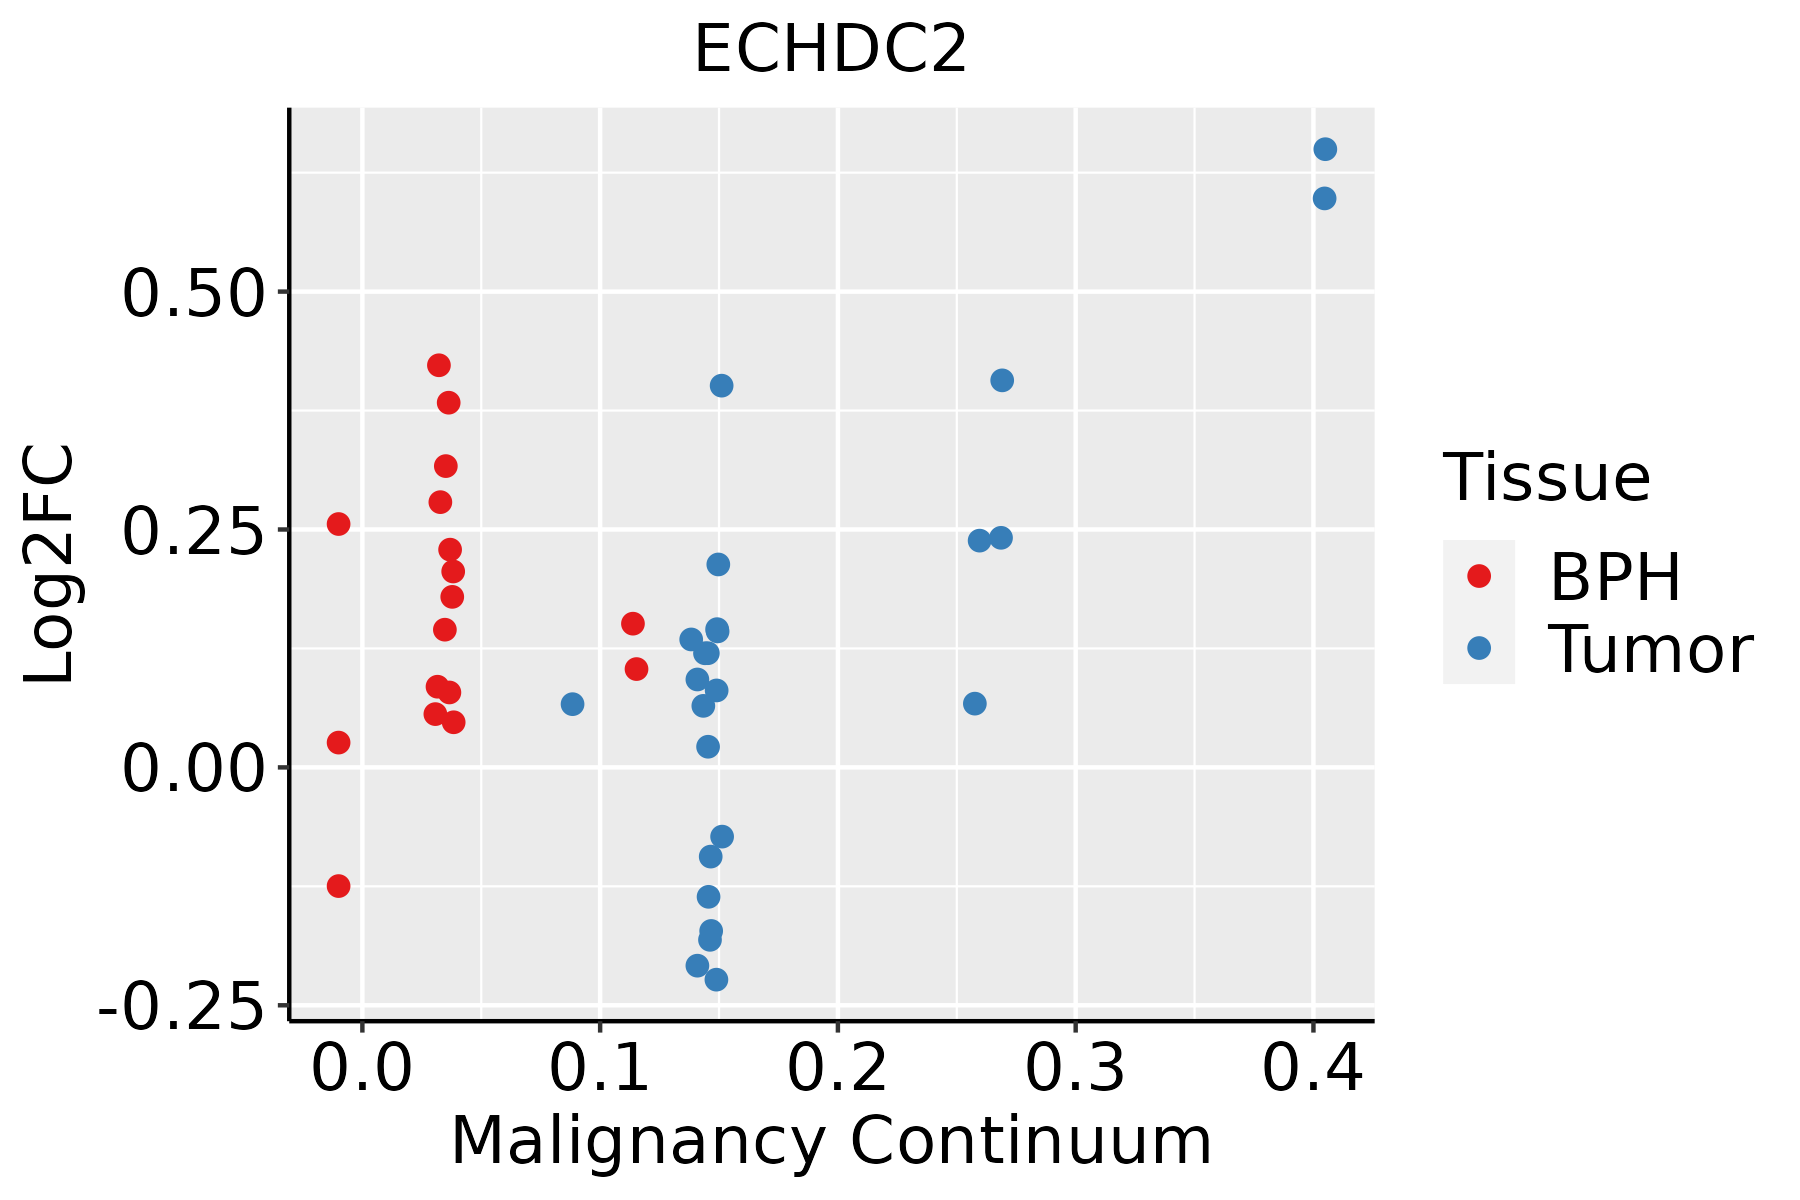 | BPH: Benign Prostatic Hyperplasia |
| Skin | 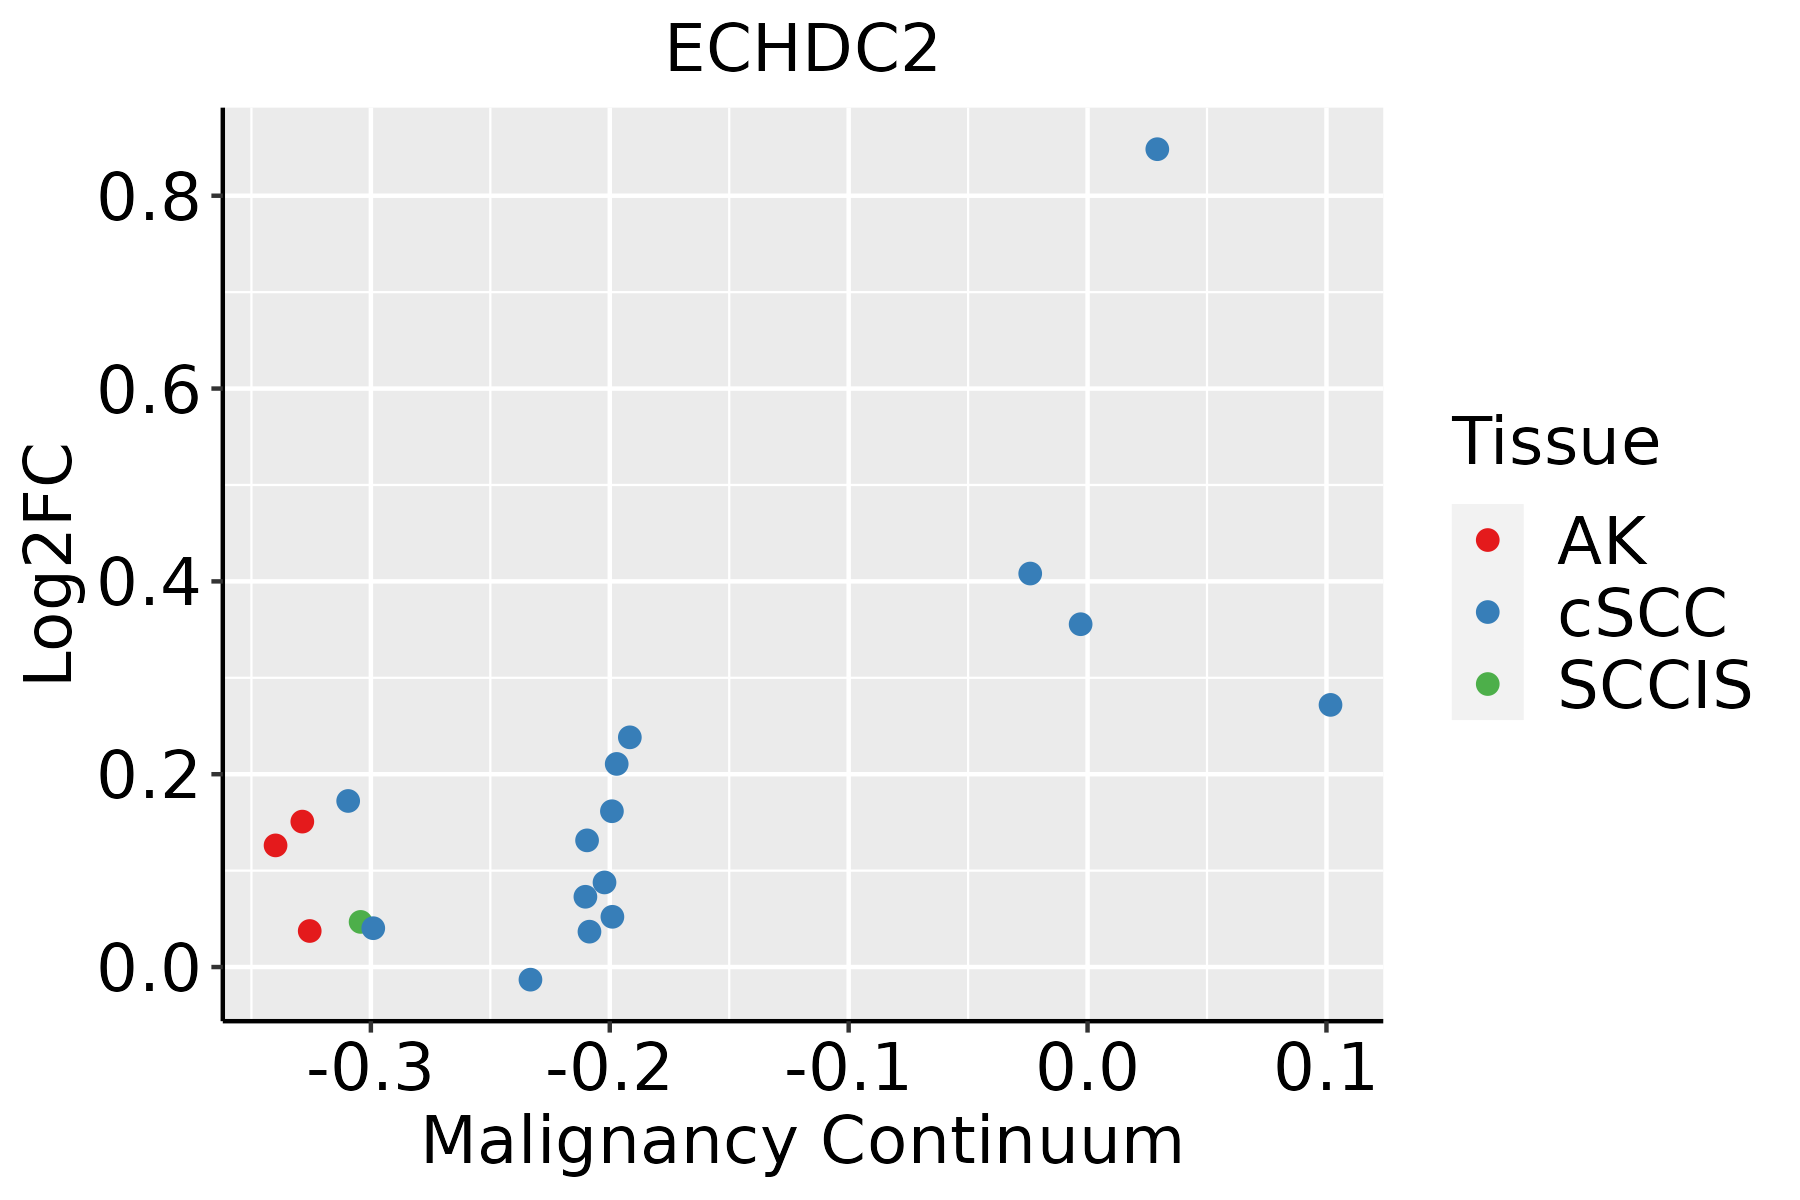 | AK: Actinic keratosis |
| cSCC: Cutaneous squamous cell carcinoma | ||
| SCCIS:squamous cell carcinoma in situ | ||
| Thyroid |  | ATC: Anaplastic thyroid cancer |
| HT: Hashimoto's thyroiditis | ||
| PTC: Papillary thyroid cancer |
| ∗log2FC in expression of this searched gene in stem-like cells from each diseased tissue sample relative to stem-like cells in normal samples in each tissue plotted against the malignancy continuum. Samples are colored based on if they are from different disease stage. |
Top |
Malignant transformation related pathway analysis |
| Find out the enriched GO biological processes and KEGG pathways involved in transition from healthy to precancer to cancer |
| Tissue | Disease Stage | Enriched GO biological Processes |
| Colorectum | AD |  |
| Colorectum | SER |  |
| Colorectum | MSS |  |
| Colorectum | MSI-H |  |
| Colorectum | FAP |  |
| ∗Top 15 enriched GO BP terms are showed in the bar plot of each disease state in each tissue. Each row represents a significant GO biological process which is colored according to the -log10(p.adjust). |
| Page: 1 2 3 4 5 6 7 8 9 |
| GO ID | Tissue | Disease Stage | Description | Gene Ratio | Bg Ratio | pvalue | p.adjust | Count |
| GO:0044282 | Colorectum | AD | small molecule catabolic process | 118/3918 | 376/18723 | 1.05e-06 | 3.55e-05 | 118 |
| GO:0006635 | Colorectum | AD | fatty acid beta-oxidation | 33/3918 | 74/18723 | 3.98e-06 | 1.09e-04 | 33 |
| GO:0009062 | Colorectum | AD | fatty acid catabolic process | 41/3918 | 100/18723 | 4.02e-06 | 1.09e-04 | 41 |
| GO:0019395 | Colorectum | AD | fatty acid oxidation | 40/3918 | 103/18723 | 2.43e-05 | 4.69e-04 | 40 |
| GO:0016042 | Colorectum | AD | lipid catabolic process | 97/3918 | 320/18723 | 4.31e-05 | 7.56e-04 | 97 |
| GO:0006631 | Colorectum | AD | fatty acid metabolic process | 114/3918 | 390/18723 | 5.58e-05 | 9.44e-04 | 114 |
| GO:0072329 | Colorectum | AD | monocarboxylic acid catabolic process | 44/3918 | 122/18723 | 8.05e-05 | 1.28e-03 | 44 |
| GO:0034440 | Colorectum | AD | lipid oxidation | 40/3918 | 108/18723 | 8.52e-05 | 1.32e-03 | 40 |
| GO:0030258 | Colorectum | AD | lipid modification | 67/3918 | 212/18723 | 1.66e-04 | 2.27e-03 | 67 |
| GO:0016054 | Colorectum | AD | organic acid catabolic process | 73/3918 | 240/18723 | 3.20e-04 | 3.81e-03 | 73 |
| GO:0044242 | Colorectum | AD | cellular lipid catabolic process | 66/3918 | 214/18723 | 3.96e-04 | 4.50e-03 | 66 |
| GO:0046395 | Colorectum | AD | carboxylic acid catabolic process | 70/3918 | 236/18723 | 9.06e-04 | 8.71e-03 | 70 |
| GO:00160421 | Colorectum | SER | lipid catabolic process | 77/2897 | 320/18723 | 3.52e-05 | 9.18e-04 | 77 |
| GO:00442821 | Colorectum | SER | small molecule catabolic process | 87/2897 | 376/18723 | 5.31e-05 | 1.27e-03 | 87 |
| GO:00090621 | Colorectum | SER | fatty acid catabolic process | 31/2897 | 100/18723 | 7.09e-05 | 1.61e-03 | 31 |
| GO:00066351 | Colorectum | SER | fatty acid beta-oxidation | 24/2897 | 74/18723 | 2.09e-04 | 3.77e-03 | 24 |
| GO:00723291 | Colorectum | SER | monocarboxylic acid catabolic process | 34/2897 | 122/18723 | 3.27e-04 | 5.22e-03 | 34 |
| GO:00193951 | Colorectum | SER | fatty acid oxidation | 29/2897 | 103/18723 | 7.24e-04 | 9.44e-03 | 29 |
| GO:00442421 | Colorectum | SER | cellular lipid catabolic process | 51/2897 | 214/18723 | 8.60e-04 | 1.05e-02 | 51 |
| GO:00344401 | Colorectum | SER | lipid oxidation | 29/2897 | 108/18723 | 1.63e-03 | 1.72e-02 | 29 |
| Page: 1 2 3 4 5 6 |
| Pathway ID | Tissue | Disease Stage | Description | Gene Ratio | Bg Ratio | pvalue | p.adjust | qvalue | Count |
| Page: 1 |
Top |
Cell-cell communication analysis |
| Identification of potential cell-cell interactions between two cell types and their ligand-receptor pairs for different disease states |
| Ligand | Receptor | LRpair | Pathway | Tissue | Disease Stage |
| Page: 1 |
Top |
Single-cell gene regulatory network inference analysis |
| Find out the significant the regulons (TFs) and the target genes of each regulon across cell types for different disease states |
| TF | Cell Type | Tissue | Disease Stage | Target Gene | RSS | Regulon Activity |
| ∗The dot plots of a searched regulon are shown for all cell subpopulations in each disease state of each tissue based on the regulon specific score inferred using pySCENIC and by calculating the average expression. |
| Page: 1 |
Top |
Somatic mutation of malignant transformation related genes |
| Annotation of somatic variants for genes involved in malignant transformation |
| Hugo Symbol | Variant Class | Variant Classification | dbSNP RS | HGVSc | HGVSp | HGVSp Short | SWISSPROT | BIOTYPE | SIFT | PolyPhen | Tumor Sample Barcode | Tissue | Histology | Sex | Age | Stage | Therapy Types | Drugs | Outcome |
| ECHDC2 | SNV | Missense_Mutation | rs536501241 | c.815N>A | p.Arg272Gln | p.R272Q | Q86YB7 | protein_coding | tolerated(0.21) | benign(0.036) | TCGA-EW-A1IZ-01 | Breast | breast invasive carcinoma | Female | <65 | III/IV | Chemotherapy | taxotere | SD |
| ECHDC2 | SNV | Missense_Mutation | rs375624978 | c.464C>T | p.Ser155Leu | p.S155L | Q86YB7 | protein_coding | deleterious(0.01) | possibly_damaging(0.505) | TCGA-C5-A8YR-01 | Cervix | cervical & endocervical cancer | Female | <65 | I/II | Unknown | Unknown | PD |
| ECHDC2 | SNV | Missense_Mutation | c.354N>A | p.Met118Ile | p.M118I | Q86YB7 | protein_coding | tolerated(0.51) | benign(0.383) | TCGA-EK-A2RN-01 | Cervix | cervical & endocervical cancer | Female | <65 | I/II | Unknown | Unknown | SD | |
| ECHDC2 | SNV | Missense_Mutation | novel | c.718N>T | p.Arg240Trp | p.R240W | Q86YB7 | protein_coding | deleterious(0) | probably_damaging(0.997) | TCGA-VS-A94Z-01 | Cervix | cervical & endocervical cancer | Female | <65 | I/II | Chemotherapy | cisplatin | CR |
| ECHDC2 | SNV | Missense_Mutation | c.43N>G | p.Arg15Gly | p.R15G | Q86YB7 | protein_coding | tolerated(0.52) | benign(0) | TCGA-VS-A9UD-01 | Cervix | cervical & endocervical cancer | Female | >=65 | III/IV | Chemotherapy | cisplatin | CR | |
| ECHDC2 | SNV | Missense_Mutation | c.43N>T | p.Arg15Trp | p.R15W | Q86YB7 | protein_coding | tolerated(0.13) | benign(0) | TCGA-VS-A9V1-01 | Cervix | cervical & endocervical cancer | Female | <65 | I/II | Chemotherapy | cisplatin | PD | |
| ECHDC2 | SNV | Missense_Mutation | rs781602712 | c.232N>T | p.Arg78Cys | p.R78C | Q86YB7 | protein_coding | deleterious(0) | probably_damaging(0.95) | TCGA-A6-3809-01 | Colorectum | colon adenocarcinoma | Female | >=65 | I/II | Unknown | Unknown | SD |
| ECHDC2 | SNV | Missense_Mutation | rs764403275 | c.415G>A | p.Gly139Arg | p.G139R | Q86YB7 | protein_coding | deleterious(0) | probably_damaging(0.999) | TCGA-A6-6781-01 | Colorectum | colon adenocarcinoma | Male | <65 | III/IV | Chemotherapy | oxaliplatin | SD |
| ECHDC2 | SNV | Missense_Mutation | rs768996501 | c.158N>A | p.Arg53His | p.R53H | Q86YB7 | protein_coding | deleterious(0) | probably_damaging(0.961) | TCGA-AA-3672-01 | Colorectum | colon adenocarcinoma | Female | >=65 | III/IV | Unknown | Unknown | SD |
| ECHDC2 | SNV | Missense_Mutation | c.677C>T | p.Ala226Val | p.A226V | Q86YB7 | protein_coding | deleterious(0.03) | benign(0.243) | TCGA-AA-A022-01 | Colorectum | colon adenocarcinoma | Female | >=65 | I/II | Unknown | Unknown | SD |
| Page: 1 2 3 |
Top |
Related drugs of malignant transformation related genes |
| Identification of chemicals and drugs interact with genes involved in malignant transfromation |
| (DGIdb 4.0) |
| Entrez ID | Symbol | Category | Interaction Types | Drug Claim Name | Drug Name | PMIDs |
| Page: 1 |

Copyright 2023-Present -The University of Texas Health Science Center at Houston |