
|
|||||
|
 | |
| |
| |
| |
| |
| |
|
Gene: ECE2 |
Gene summary for ECE2 |
| Gene information | Species | Human | Gene symbol | ECE2 | Gene ID | 9718 |
| Gene name | endothelin converting enzyme 2 | |
| Gene Alias | EEF1AKMT4 | |
| Cytomap | 3q27.1 | |
| Gene Type | protein-coding | GO ID | GO:0006508 | UniProtAcc | NA |
Top |
Malignant transformation analysis |
| Identification of the aberrant gene expression in precancerous and cancerous lesions by comparing the gene expression of stem-like cells in diseased tissues with normal stem cells |
| Entrez ID | Symbol | Replicates | Species | Organ | Tissue | Adj P-value | Log2FC | Malignancy |
| 9718 | ECE2 | P2T-E | Human | Esophagus | ESCC | 3.20e-42 | 9.14e-01 | 0.1177 |
| 9718 | ECE2 | P4T-E | Human | Esophagus | ESCC | 6.28e-43 | 1.15e+00 | 0.1323 |
| 9718 | ECE2 | P5T-E | Human | Esophagus | ESCC | 1.69e-16 | 3.54e-01 | 0.1327 |
| 9718 | ECE2 | P8T-E | Human | Esophagus | ESCC | 4.81e-13 | 3.29e-01 | 0.0889 |
| 9718 | ECE2 | P9T-E | Human | Esophagus | ESCC | 2.07e-25 | 7.99e-01 | 0.1131 |
| 9718 | ECE2 | P10T-E | Human | Esophagus | ESCC | 3.86e-24 | 5.29e-01 | 0.116 |
| 9718 | ECE2 | P11T-E | Human | Esophagus | ESCC | 1.38e-16 | 1.15e+00 | 0.1426 |
| 9718 | ECE2 | P12T-E | Human | Esophagus | ESCC | 6.37e-21 | 3.90e-01 | 0.1122 |
| 9718 | ECE2 | P15T-E | Human | Esophagus | ESCC | 7.53e-27 | 7.18e-01 | 0.1149 |
| 9718 | ECE2 | P16T-E | Human | Esophagus | ESCC | 2.71e-27 | 5.72e-01 | 0.1153 |
| 9718 | ECE2 | P17T-E | Human | Esophagus | ESCC | 6.77e-06 | 3.33e-01 | 0.1278 |
| 9718 | ECE2 | P19T-E | Human | Esophagus | ESCC | 1.25e-03 | 7.45e-01 | 0.1662 |
| 9718 | ECE2 | P20T-E | Human | Esophagus | ESCC | 1.84e-16 | 4.50e-01 | 0.1124 |
| 9718 | ECE2 | P21T-E | Human | Esophagus | ESCC | 4.73e-40 | 8.31e-01 | 0.1617 |
| 9718 | ECE2 | P22T-E | Human | Esophagus | ESCC | 2.66e-33 | 6.92e-01 | 0.1236 |
| 9718 | ECE2 | P23T-E | Human | Esophagus | ESCC | 8.03e-54 | 1.40e+00 | 0.108 |
| 9718 | ECE2 | P24T-E | Human | Esophagus | ESCC | 1.37e-19 | 5.88e-01 | 0.1287 |
| 9718 | ECE2 | P26T-E | Human | Esophagus | ESCC | 7.14e-40 | 8.33e-01 | 0.1276 |
| 9718 | ECE2 | P27T-E | Human | Esophagus | ESCC | 6.72e-18 | 3.62e-01 | 0.1055 |
| 9718 | ECE2 | P28T-E | Human | Esophagus | ESCC | 4.20e-41 | 8.72e-01 | 0.1149 |
| Page: 1 2 3 4 |
| Tissue | Expression Dynamics | Abbreviation |
| Esophagus | 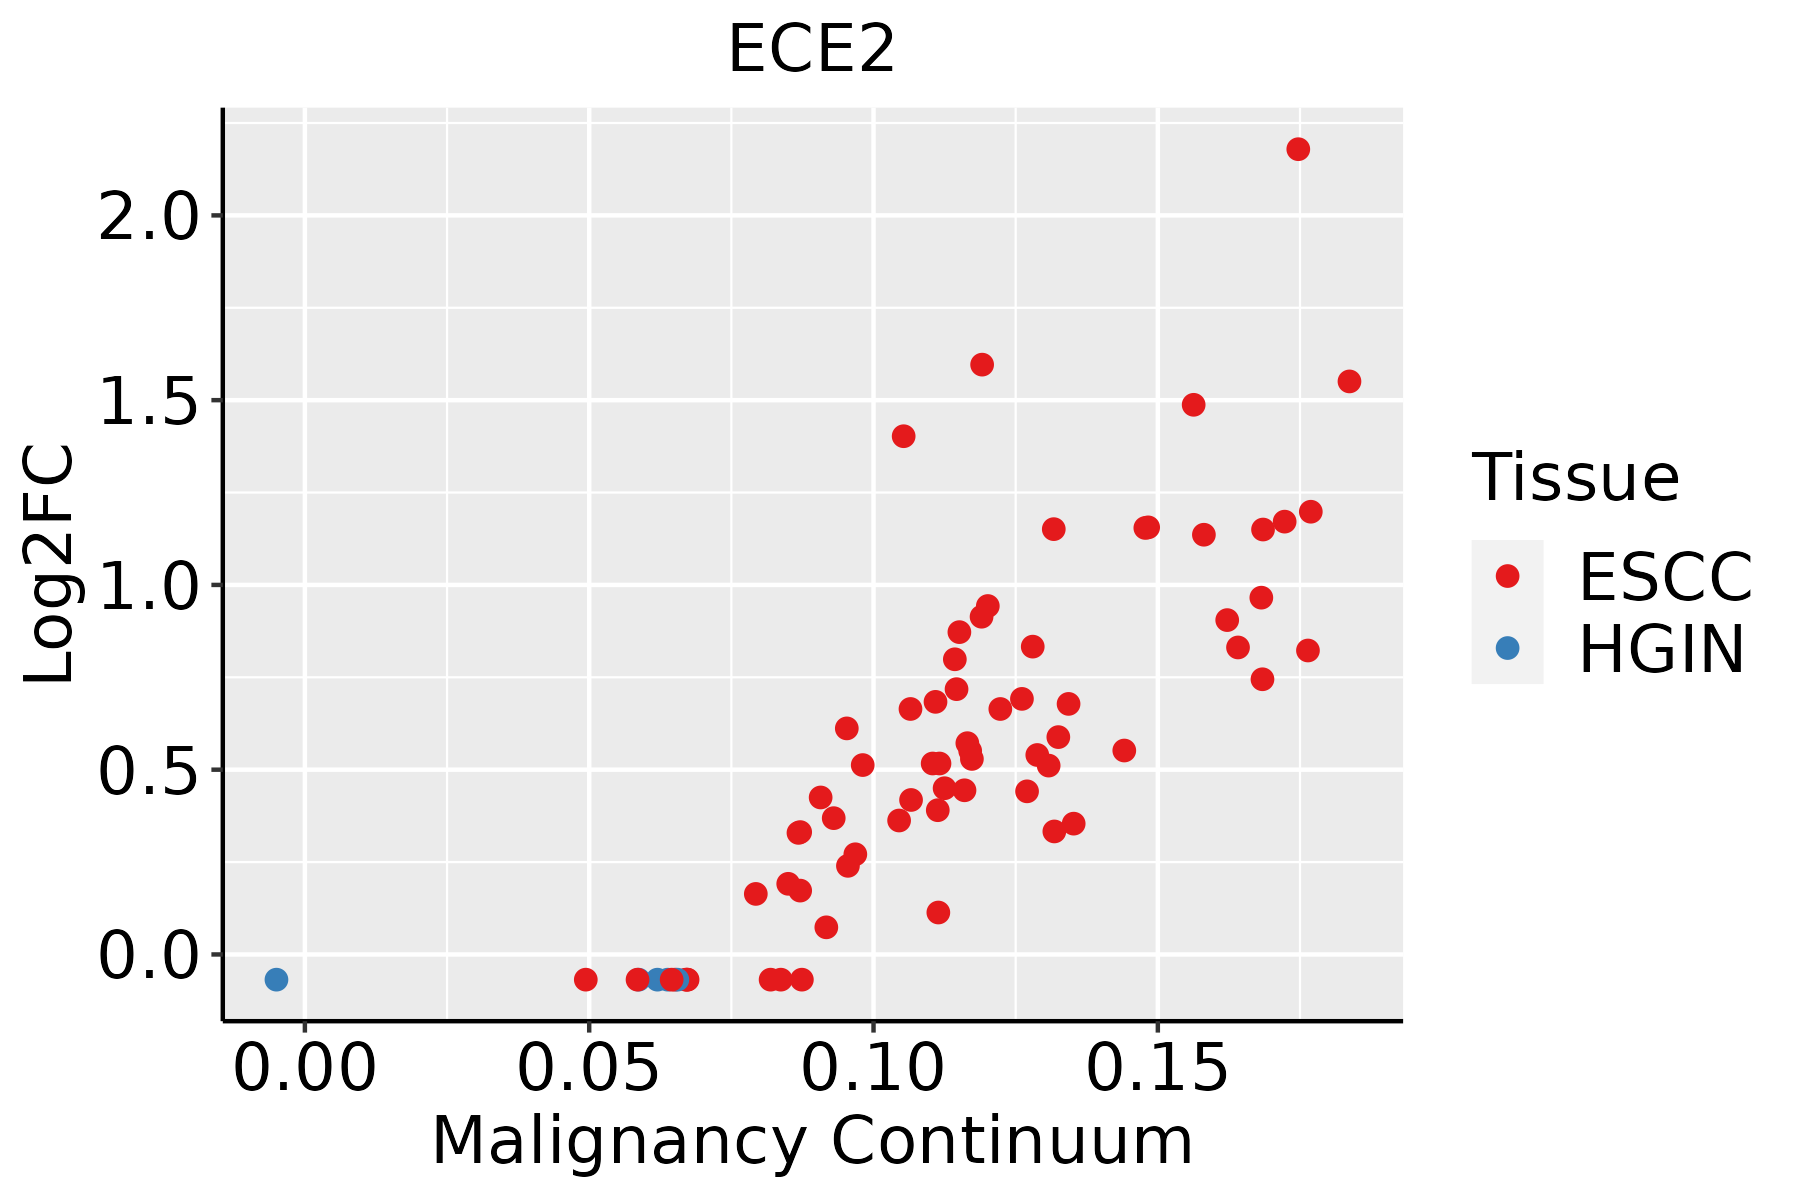 | ESCC: Esophageal squamous cell carcinoma |
| HGIN: High-grade intraepithelial neoplasias | ||
| LGIN: Low-grade intraepithelial neoplasias | ||
| Oral Cavity |  | EOLP: Erosive Oral lichen planus |
| LP: leukoplakia | ||
| NEOLP: Non-erosive oral lichen planus | ||
| OSCC: Oral squamous cell carcinoma | ||
| Skin |  | AK: Actinic keratosis |
| cSCC: Cutaneous squamous cell carcinoma | ||
| SCCIS:squamous cell carcinoma in situ |
| ∗log2FC in expression of this searched gene in stem-like cells from each diseased tissue sample relative to stem-like cells in normal samples in each tissue plotted against the malignancy continuum. Samples are colored based on if they are from different disease stage. |
Top |
Malignant transformation related pathway analysis |
| Find out the enriched GO biological processes and KEGG pathways involved in transition from healthy to precancer to cancer |
| Tissue | Disease Stage | Enriched GO biological Processes |
| Colorectum | AD |  |
| Colorectum | SER |  |
| Colorectum | MSS |  |
| Colorectum | MSI-H |  |
| Colorectum | FAP |  |
| ∗Top 15 enriched GO BP terms are showed in the bar plot of each disease state in each tissue. Each row represents a significant GO biological process which is colored according to the -log10(p.adjust). |
| Page: 1 2 3 4 5 6 7 8 9 |
| GO ID | Tissue | Disease Stage | Description | Gene Ratio | Bg Ratio | pvalue | p.adjust | Count |
| GO:005160418 | Esophagus | ESCC | protein maturation | 189/8552 | 294/18723 | 7.64e-11 | 2.39e-09 | 189 |
| GO:00322592 | Esophagus | ESCC | methylation | 222/8552 | 364/18723 | 2.26e-09 | 5.09e-08 | 222 |
| GO:001648514 | Esophagus | ESCC | protein processing | 134/8552 | 225/18723 | 1.81e-05 | 1.60e-04 | 134 |
| GO:005160410 | Oral cavity | OSCC | protein maturation | 170/7305 | 294/18723 | 3.97e-11 | 1.28e-09 | 170 |
| GO:00164856 | Oral cavity | OSCC | protein processing | 121/7305 | 225/18723 | 4.56e-06 | 5.23e-05 | 121 |
| GO:00322591 | Oral cavity | OSCC | methylation | 168/7305 | 364/18723 | 3.03e-03 | 1.31e-02 | 168 |
| GO:005160416 | Oral cavity | LP | protein maturation | 122/4623 | 294/18723 | 1.37e-10 | 7.72e-09 | 122 |
| GO:001648513 | Oral cavity | LP | protein processing | 83/4623 | 225/18723 | 2.87e-05 | 4.52e-04 | 83 |
| GO:005160419 | Skin | cSCC | protein maturation | 117/4864 | 294/18723 | 1.27e-07 | 2.93e-06 | 117 |
| GO:00164858 | Skin | cSCC | protein processing | 79/4864 | 225/18723 | 1.43e-03 | 9.02e-03 | 79 |
| GO:00322593 | Skin | cSCC | methylation | 120/4864 | 364/18723 | 1.61e-03 | 9.93e-03 | 120 |
| Page: 1 |
| Pathway ID | Tissue | Disease Stage | Description | Gene Ratio | Bg Ratio | pvalue | p.adjust | qvalue | Count |
| Page: 1 |
Top |
Cell-cell communication analysis |
| Identification of potential cell-cell interactions between two cell types and their ligand-receptor pairs for different disease states |
| Ligand | Receptor | LRpair | Pathway | Tissue | Disease Stage |
| Page: 1 |
Top |
Single-cell gene regulatory network inference analysis |
| Find out the significant the regulons (TFs) and the target genes of each regulon across cell types for different disease states |
| TF | Cell Type | Tissue | Disease Stage | Target Gene | RSS | Regulon Activity |
| ∗The dot plots of a searched regulon are shown for all cell subpopulations in each disease state of each tissue based on the regulon specific score inferred using pySCENIC and by calculating the average expression. |
| Page: 1 |
Top |
Somatic mutation of malignant transformation related genes |
| Annotation of somatic variants for genes involved in malignant transformation |
| Hugo Symbol | Variant Class | Variant Classification | dbSNP RS | HGVSc | HGVSp | HGVSp Short | SWISSPROT | BIOTYPE | SIFT | PolyPhen | Tumor Sample Barcode | Tissue | Histology | Sex | Age | Stage | Therapy Types | Drugs | Outcome |
| ECE2 | SNV | Missense_Mutation | rs755011871 | c.524N>T | p.Thr175Met | p.T175M | O60344 | protein_coding | deleterious(0) | probably_damaging(0.939) | TCGA-A7-A0DA-01 | Breast | breast invasive carcinoma | Female | <65 | I/II | Chemotherapy | adriamycin | SD |
| ECE2 | SNV | Missense_Mutation | c.773G>A | p.Arg258His | p.R258H | O60344 | protein_coding | deleterious(0.04) | benign(0.065) | TCGA-A8-A07W-01 | Breast | breast invasive carcinoma | Female | >=65 | III/IV | Hormone Therapy | exemestane | SD | |
| ECE2 | SNV | Missense_Mutation | c.1572N>T | p.Glu524Asp | p.E524D | O60344 | protein_coding | deleterious(0.05) | possibly_damaging(0.867) | TCGA-A8-A08L-01 | Breast | breast invasive carcinoma | Female | >=65 | III/IV | Unknown | Unknown | SD | |
| ECE2 | SNV | Missense_Mutation | c.373N>C | p.Asp125His | p.D125H | O60344 | protein_coding | deleterious_low_confidence(0) | probably_damaging(0.986) | TCGA-AC-A23H-01 | Breast | breast invasive carcinoma | Female | >=65 | I/II | Unknown | Unknown | PD | |
| ECE2 | SNV | Missense_Mutation | c.1921N>T | p.Asp641Tyr | p.D641Y | O60344 | protein_coding | deleterious(0.05) | possibly_damaging(0.825) | TCGA-BH-A18V-01 | Breast | breast invasive carcinoma | Female | <65 | I/II | Unknown | Unknown | SD | |
| ECE2 | SNV | Missense_Mutation | novel | c.146N>A | p.Arg49His | p.R49H | O60344 | protein_coding | deleterious_low_confidence(0) | probably_damaging(0.992) | TCGA-E2-A155-01 | Breast | breast invasive carcinoma | Female | <65 | I/II | Chemotherapy | cytoxan | SD |
| ECE2 | SNV | Missense_Mutation | c.1723N>C | p.Glu575Gln | p.E575Q | O60344 | protein_coding | tolerated(0.16) | benign(0.038) | TCGA-E2-A159-01 | Breast | breast invasive carcinoma | Female | <65 | I/II | Chemotherapy | cyclophosphamide | SD | |
| ECE2 | SNV | Missense_Mutation | novel | c.2617N>A | p.Pro873Thr | p.P873T | O60344 | protein_coding | tolerated(0.06) | possibly_damaging(0.696) | TCGA-GI-A2C9-01 | Breast | breast invasive carcinoma | Female | <65 | I/II | Unspecific | SD | |
| ECE2 | insertion | Frame_Shift_Ins | novel | c.391_392insAGTATTATCCCCATTTTGAATTTGAGGAAACTGAGGCTCAAAGAGTT | p.Gly131GlufsTer44 | p.G131Efs*44 | O60344 | protein_coding | TCGA-A7-A0CJ-01 | Breast | breast invasive carcinoma | Female | <65 | I/II | Chemotherapy | cytoxan | SD | ||
| ECE2 | SNV | Missense_Mutation | c.1135N>T | p.Arg379Trp | p.R379W | O60344 | protein_coding | deleterious(0) | probably_damaging(0.999) | TCGA-C5-A1MH-01 | Cervix | cervical & endocervical cancer | Female | >=65 | III/IV | Chemotherapy | cisplatin | PD |
| Page: 1 2 3 4 5 6 7 8 9 10 11 12 13 |
Top |
Related drugs of malignant transformation related genes |
| Identification of chemicals and drugs interact with genes involved in malignant transfromation |
| (DGIdb 4.0) |
| Entrez ID | Symbol | Category | Interaction Types | Drug Claim Name | Drug Name | PMIDs |
| 9718 | ECE2 | ENZYME, PROTEASE, DRUGGABLE GENOME | inhibitor | 252166873 | ||
| 9718 | ECE2 | ENZYME, PROTEASE, DRUGGABLE GENOME | inhibitor | 252166821 |
| Page: 1 |

Copyright 2023-Present -The University of Texas Health Science Center at Houston |