
|
|||||
|
 | |
| |
| |
| |
| |
| |
|
Gene: ECE1 |
Gene summary for ECE1 |
| Gene information | Species | Human | Gene symbol | ECE1 | Gene ID | 1889 |
| Gene name | endothelin converting enzyme 1 | |
| Gene Alias | ECE | |
| Cytomap | 1p36.12 | |
| Gene Type | protein-coding | GO ID | GO:0001881 | UniProtAcc | A0A024RAB0 |
Top |
Malignant transformation analysis |
| Identification of the aberrant gene expression in precancerous and cancerous lesions by comparing the gene expression of stem-like cells in diseased tissues with normal stem cells |
| Entrez ID | Symbol | Replicates | Species | Organ | Tissue | Adj P-value | Log2FC | Malignancy |
| 1889 | ECE1 | CCI_2 | Human | Cervix | CC | 3.53e-03 | 6.37e-01 | 0.5249 |
| 1889 | ECE1 | CCI_3 | Human | Cervix | CC | 1.90e-05 | 6.20e-01 | 0.516 |
| 1889 | ECE1 | sample3 | Human | Cervix | CC | 7.75e-03 | 1.51e-01 | 0.1387 |
| 1889 | ECE1 | HTA11_2487_2000001011 | Human | Colorectum | SER | 4.25e-02 | 4.47e-01 | -0.1808 |
| 1889 | ECE1 | HTA11_347_2000001011 | Human | Colorectum | AD | 1.71e-11 | 5.63e-01 | -0.1954 |
| 1889 | ECE1 | HTA11_2112_2000001011 | Human | Colorectum | SER | 3.47e-03 | 7.57e-01 | -0.2196 |
| 1889 | ECE1 | HTA11_696_2000001011 | Human | Colorectum | AD | 4.81e-06 | 5.18e-01 | -0.1464 |
| 1889 | ECE1 | HTA11_866_2000001011 | Human | Colorectum | AD | 1.74e-03 | 3.02e-01 | -0.1001 |
| 1889 | ECE1 | HTA11_1391_2000001011 | Human | Colorectum | AD | 4.98e-05 | 4.23e-01 | -0.059 |
| 1889 | ECE1 | HTA11_2992_2000001011 | Human | Colorectum | SER | 4.63e-02 | 6.76e-01 | -0.1706 |
| 1889 | ECE1 | A002-C-010 | Human | Colorectum | FAP | 2.96e-05 | -2.68e-01 | 0.242 |
| 1889 | ECE1 | A015-C-203 | Human | Colorectum | FAP | 2.18e-11 | -3.07e-01 | -0.1294 |
| 1889 | ECE1 | A002-C-201 | Human | Colorectum | FAP | 9.47e-05 | -2.26e-01 | 0.0324 |
| 1889 | ECE1 | A002-C-203 | Human | Colorectum | FAP | 1.94e-02 | -2.42e-01 | 0.2786 |
| 1889 | ECE1 | A001-C-108 | Human | Colorectum | FAP | 4.31e-07 | -1.91e-01 | -0.0272 |
| 1889 | ECE1 | A002-C-205 | Human | Colorectum | FAP | 3.51e-10 | -3.11e-01 | -0.1236 |
| 1889 | ECE1 | A015-C-006 | Human | Colorectum | FAP | 8.43e-07 | -3.37e-01 | -0.0994 |
| 1889 | ECE1 | A015-C-106 | Human | Colorectum | FAP | 2.04e-04 | -1.88e-01 | -0.0511 |
| 1889 | ECE1 | A002-C-114 | Human | Colorectum | FAP | 7.92e-07 | -2.55e-01 | -0.1561 |
| 1889 | ECE1 | A015-C-104 | Human | Colorectum | FAP | 1.39e-13 | -2.54e-01 | -0.1899 |
| Page: 1 2 3 4 5 6 7 8 9 |
| Tissue | Expression Dynamics | Abbreviation |
| Cervix | 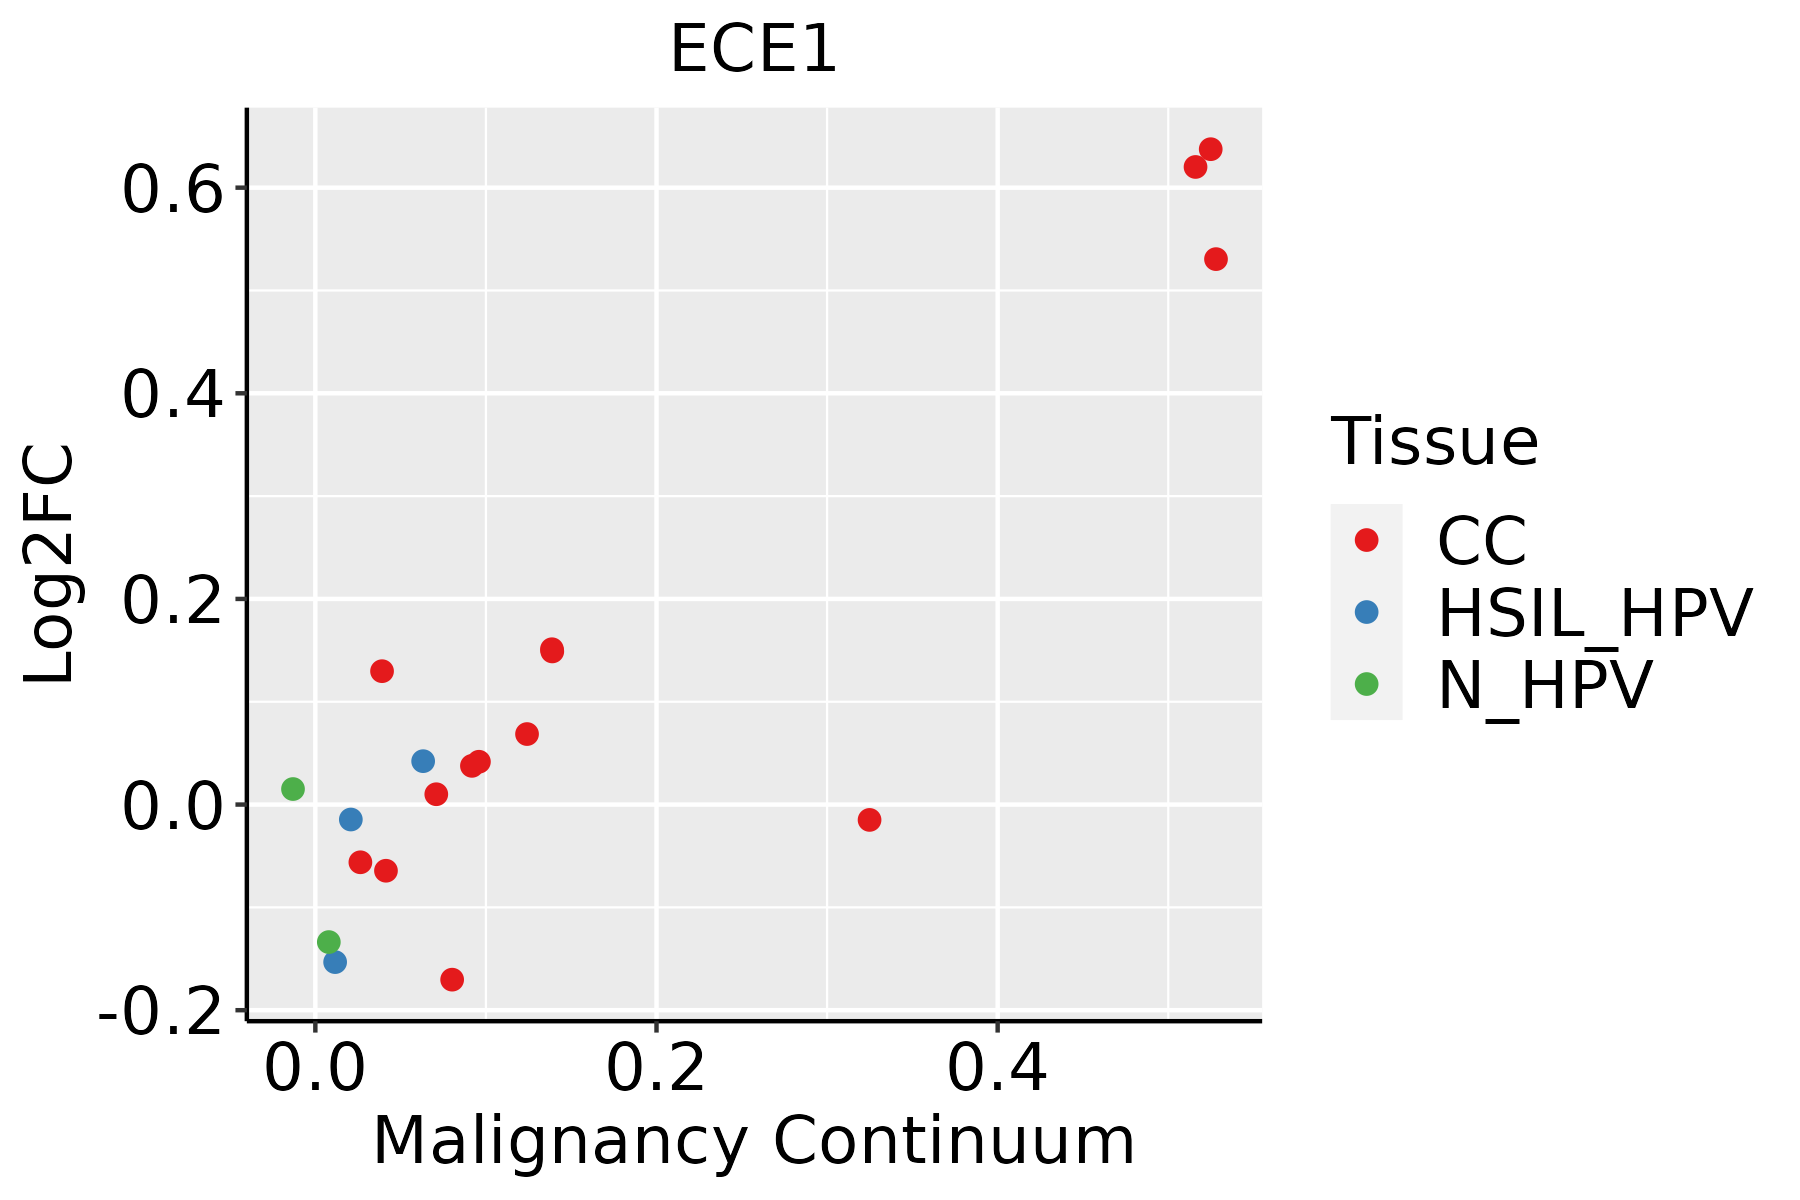 | CC: Cervix cancer |
| HSIL_HPV: HPV-infected high-grade squamous intraepithelial lesions | ||
| N_HPV: HPV-infected normal cervix | ||
| Colorectum (GSE201348) |  | FAP: Familial adenomatous polyposis |
| CRC: Colorectal cancer | ||
| Colorectum (HTA11) |  | AD: Adenomas |
| SER: Sessile serrated lesions | ||
| MSI-H: Microsatellite-high colorectal cancer | ||
| MSS: Microsatellite stable colorectal cancer | ||
| Esophagus |  | ESCC: Esophageal squamous cell carcinoma |
| HGIN: High-grade intraepithelial neoplasias | ||
| LGIN: Low-grade intraepithelial neoplasias | ||
| Liver | 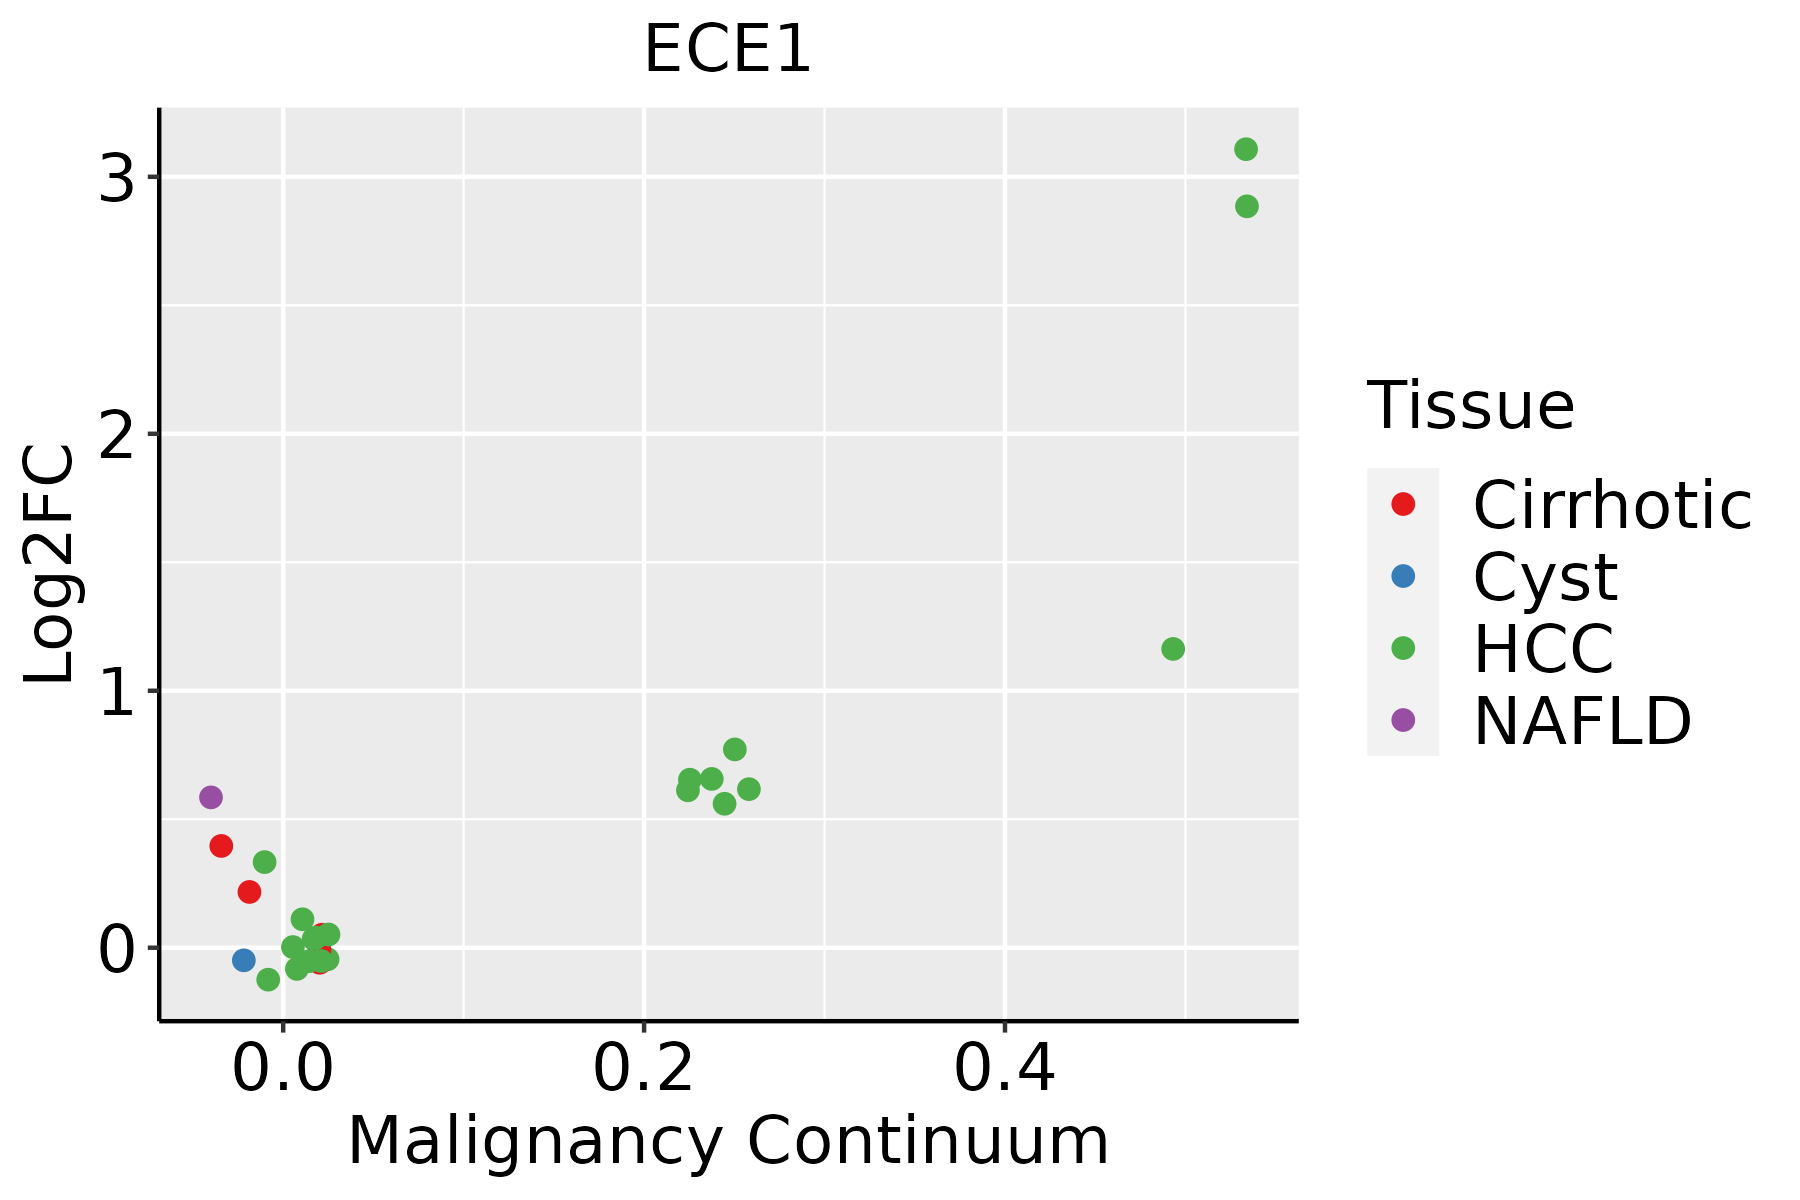 | HCC: Hepatocellular carcinoma |
| NAFLD: Non-alcoholic fatty liver disease | ||
| Lung | 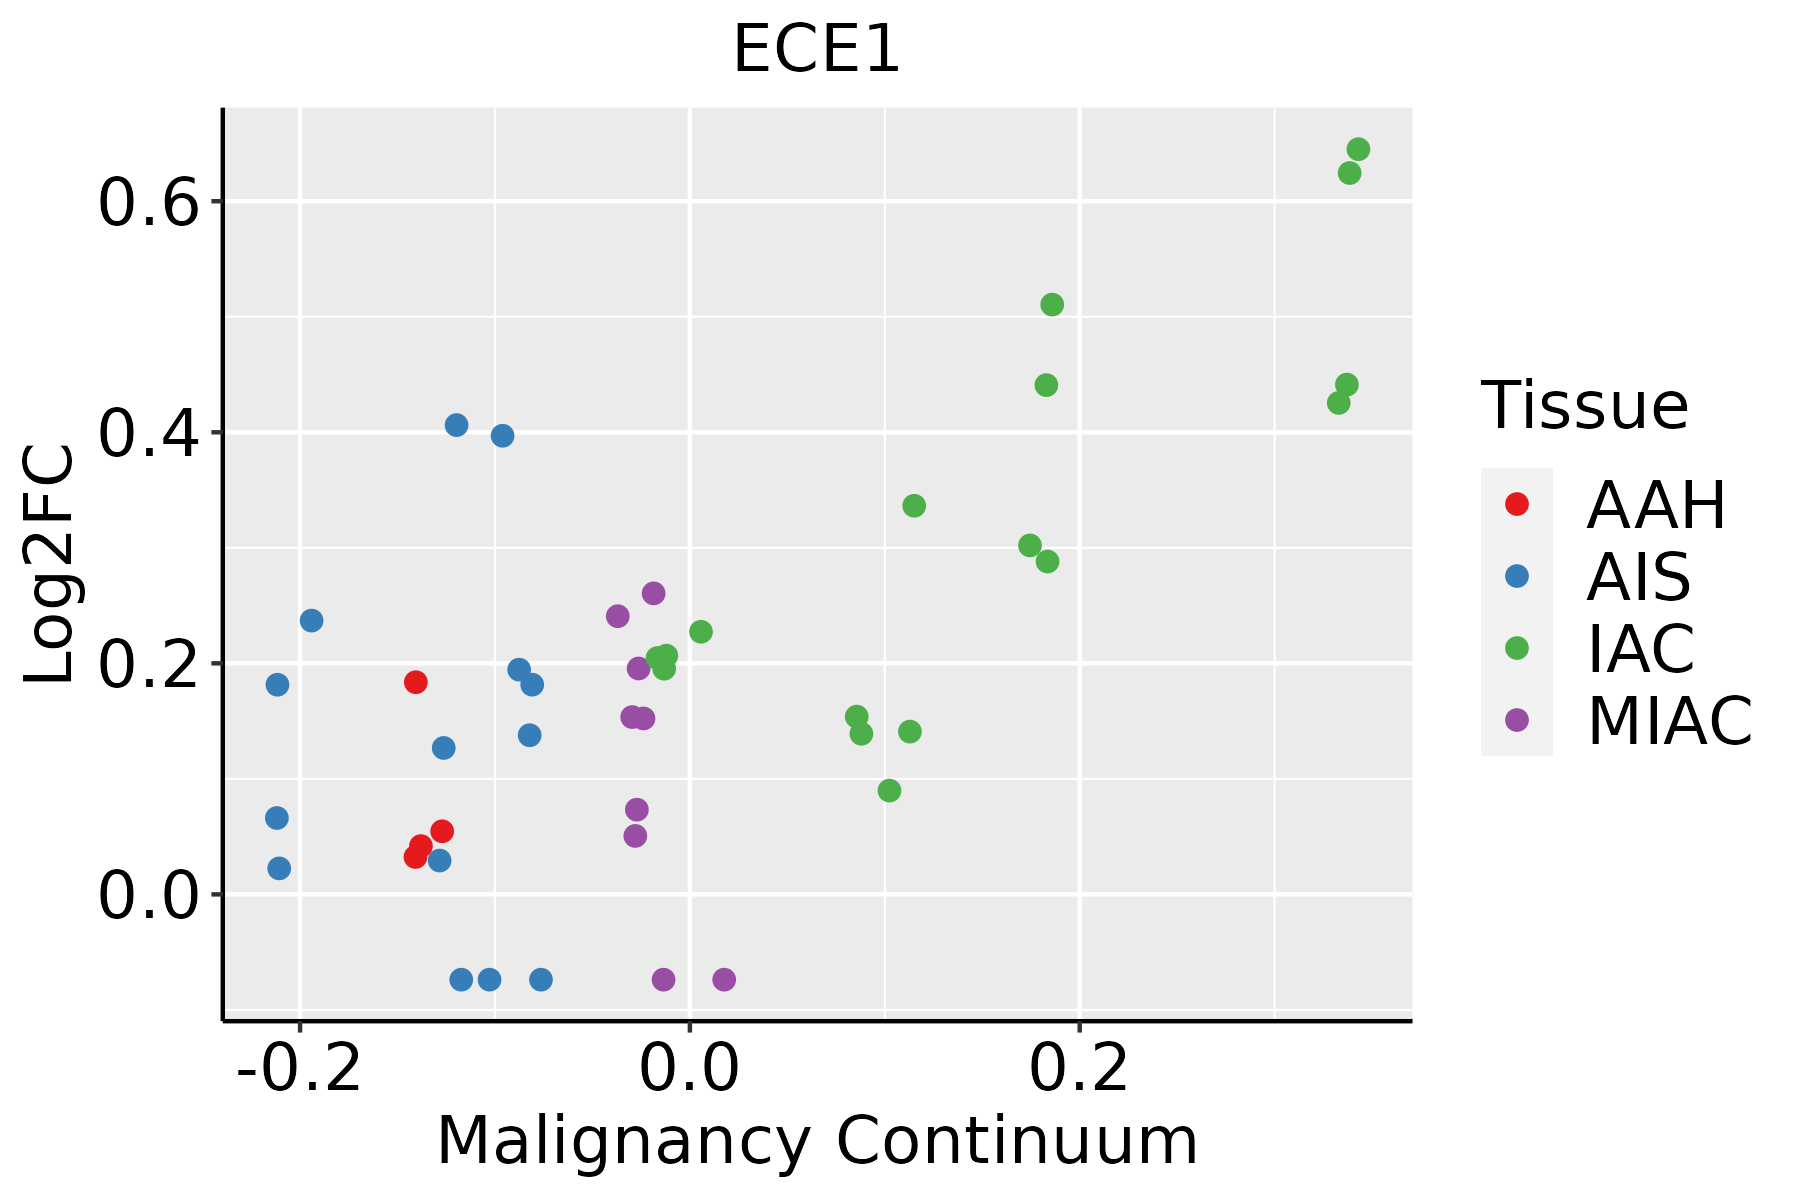 | AAH: Atypical adenomatous hyperplasia |
| AIS: Adenocarcinoma in situ | ||
| IAC: Invasive lung adenocarcinoma | ||
| MIA: Minimally invasive adenocarcinoma | ||
| Oral Cavity |  | EOLP: Erosive Oral lichen planus |
| LP: leukoplakia | ||
| NEOLP: Non-erosive oral lichen planus | ||
| OSCC: Oral squamous cell carcinoma | ||
| Prostate | 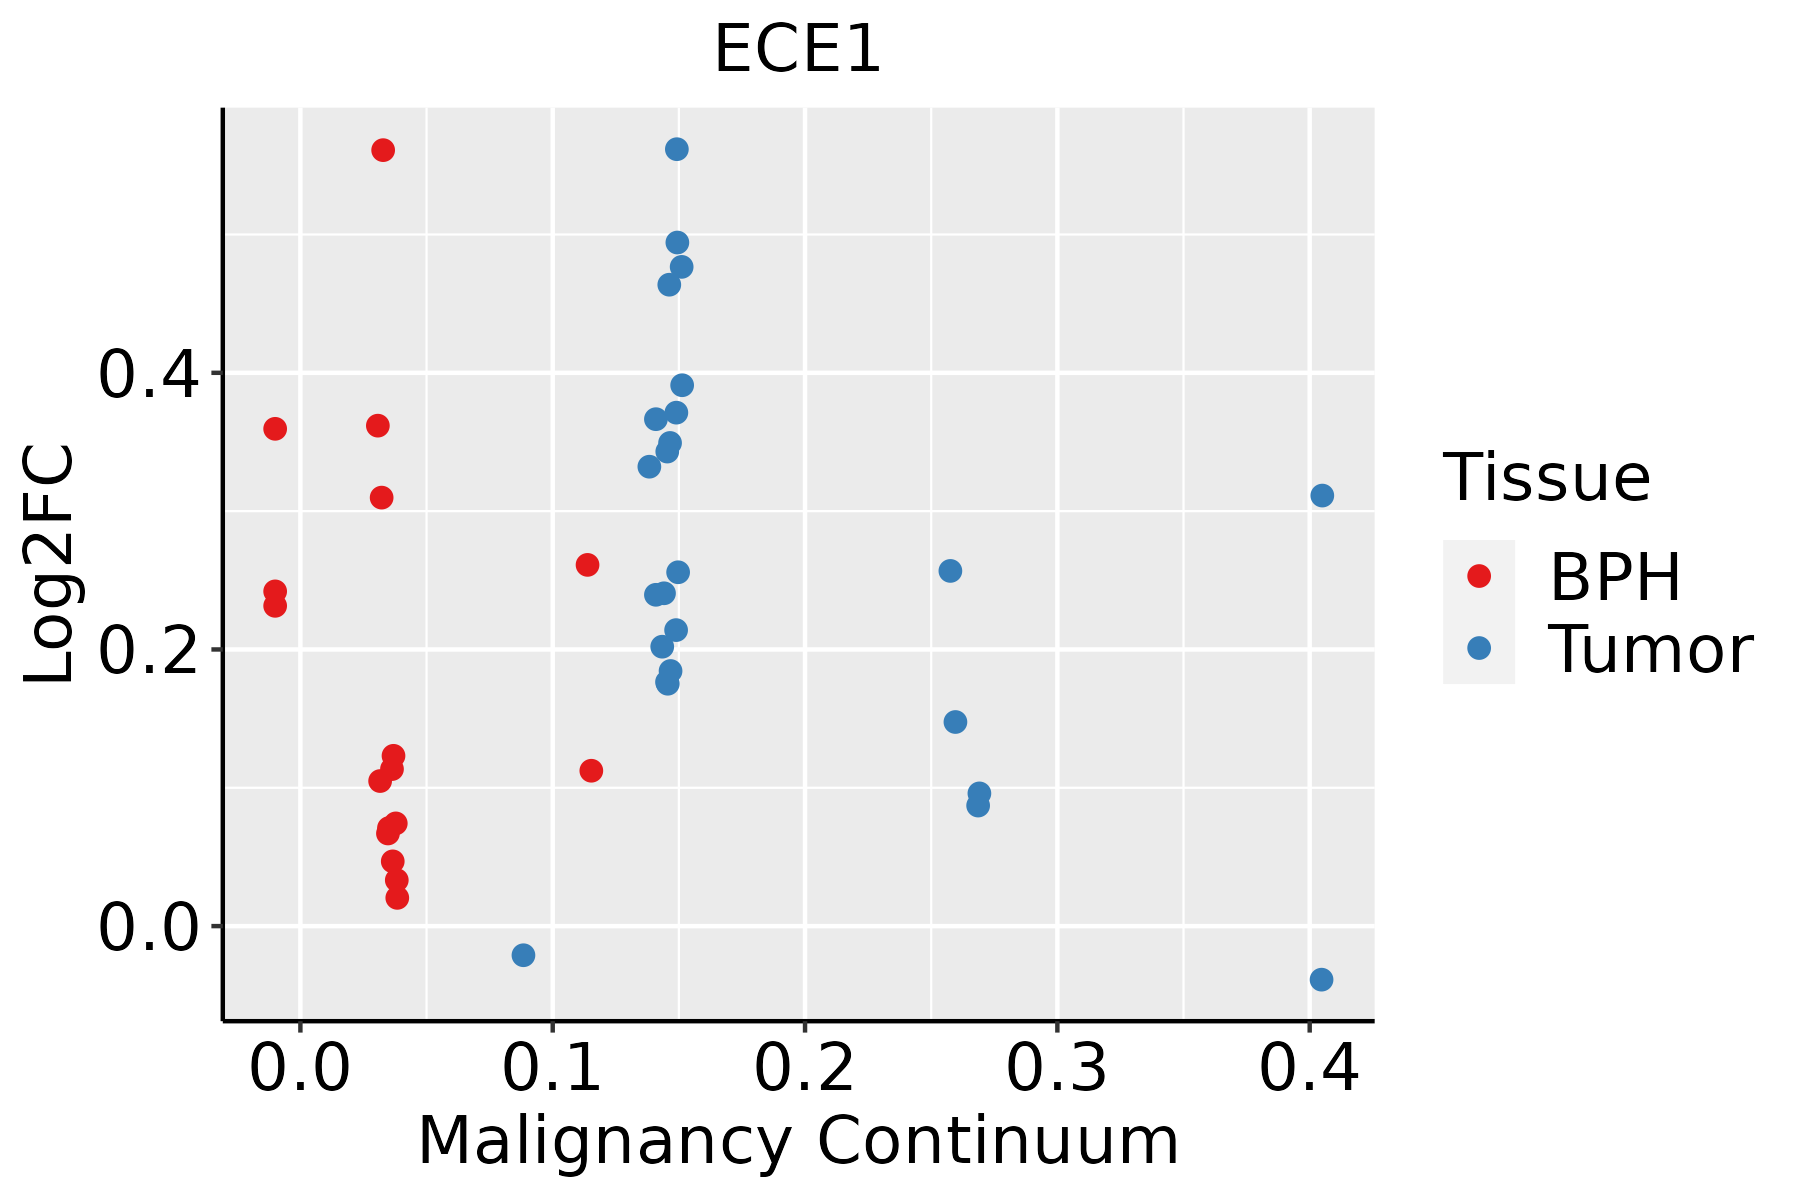 | BPH: Benign Prostatic Hyperplasia |
| Thyroid | 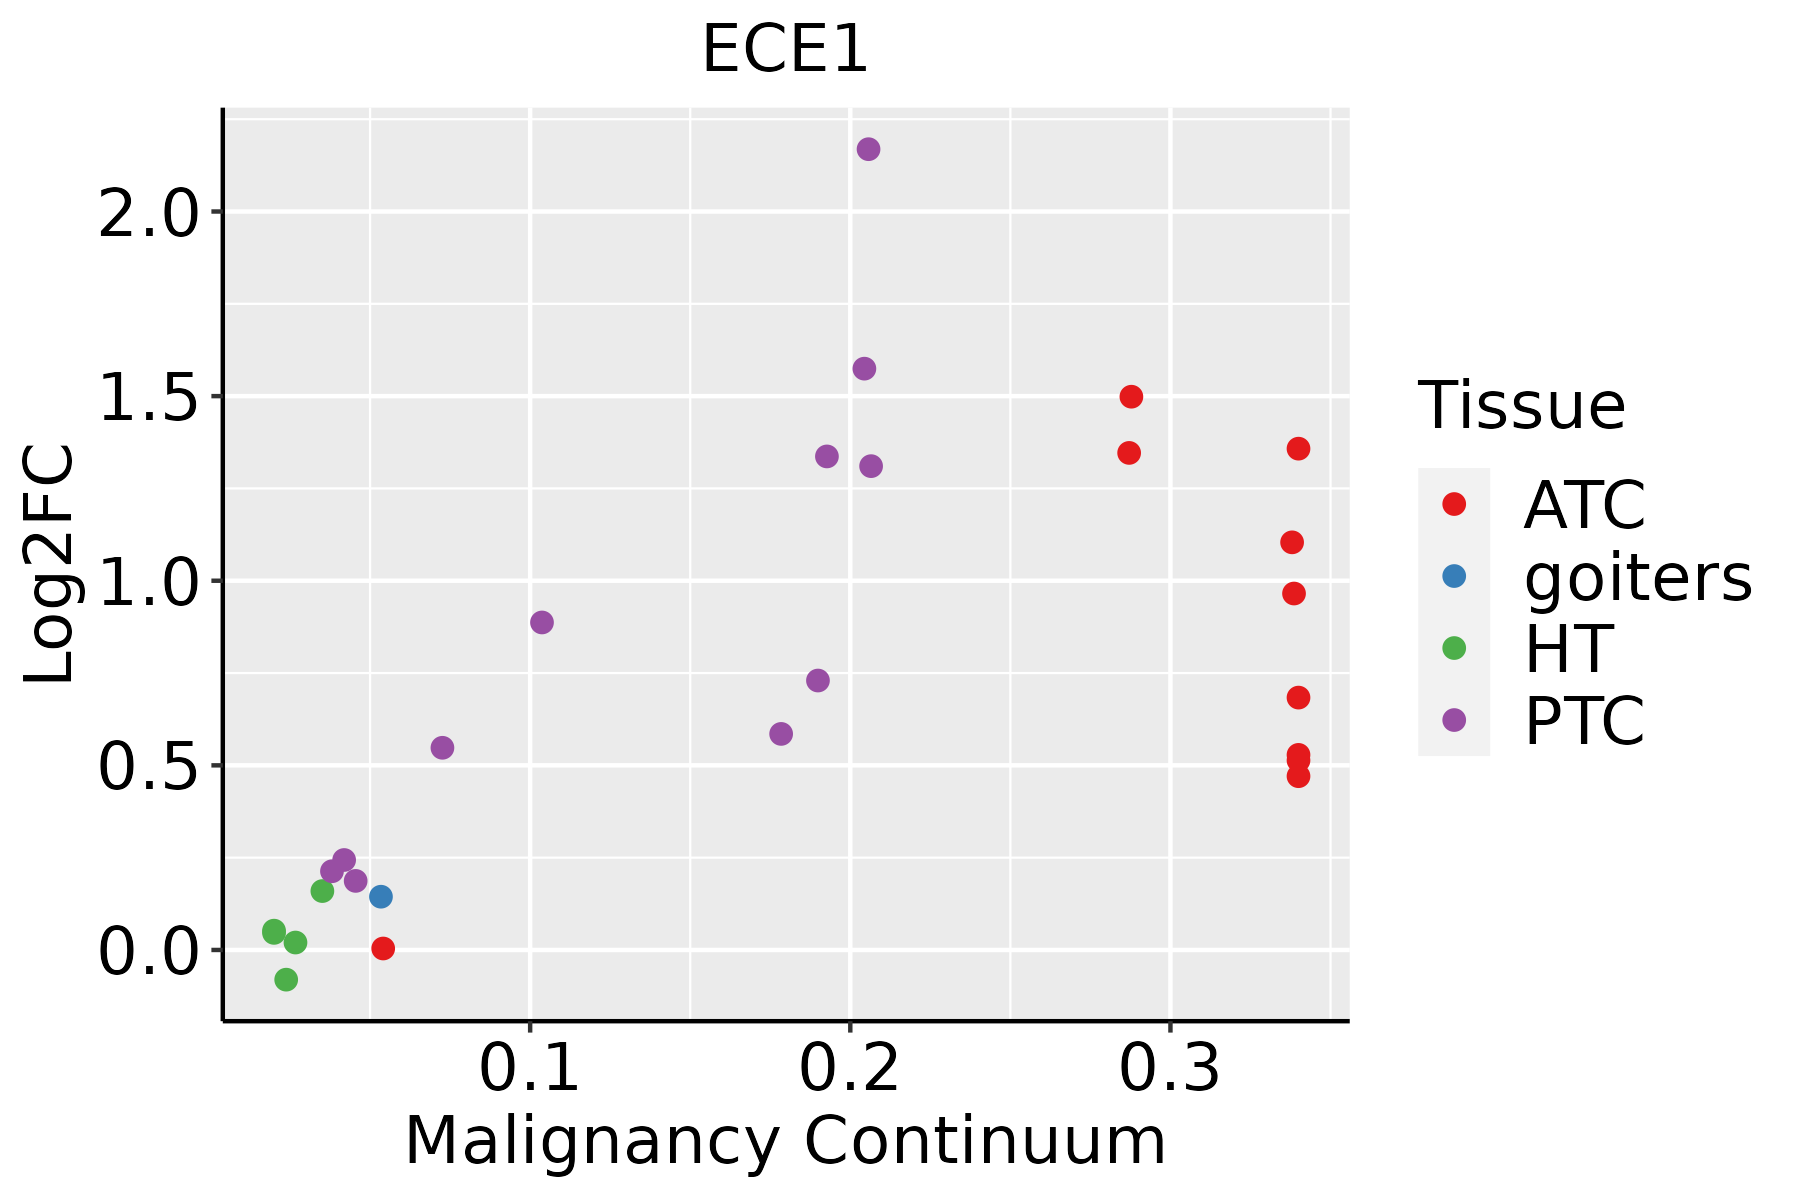 | ATC: Anaplastic thyroid cancer |
| HT: Hashimoto's thyroiditis | ||
| PTC: Papillary thyroid cancer |
| ∗log2FC in expression of this searched gene in stem-like cells from each diseased tissue sample relative to stem-like cells in normal samples in each tissue plotted against the malignancy continuum. Samples are colored based on if they are from different disease stage. |
Top |
Malignant transformation related pathway analysis |
| Find out the enriched GO biological processes and KEGG pathways involved in transition from healthy to precancer to cancer |
| Tissue | Disease Stage | Enriched GO biological Processes |
| Colorectum | AD |  |
| Colorectum | SER |  |
| Colorectum | MSS |  |
| Colorectum | MSI-H |  |
| Colorectum | FAP |  |
| ∗Top 15 enriched GO BP terms are showed in the bar plot of each disease state in each tissue. Each row represents a significant GO biological process which is colored according to the -log10(p.adjust). |
| Page: 1 2 3 4 5 6 7 8 9 |
| GO ID | Tissue | Disease Stage | Description | Gene Ratio | Bg Ratio | pvalue | p.adjust | Count |
| GO:00431127 | Cervix | CC | receptor metabolic process | 37/2311 | 166/18723 | 2.31e-04 | 2.58e-03 | 37 |
| GO:00516048 | Cervix | CC | protein maturation | 56/2311 | 294/18723 | 5.90e-04 | 5.59e-03 | 56 |
| GO:00487365 | Cervix | CC | appendage development | 35/2311 | 172/18723 | 1.88e-03 | 1.39e-02 | 35 |
| GO:00601735 | Cervix | CC | limb development | 35/2311 | 172/18723 | 1.88e-03 | 1.39e-02 | 35 |
| GO:0043112 | Colorectum | AD | receptor metabolic process | 62/3918 | 166/18723 | 8.18e-07 | 2.85e-05 | 62 |
| GO:0001881 | Colorectum | AD | receptor recycling | 18/3918 | 33/18723 | 2.23e-05 | 4.40e-04 | 18 |
| GO:0051604 | Colorectum | AD | protein maturation | 85/3918 | 294/18723 | 6.73e-04 | 6.91e-03 | 85 |
| GO:0001919 | Colorectum | AD | regulation of receptor recycling | 12/3918 | 23/18723 | 9.11e-04 | 8.71e-03 | 12 |
| GO:0048736 | Colorectum | AD | appendage development | 51/3918 | 172/18723 | 4.20e-03 | 2.89e-02 | 51 |
| GO:0060173 | Colorectum | AD | limb development | 51/3918 | 172/18723 | 4.20e-03 | 2.89e-02 | 51 |
| GO:0016485 | Colorectum | AD | protein processing | 63/3918 | 225/18723 | 6.77e-03 | 4.19e-02 | 63 |
| GO:00516041 | Colorectum | SER | protein maturation | 73/2897 | 294/18723 | 1.82e-05 | 5.38e-04 | 73 |
| GO:00164851 | Colorectum | SER | protein processing | 55/2897 | 225/18723 | 2.84e-04 | 4.67e-03 | 55 |
| GO:00487361 | Colorectum | SER | appendage development | 42/2897 | 172/18723 | 1.43e-03 | 1.55e-02 | 42 |
| GO:00601731 | Colorectum | SER | limb development | 42/2897 | 172/18723 | 1.43e-03 | 1.55e-02 | 42 |
| GO:0035107 | Colorectum | SER | appendage morphogenesis | 33/2897 | 138/18723 | 6.10e-03 | 4.42e-02 | 33 |
| GO:0035108 | Colorectum | SER | limb morphogenesis | 33/2897 | 138/18723 | 6.10e-03 | 4.42e-02 | 33 |
| GO:00431122 | Colorectum | FAP | receptor metabolic process | 46/2622 | 166/18723 | 2.70e-06 | 1.02e-04 | 46 |
| GO:00351071 | Colorectum | FAP | appendage morphogenesis | 35/2622 | 138/18723 | 2.74e-04 | 3.66e-03 | 35 |
| GO:00351081 | Colorectum | FAP | limb morphogenesis | 35/2622 | 138/18723 | 2.74e-04 | 3.66e-03 | 35 |
| Page: 1 2 3 4 5 |
| Pathway ID | Tissue | Disease Stage | Description | Gene Ratio | Bg Ratio | pvalue | p.adjust | qvalue | Count |
| Page: 1 |
Top |
Cell-cell communication analysis |
| Identification of potential cell-cell interactions between two cell types and their ligand-receptor pairs for different disease states |
| Ligand | Receptor | LRpair | Pathway | Tissue | Disease Stage |
| Page: 1 |
Top |
Single-cell gene regulatory network inference analysis |
| Find out the significant the regulons (TFs) and the target genes of each regulon across cell types for different disease states |
| TF | Cell Type | Tissue | Disease Stage | Target Gene | RSS | Regulon Activity |
| ∗The dot plots of a searched regulon are shown for all cell subpopulations in each disease state of each tissue based on the regulon specific score inferred using pySCENIC and by calculating the average expression. |
| Page: 1 |
Top |
Somatic mutation of malignant transformation related genes |
| Annotation of somatic variants for genes involved in malignant transformation |
| Hugo Symbol | Variant Class | Variant Classification | dbSNP RS | HGVSc | HGVSp | HGVSp Short | SWISSPROT | BIOTYPE | SIFT | PolyPhen | Tumor Sample Barcode | Tissue | Histology | Sex | Age | Stage | Therapy Types | Drugs | Outcome |
| ECE1 | SNV | Missense_Mutation | novel | c.2108A>G | p.Asn703Ser | p.N703S | P42892 | protein_coding | tolerated(0.38) | benign(0.009) | TCGA-AN-A046-01 | Breast | breast invasive carcinoma | Female | >=65 | I/II | Unknown | Unknown | SD |
| ECE1 | SNV | Missense_Mutation | novel | c.1846N>A | p.Gln616Lys | p.Q616K | P42892 | protein_coding | deleterious(0.03) | benign(0.113) | TCGA-AN-A0FZ-01 | Breast | breast invasive carcinoma | Female | <65 | III/IV | Unknown | Unknown | SD |
| ECE1 | SNV | Missense_Mutation | c.2259N>G | p.Phe753Leu | p.F753L | P42892 | protein_coding | deleterious(0) | probably_damaging(0.998) | TCGA-E2-A15O-01 | Breast | breast invasive carcinoma | Female | >=65 | I/II | Hormone Therapy | arimidex | PD | |
| ECE1 | SNV | Missense_Mutation | rs778746689 | c.1927G>A | p.Glu643Lys | p.E643K | P42892 | protein_coding | tolerated(0.16) | benign(0.013) | TCGA-E9-A1NC-01 | Breast | breast invasive carcinoma | Female | <65 | I/II | Chemotherapy | doxorubicin | CR |
| ECE1 | SNV | Missense_Mutation | c.2290N>T | p.Pro764Ser | p.P764S | P42892 | protein_coding | tolerated(0.72) | benign(0) | TCGA-EW-A1P7-01 | Breast | breast invasive carcinoma | Female | <65 | I/II | Chemotherapy | carboplatin | PD | |
| ECE1 | SNV | Missense_Mutation | novel | c.181N>A | p.Ala61Thr | p.A61T | P42892 | protein_coding | tolerated(0.33) | benign(0.017) | TCGA-S3-AA0Z-01 | Breast | breast invasive carcinoma | Female | <65 | I/II | Ancillary | neulasta | CR |
| ECE1 | insertion | Nonsense_Mutation | novel | c.1121_1122insGAGGTTGTAGTGAGCTGTGATTGCACTGTTG | p.Tyr374Ter | p.Y374* | P42892 | protein_coding | TCGA-A8-A09C-01 | Breast | breast invasive carcinoma | Female | >=65 | I/II | Unknown | Unknown | SD | ||
| ECE1 | SNV | Missense_Mutation | rs368124166 | c.902N>A | p.Arg301Gln | p.R301Q | P42892 | protein_coding | tolerated(0.09) | benign(0.018) | TCGA-A6-A565-01 | Colorectum | colon adenocarcinoma | Female | <65 | III/IV | Unspecific | 5FU | PD |
| ECE1 | SNV | Missense_Mutation | rs150644074 | c.548N>A | p.Arg183His | p.R183H | P42892 | protein_coding | tolerated(0.24) | benign(0.028) | TCGA-AA-3811-01 | Colorectum | colon adenocarcinoma | Female | >=65 | III/IV | Unknown | Unknown | PD |
| ECE1 | SNV | Missense_Mutation | c.622N>T | p.Gly208Cys | p.G208C | P42892 | protein_coding | deleterious(0) | probably_damaging(0.999) | TCGA-AA-3819-01 | Colorectum | colon adenocarcinoma | Female | <65 | I/II | Unknown | Unknown | SD |
| Page: 1 2 3 4 5 6 7 |
Top |
Related drugs of malignant transformation related genes |
| Identification of chemicals and drugs interact with genes involved in malignant transfromation |
| (DGIdb 4.0) |
| Entrez ID | Symbol | Category | Interaction Types | Drug Claim Name | Drug Name | PMIDs |
| 1889 | ECE1 | DRUGGABLE GENOME, ENZYME, EXTERNAL SIDE OF PLASMA MEMBRANE, PROTEASE | inhibitor | 178103120 | DAGLUTRIL | |
| 1889 | ECE1 | DRUGGABLE GENOME, ENZYME, EXTERNAL SIDE OF PLASMA MEMBRANE, PROTEASE | SLV 306 | |||
| 1889 | ECE1 | DRUGGABLE GENOME, ENZYME, EXTERNAL SIDE OF PLASMA MEMBRANE, PROTEASE | SLV-338 | |||
| 1889 | ECE1 | DRUGGABLE GENOME, ENZYME, EXTERNAL SIDE OF PLASMA MEMBRANE, PROTEASE | inhibitor | 178103121 | ||
| 1889 | ECE1 | DRUGGABLE GENOME, ENZYME, EXTERNAL SIDE OF PLASMA MEMBRANE, PROTEASE | inhibitor | 252166818 | ||
| 1889 | ECE1 | DRUGGABLE GENOME, ENZYME, EXTERNAL SIDE OF PLASMA MEMBRANE, PROTEASE | SLV-334 | SLV-334 | ||
| 1889 | ECE1 | DRUGGABLE GENOME, ENZYME, EXTERNAL SIDE OF PLASMA MEMBRANE, PROTEASE | inhibitor | 178103176 |
| Page: 1 |

Copyright 2023-Present -The University of Texas Health Science Center at Houston |