
|
|||||
|
 | |
| |
| |
| |
| |
| |
|
Gene: ECD |
Gene summary for ECD |
| Gene information | Species | Human | Gene symbol | ECD | Gene ID | 11319 |
| Gene name | ecdysoneless cell cycle regulator | |
| Gene Alias | GCR2 | |
| Cytomap | 10q22.2 | |
| Gene Type | protein-coding | GO ID | GO:0000082 | UniProtAcc | O95905 |
Top |
Malignant transformation analysis |
| Identification of the aberrant gene expression in precancerous and cancerous lesions by comparing the gene expression of stem-like cells in diseased tissues with normal stem cells |
| Entrez ID | Symbol | Replicates | Species | Organ | Tissue | Adj P-value | Log2FC | Malignancy |
| 11319 | ECD | LZE4T | Human | Esophagus | ESCC | 2.52e-03 | 1.58e-01 | 0.0811 |
| 11319 | ECD | LZE8T | Human | Esophagus | ESCC | 1.77e-09 | 1.95e-01 | 0.067 |
| 11319 | ECD | LZE20T | Human | Esophagus | ESCC | 1.29e-04 | 7.51e-02 | 0.0662 |
| 11319 | ECD | LZE24T | Human | Esophagus | ESCC | 7.29e-21 | 4.39e-01 | 0.0596 |
| 11319 | ECD | P1T-E | Human | Esophagus | ESCC | 5.79e-03 | 1.91e-01 | 0.0875 |
| 11319 | ECD | P2T-E | Human | Esophagus | ESCC | 1.24e-26 | 4.33e-01 | 0.1177 |
| 11319 | ECD | P4T-E | Human | Esophagus | ESCC | 1.32e-15 | 3.64e-01 | 0.1323 |
| 11319 | ECD | P5T-E | Human | Esophagus | ESCC | 1.53e-17 | 3.08e-01 | 0.1327 |
| 11319 | ECD | P8T-E | Human | Esophagus | ESCC | 2.38e-20 | 1.77e-01 | 0.0889 |
| 11319 | ECD | P9T-E | Human | Esophagus | ESCC | 3.14e-13 | 1.74e-01 | 0.1131 |
| 11319 | ECD | P10T-E | Human | Esophagus | ESCC | 3.06e-11 | 1.15e-01 | 0.116 |
| 11319 | ECD | P11T-E | Human | Esophagus | ESCC | 4.70e-13 | 4.86e-01 | 0.1426 |
| 11319 | ECD | P12T-E | Human | Esophagus | ESCC | 1.44e-34 | 6.60e-01 | 0.1122 |
| 11319 | ECD | P15T-E | Human | Esophagus | ESCC | 1.67e-22 | 4.56e-01 | 0.1149 |
| 11319 | ECD | P16T-E | Human | Esophagus | ESCC | 1.63e-24 | 4.38e-01 | 0.1153 |
| 11319 | ECD | P17T-E | Human | Esophagus | ESCC | 1.99e-06 | 2.93e-01 | 0.1278 |
| 11319 | ECD | P19T-E | Human | Esophagus | ESCC | 2.28e-05 | 2.83e-01 | 0.1662 |
| 11319 | ECD | P20T-E | Human | Esophagus | ESCC | 5.05e-20 | 4.95e-01 | 0.1124 |
| 11319 | ECD | P21T-E | Human | Esophagus | ESCC | 2.43e-21 | 4.51e-01 | 0.1617 |
| 11319 | ECD | P22T-E | Human | Esophagus | ESCC | 4.65e-19 | 2.14e-01 | 0.1236 |
| Page: 1 2 3 4 |
| Tissue | Expression Dynamics | Abbreviation |
| Esophagus |  | ESCC: Esophageal squamous cell carcinoma |
| HGIN: High-grade intraepithelial neoplasias | ||
| LGIN: Low-grade intraepithelial neoplasias | ||
| Oral Cavity | 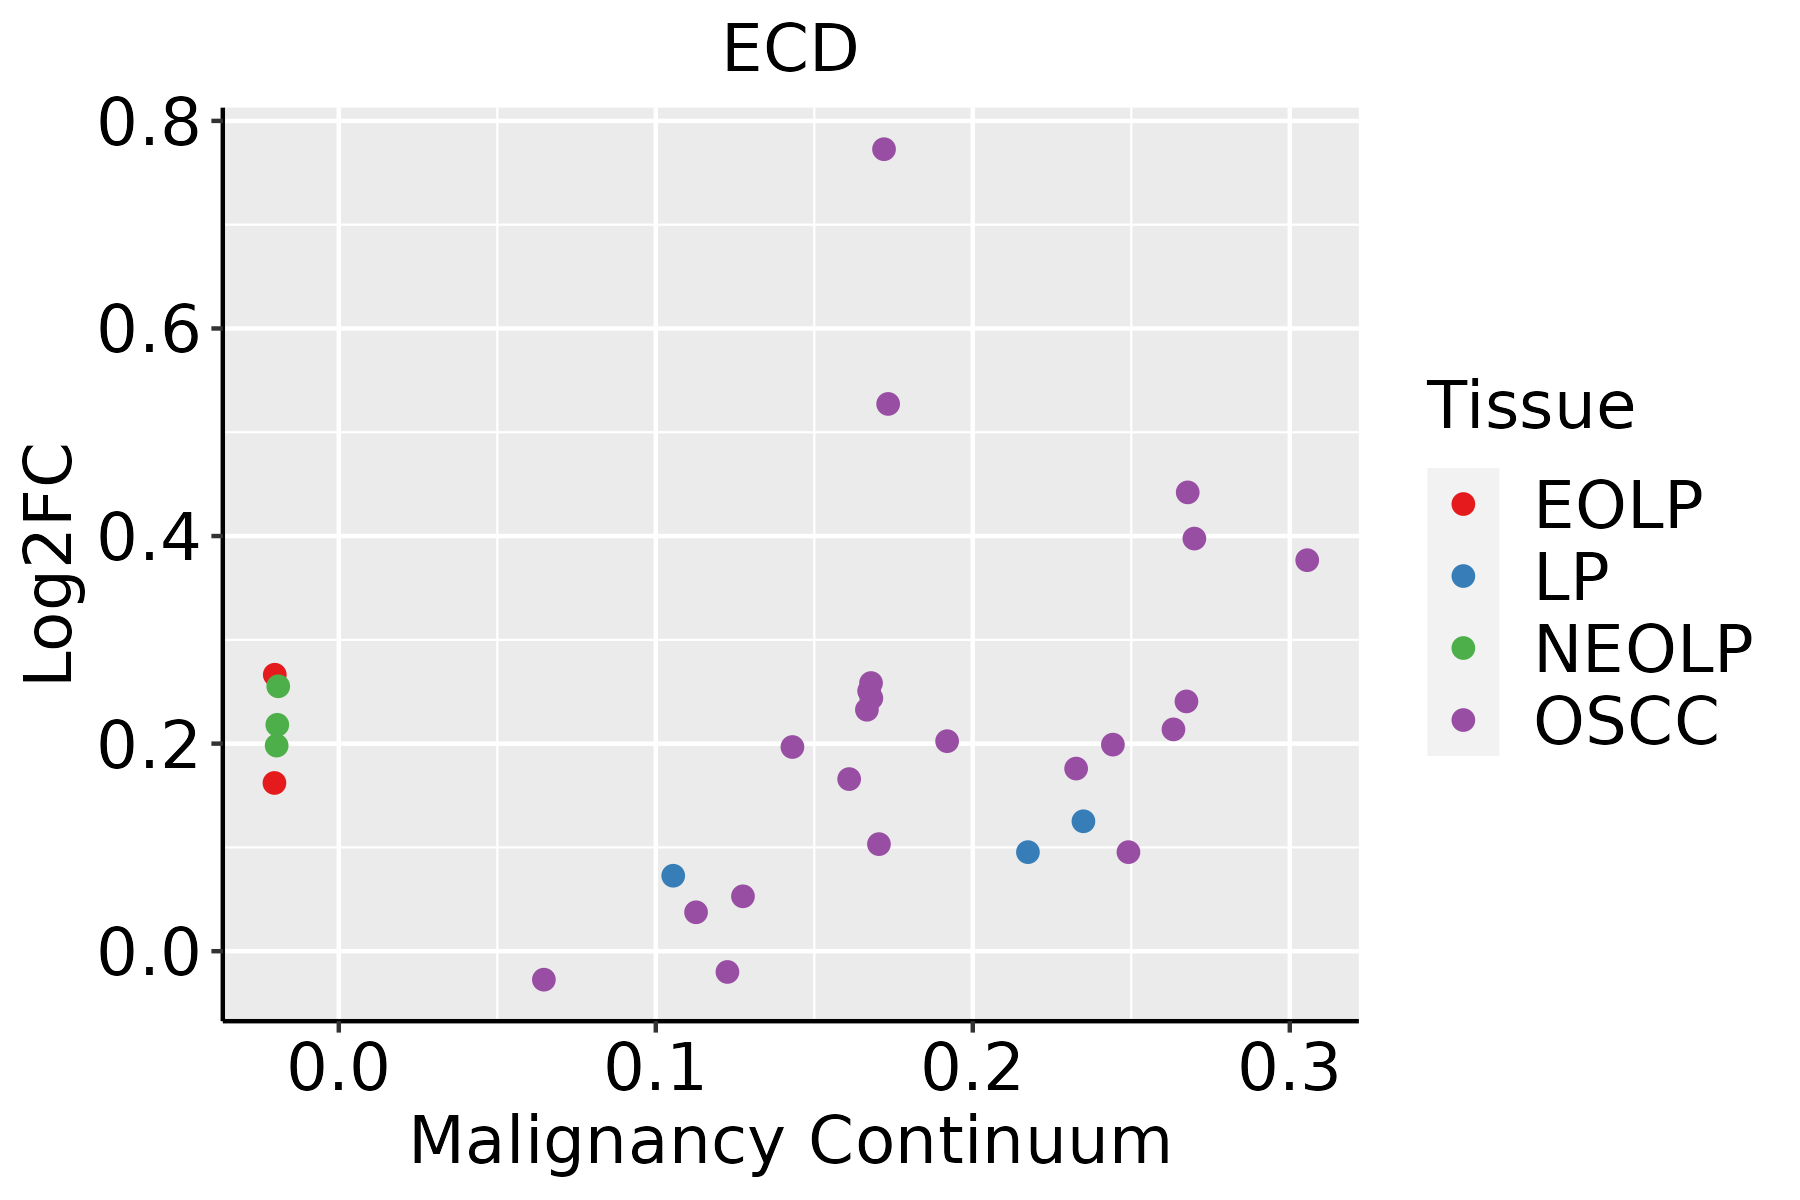 | EOLP: Erosive Oral lichen planus |
| LP: leukoplakia | ||
| NEOLP: Non-erosive oral lichen planus | ||
| OSCC: Oral squamous cell carcinoma |
| ∗log2FC in expression of this searched gene in stem-like cells from each diseased tissue sample relative to stem-like cells in normal samples in each tissue plotted against the malignancy continuum. Samples are colored based on if they are from different disease stage. |
Top |
Malignant transformation related pathway analysis |
| Find out the enriched GO biological processes and KEGG pathways involved in transition from healthy to precancer to cancer |
| Tissue | Disease Stage | Enriched GO biological Processes |
| Colorectum | AD |  |
| Colorectum | SER |  |
| Colorectum | MSS |  |
| Colorectum | MSI-H |  |
| Colorectum | FAP |  |
| ∗Top 15 enriched GO BP terms are showed in the bar plot of each disease state in each tissue. Each row represents a significant GO biological process which is colored according to the -log10(p.adjust). |
| Page: 1 2 3 4 5 6 7 8 9 |
| GO ID | Tissue | Disease Stage | Description | Gene Ratio | Bg Ratio | pvalue | p.adjust | Count |
| GO:0008380111 | Esophagus | ESCC | RNA splicing | 336/8552 | 434/18723 | 1.74e-42 | 3.67e-39 | 336 |
| GO:004477216 | Esophagus | ESCC | mitotic cell cycle phase transition | 281/8552 | 424/18723 | 4.63e-18 | 4.45e-16 | 281 |
| GO:000734615 | Esophagus | ESCC | regulation of mitotic cell cycle | 293/8552 | 457/18723 | 8.00e-16 | 5.64e-14 | 293 |
| GO:190198713 | Esophagus | ESCC | regulation of cell cycle phase transition | 242/8552 | 390/18723 | 3.86e-11 | 1.26e-09 | 242 |
| GO:190199013 | Esophagus | ESCC | regulation of mitotic cell cycle phase transition | 191/8552 | 299/18723 | 1.35e-10 | 3.94e-09 | 191 |
| GO:000008214 | Esophagus | ESCC | G1/S transition of mitotic cell cycle | 134/8552 | 214/18723 | 4.04e-07 | 5.55e-06 | 134 |
| GO:004484314 | Esophagus | ESCC | cell cycle G1/S phase transition | 148/8552 | 241/18723 | 5.68e-07 | 7.48e-06 | 148 |
| GO:200004513 | Esophagus | ESCC | regulation of G1/S transition of mitotic cell cycle | 82/8552 | 142/18723 | 2.49e-03 | 1.08e-02 | 82 |
| GO:190280613 | Esophagus | ESCC | regulation of cell cycle G1/S phase transition | 95/8552 | 168/18723 | 2.91e-03 | 1.22e-02 | 95 |
| GO:000838020 | Oral cavity | OSCC | RNA splicing | 308/7305 | 434/18723 | 2.43e-42 | 7.70e-39 | 308 |
| GO:00447728 | Oral cavity | OSCC | mitotic cell cycle phase transition | 255/7305 | 424/18723 | 5.29e-19 | 6.98e-17 | 255 |
| GO:00073469 | Oral cavity | OSCC | regulation of mitotic cell cycle | 266/7305 | 457/18723 | 3.87e-17 | 3.41e-15 | 266 |
| GO:19019905 | Oral cavity | OSCC | regulation of mitotic cell cycle phase transition | 173/7305 | 299/18723 | 2.49e-11 | 8.35e-10 | 173 |
| GO:19019875 | Oral cavity | OSCC | regulation of cell cycle phase transition | 209/7305 | 390/18723 | 2.79e-09 | 6.42e-08 | 209 |
| GO:00000826 | Oral cavity | OSCC | G1/S transition of mitotic cell cycle | 120/7305 | 214/18723 | 2.86e-07 | 4.40e-06 | 120 |
| GO:00448436 | Oral cavity | OSCC | cell cycle G1/S phase transition | 131/7305 | 241/18723 | 8.77e-07 | 1.20e-05 | 131 |
| GO:20000455 | Oral cavity | OSCC | regulation of G1/S transition of mitotic cell cycle | 74/7305 | 142/18723 | 1.01e-03 | 5.24e-03 | 74 |
| GO:19028064 | Oral cavity | OSCC | regulation of cell cycle G1/S phase transition | 84/7305 | 168/18723 | 2.38e-03 | 1.05e-02 | 84 |
| GO:000838025 | Oral cavity | EOLP | RNA splicing | 115/2218 | 434/18723 | 2.24e-17 | 3.04e-14 | 115 |
| GO:004477222 | Oral cavity | EOLP | mitotic cell cycle phase transition | 81/2218 | 424/18723 | 8.32e-06 | 1.59e-04 | 81 |
| Page: 1 2 |
| Pathway ID | Tissue | Disease Stage | Description | Gene Ratio | Bg Ratio | pvalue | p.adjust | qvalue | Count |
| Page: 1 |
Top |
Cell-cell communication analysis |
| Identification of potential cell-cell interactions between two cell types and their ligand-receptor pairs for different disease states |
| Ligand | Receptor | LRpair | Pathway | Tissue | Disease Stage |
| Page: 1 |
Top |
Single-cell gene regulatory network inference analysis |
| Find out the significant the regulons (TFs) and the target genes of each regulon across cell types for different disease states |
| TF | Cell Type | Tissue | Disease Stage | Target Gene | RSS | Regulon Activity |
| ∗The dot plots of a searched regulon are shown for all cell subpopulations in each disease state of each tissue based on the regulon specific score inferred using pySCENIC and by calculating the average expression. |
| Page: 1 |
Top |
Somatic mutation of malignant transformation related genes |
| Annotation of somatic variants for genes involved in malignant transformation |
| Hugo Symbol | Variant Class | Variant Classification | dbSNP RS | HGVSc | HGVSp | HGVSp Short | SWISSPROT | BIOTYPE | SIFT | PolyPhen | Tumor Sample Barcode | Tissue | Histology | Sex | Age | Stage | Therapy Types | Drugs | Outcome |
| ECD | SNV | Missense_Mutation | novel | c.763N>A | p.Glu255Lys | p.E255K | O95905 | protein_coding | deleterious(0.02) | possibly_damaging(0.661) | TCGA-A7-A4SF-01 | Breast | breast invasive carcinoma | Female | <65 | I/II | Chemotherapy | carboplatin | CR |
| ECD | SNV | Missense_Mutation | c.1896N>G | p.Asn632Lys | p.N632K | O95905 | protein_coding | deleterious(0) | probably_damaging(1) | TCGA-A8-A09I-01 | Breast | breast invasive carcinoma | Female | >=65 | I/II | Hormone Therapy | anastrozole | SD | |
| ECD | SNV | Missense_Mutation | c.28N>C | p.Met10Leu | p.M10L | O95905 | protein_coding | tolerated(0.17) | benign(0.003) | TCGA-BH-A0BZ-01 | Breast | breast invasive carcinoma | Female | <65 | III/IV | Chemotherapy | doxorubicin | CR | |
| ECD | SNV | Missense_Mutation | novel | c.1363N>G | p.Gln455Glu | p.Q455E | O95905 | protein_coding | tolerated(0.65) | benign(0.023) | TCGA-PE-A5DE-01 | Breast | breast invasive carcinoma | Female | <65 | I/II | Chemotherapy | taxotere | CR |
| ECD | SNV | Missense_Mutation | novel | c.1700N>T | p.Ser567Phe | p.S567F | O95905 | protein_coding | deleterious(0.03) | benign(0.086) | TCGA-VS-A8EL-01 | Cervix | cervical & endocervical cancer | Female | <65 | I/II | Chemotherapy | cisplatin | CR |
| ECD | SNV | Missense_Mutation | c.1109C>T | p.Ser370Leu | p.S370L | O95905 | protein_coding | deleterious(0) | possibly_damaging(0.783) | TCGA-VS-A9V5-01 | Cervix | cervical & endocervical cancer | Female | <65 | I/II | Chemotherapy | carboplatin | PD | |
| ECD | SNV | Missense_Mutation | c.1000N>A | p.Ala334Thr | p.A334T | O95905 | protein_coding | tolerated(0.53) | benign(0.011) | TCGA-AA-A00N-01 | Colorectum | colon adenocarcinoma | Male | >=65 | I/II | Unknown | Unknown | PD | |
| ECD | SNV | Missense_Mutation | c.1681N>A | p.Glu561Lys | p.E561K | O95905 | protein_coding | tolerated(0.47) | benign(0) | TCGA-AA-A010-01 | Colorectum | colon adenocarcinoma | Female | <65 | I/II | Chemotherapy | folinic | CR | |
| ECD | SNV | Missense_Mutation | c.713N>A | p.Arg238Gln | p.R238Q | O95905 | protein_coding | deleterious(0) | probably_damaging(1) | TCGA-D5-6537-01 | Colorectum | colon adenocarcinoma | Male | <65 | III/IV | Unknown | Unknown | PD | |
| ECD | SNV | Missense_Mutation | c.1789A>G | p.Thr597Ala | p.T597A | O95905 | protein_coding | tolerated(0.08) | benign(0.42) | TCGA-G4-6320-01 | Colorectum | colon adenocarcinoma | Male | >=65 | III/IV | Chemotherapy | oxaliplatin | SD |
| Page: 1 2 3 4 5 |
Top |
Related drugs of malignant transformation related genes |
| Identification of chemicals and drugs interact with genes involved in malignant transfromation |
| (DGIdb 4.0) |
| Entrez ID | Symbol | Category | Interaction Types | Drug Claim Name | Drug Name | PMIDs |
| Page: 1 |

Copyright 2023-Present -The University of Texas Health Science Center at Houston |