
|
|||||
|
 | |
| |
| |
| |
| |
| |
|
Gene: EBPL |
Gene summary for EBPL |
| Gene information | Species | Human | Gene symbol | EBPL | Gene ID | 84650 |
| Gene name | EBP like | |
| Gene Alias | EBRP | |
| Cytomap | 13q14.2 | |
| Gene Type | protein-coding | GO ID | GO:0006629 | UniProtAcc | A0A0A0MRV2 |
Top |
Malignant transformation analysis |
| Identification of the aberrant gene expression in precancerous and cancerous lesions by comparing the gene expression of stem-like cells in diseased tissues with normal stem cells |
| Entrez ID | Symbol | Replicates | Species | Organ | Tissue | Adj P-value | Log2FC | Malignancy |
| 84650 | EBPL | HTA11_347_2000001011 | Human | Colorectum | AD | 1.37e-06 | 4.99e-01 | -0.1954 |
| 84650 | EBPL | HTA11_1391_2000001011 | Human | Colorectum | AD | 4.20e-03 | 4.71e-01 | -0.059 |
| 84650 | EBPL | HTA11_99999965104_69814 | Human | Colorectum | MSS | 1.98e-18 | 1.08e+00 | 0.281 |
| 84650 | EBPL | HTA11_99999971662_82457 | Human | Colorectum | MSS | 7.64e-25 | 9.11e-01 | 0.3859 |
| 84650 | EBPL | HTA11_99999974143_84620 | Human | Colorectum | MSS | 7.46e-05 | 4.08e-01 | 0.3005 |
| 84650 | EBPL | A015-C-203 | Human | Colorectum | FAP | 3.27e-07 | -1.89e-01 | -0.1294 |
| 84650 | EBPL | A002-C-201 | Human | Colorectum | FAP | 3.21e-03 | -1.45e-01 | 0.0324 |
| 84650 | EBPL | A001-C-108 | Human | Colorectum | FAP | 3.62e-02 | -1.07e-01 | -0.0272 |
| 84650 | EBPL | A002-C-205 | Human | Colorectum | FAP | 7.66e-07 | -2.04e-01 | -0.1236 |
| 84650 | EBPL | A002-C-114 | Human | Colorectum | FAP | 1.02e-08 | -2.44e-01 | -0.1561 |
| 84650 | EBPL | A015-C-104 | Human | Colorectum | FAP | 7.08e-08 | -1.76e-01 | -0.1899 |
| 84650 | EBPL | A001-C-014 | Human | Colorectum | FAP | 1.97e-02 | -1.41e-01 | 0.0135 |
| 84650 | EBPL | A002-C-016 | Human | Colorectum | FAP | 1.28e-04 | -1.59e-01 | 0.0521 |
| 84650 | EBPL | A015-C-002 | Human | Colorectum | FAP | 2.65e-05 | -2.44e-01 | -0.0763 |
| 84650 | EBPL | A002-C-116 | Human | Colorectum | FAP | 1.66e-05 | -1.48e-01 | -0.0452 |
| 84650 | EBPL | A018-E-020 | Human | Colorectum | FAP | 5.27e-05 | -1.85e-01 | -0.2034 |
| 84650 | EBPL | F034 | Human | Colorectum | FAP | 1.22e-02 | -1.20e-01 | -0.0665 |
| 84650 | EBPL | AEH-subject1 | Human | Endometrium | AEH | 3.56e-12 | -3.77e-01 | -0.3059 |
| 84650 | EBPL | AEH-subject2 | Human | Endometrium | AEH | 4.94e-22 | -4.97e-01 | -0.2525 |
| 84650 | EBPL | AEH-subject3 | Human | Endometrium | AEH | 4.49e-11 | -2.83e-01 | -0.2576 |
| Page: 1 2 3 4 5 6 7 8 9 |
| Tissue | Expression Dynamics | Abbreviation |
| Colorectum (GSE201348) |  | FAP: Familial adenomatous polyposis |
| CRC: Colorectal cancer | ||
| Colorectum (HTA11) |  | AD: Adenomas |
| SER: Sessile serrated lesions | ||
| MSI-H: Microsatellite-high colorectal cancer | ||
| MSS: Microsatellite stable colorectal cancer | ||
| Endometrium | 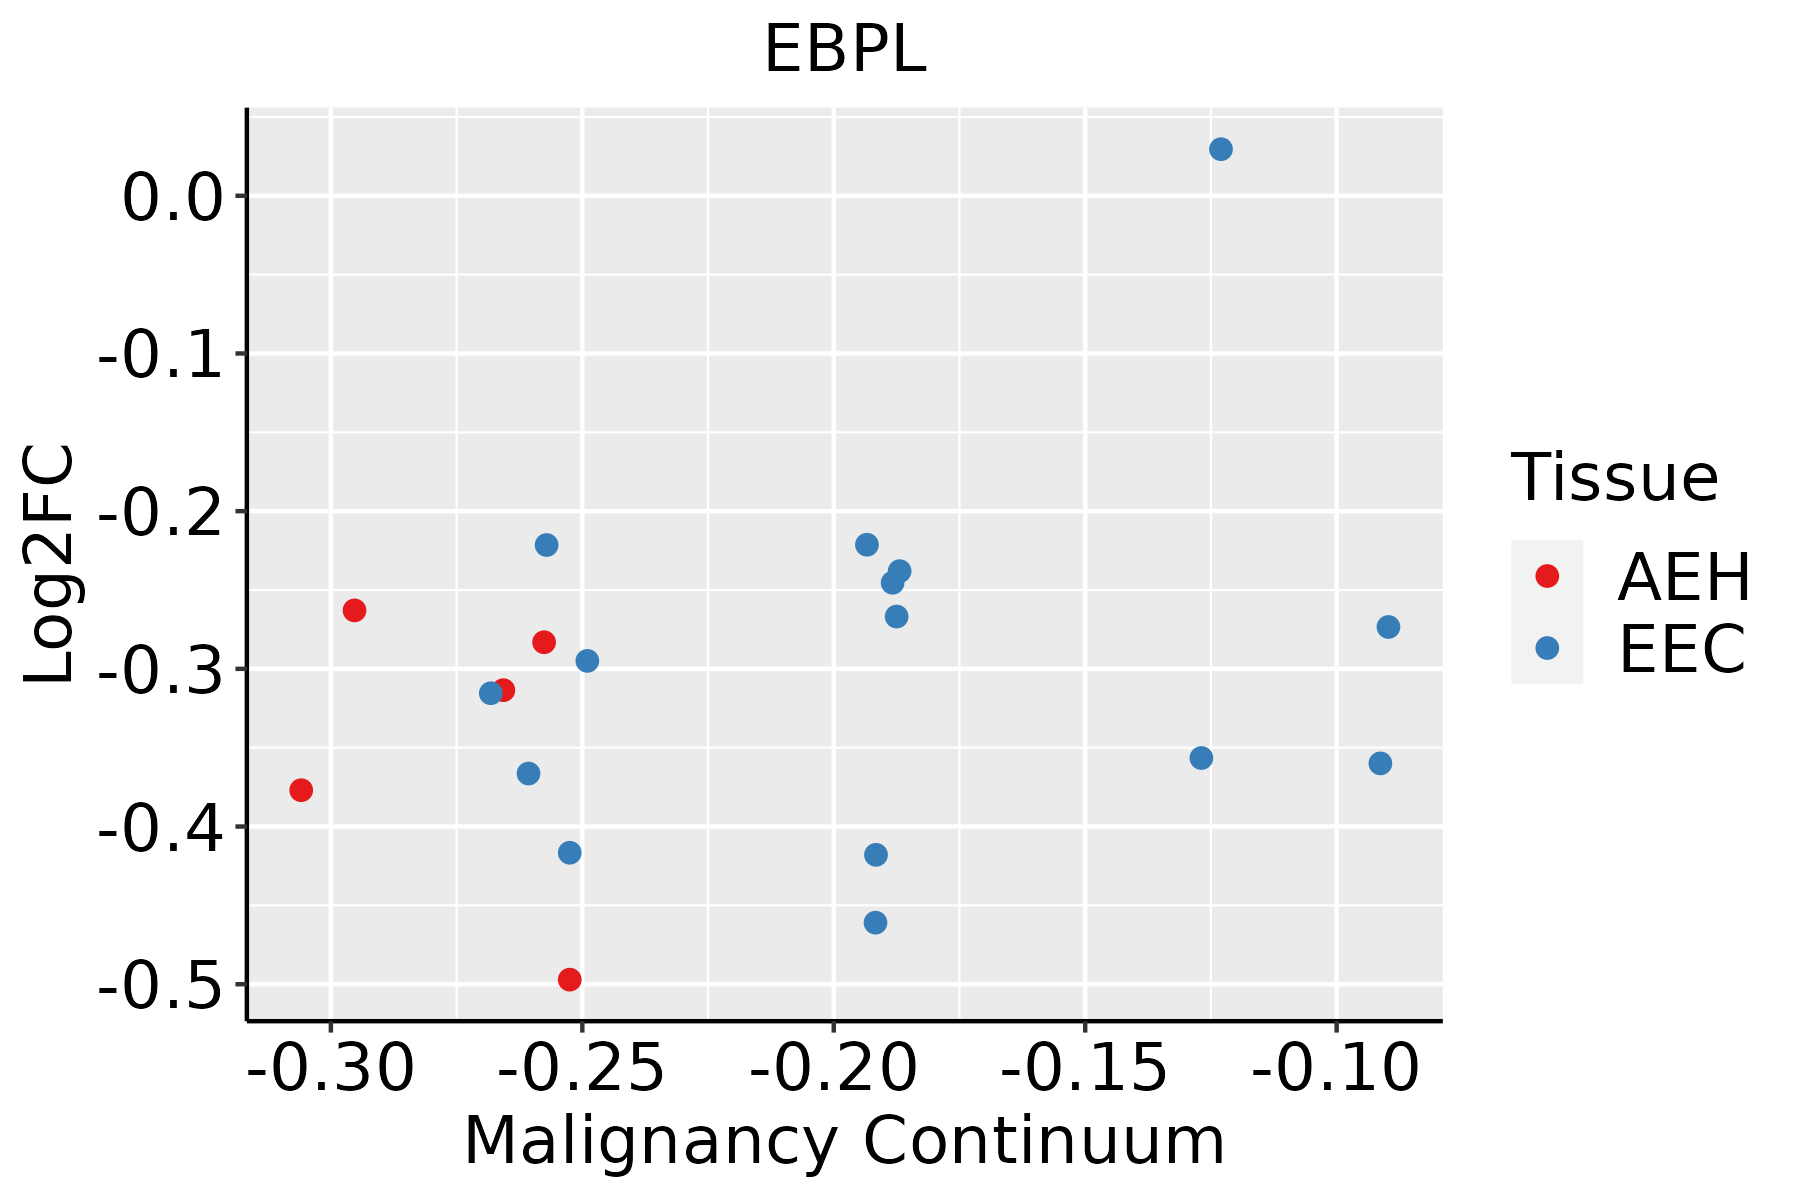 | AEH: Atypical endometrial hyperplasia |
| EEC: Endometrioid Cancer | ||
| Esophagus | 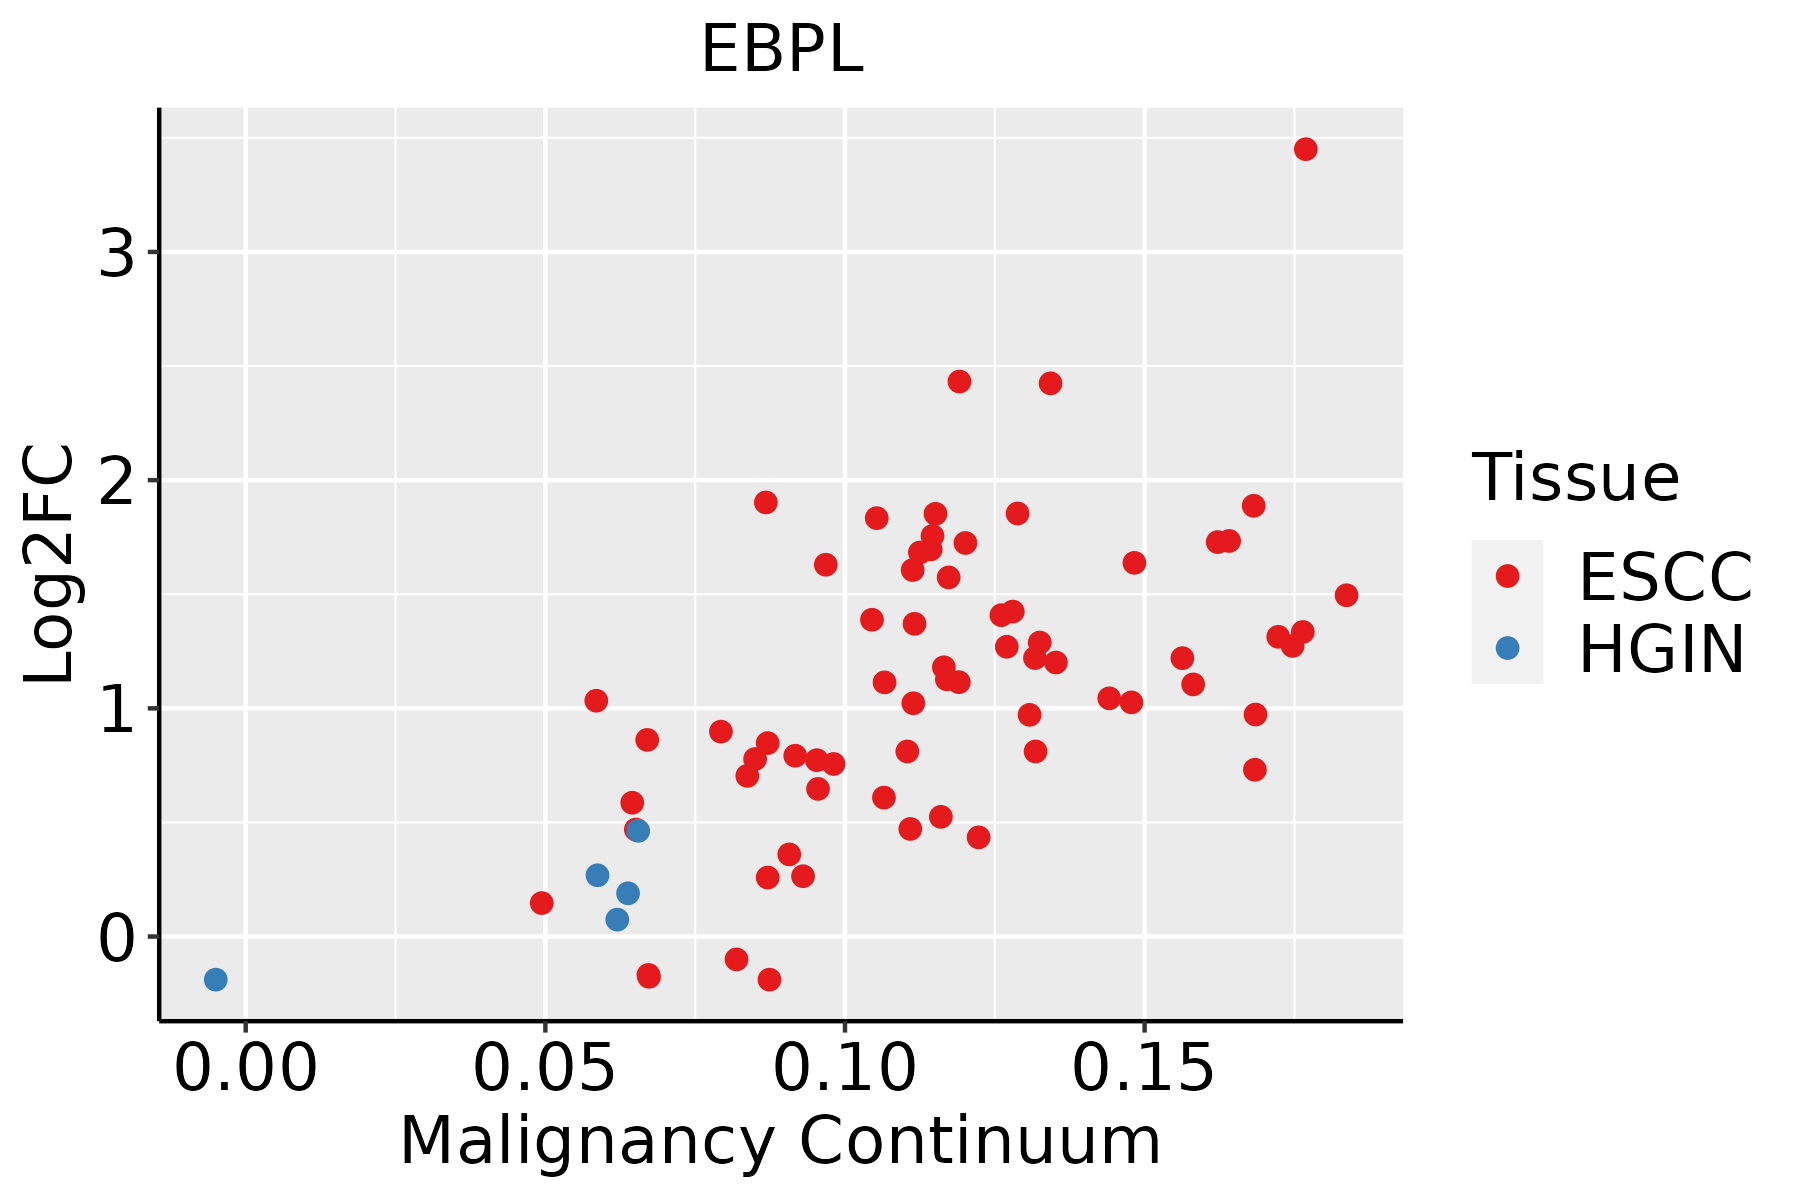 | ESCC: Esophageal squamous cell carcinoma |
| HGIN: High-grade intraepithelial neoplasias | ||
| LGIN: Low-grade intraepithelial neoplasias | ||
| Liver |  | HCC: Hepatocellular carcinoma |
| NAFLD: Non-alcoholic fatty liver disease | ||
| Oral Cavity | 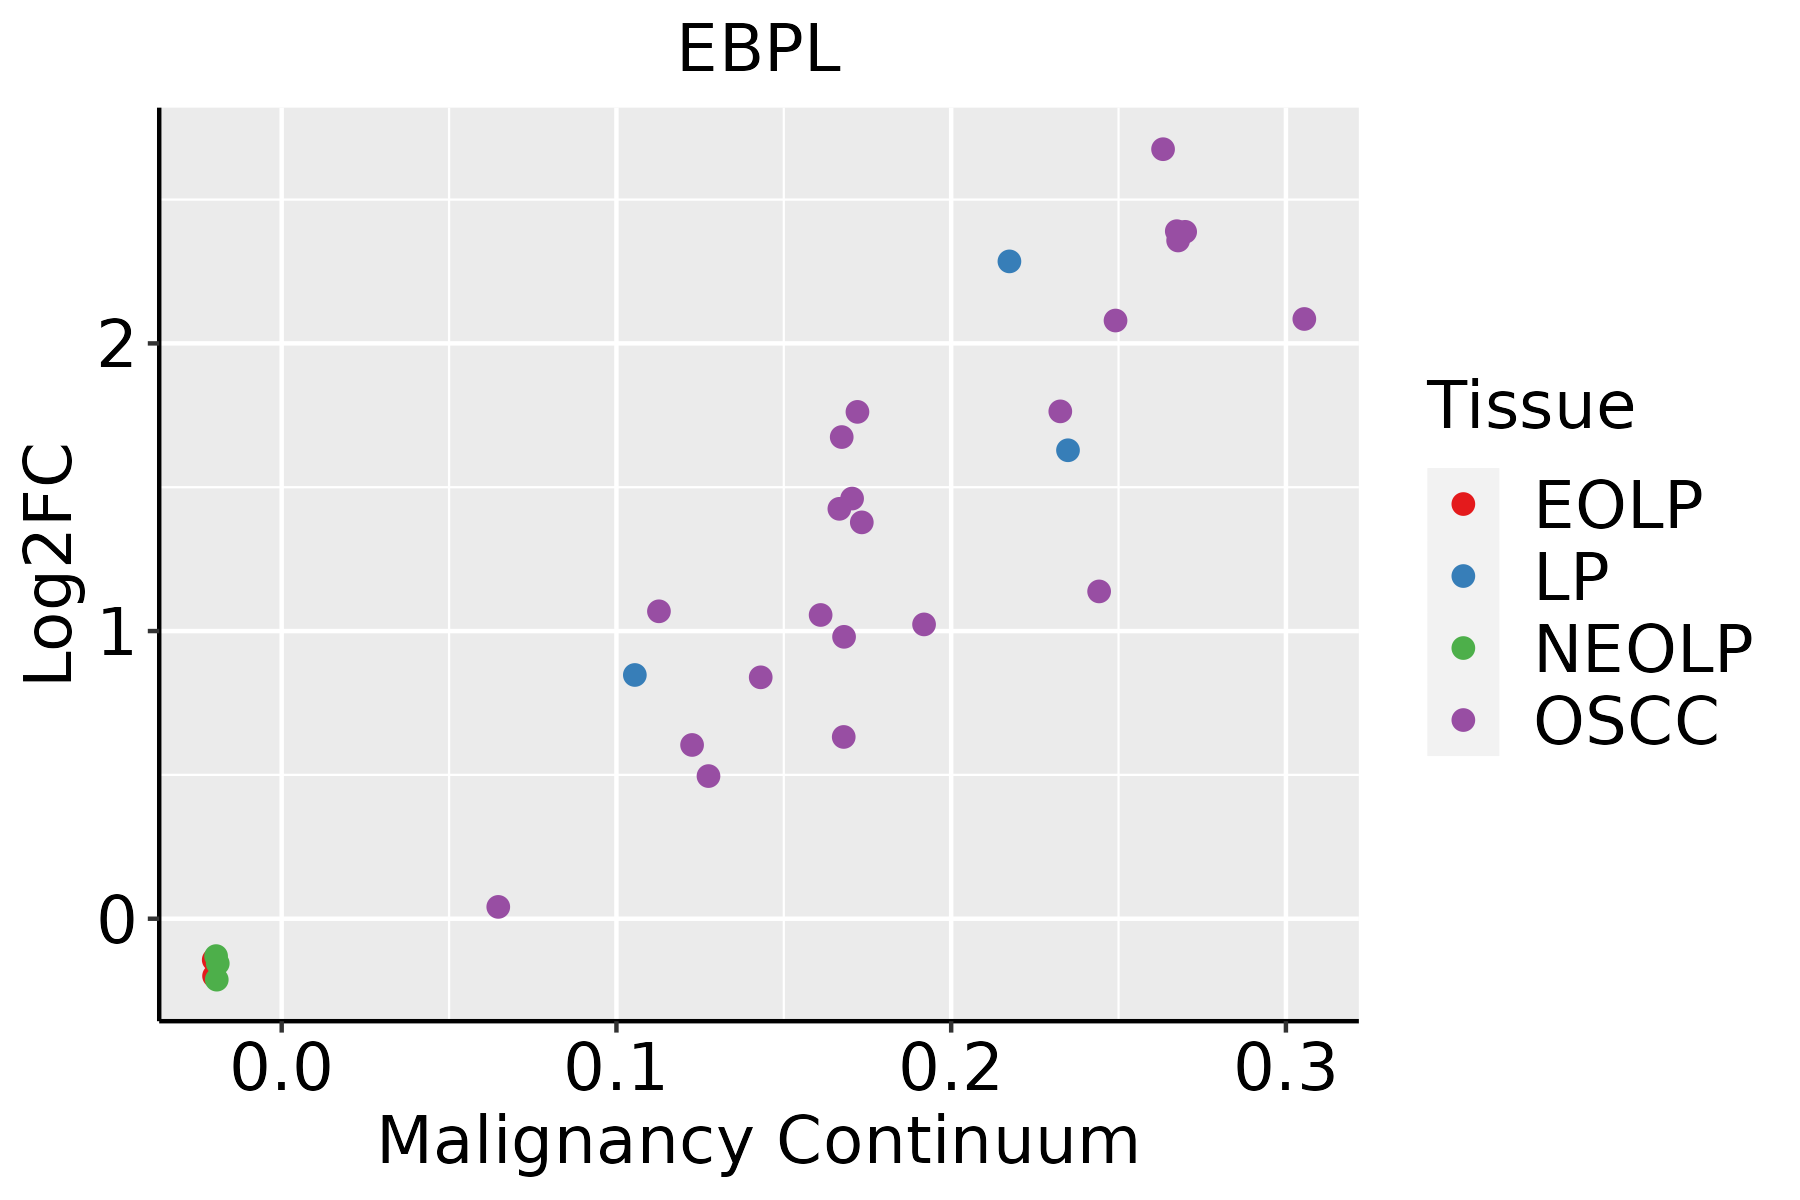 | EOLP: Erosive Oral lichen planus |
| LP: leukoplakia | ||
| NEOLP: Non-erosive oral lichen planus | ||
| OSCC: Oral squamous cell carcinoma | ||
| Prostate |  | BPH: Benign Prostatic Hyperplasia |
| Skin | 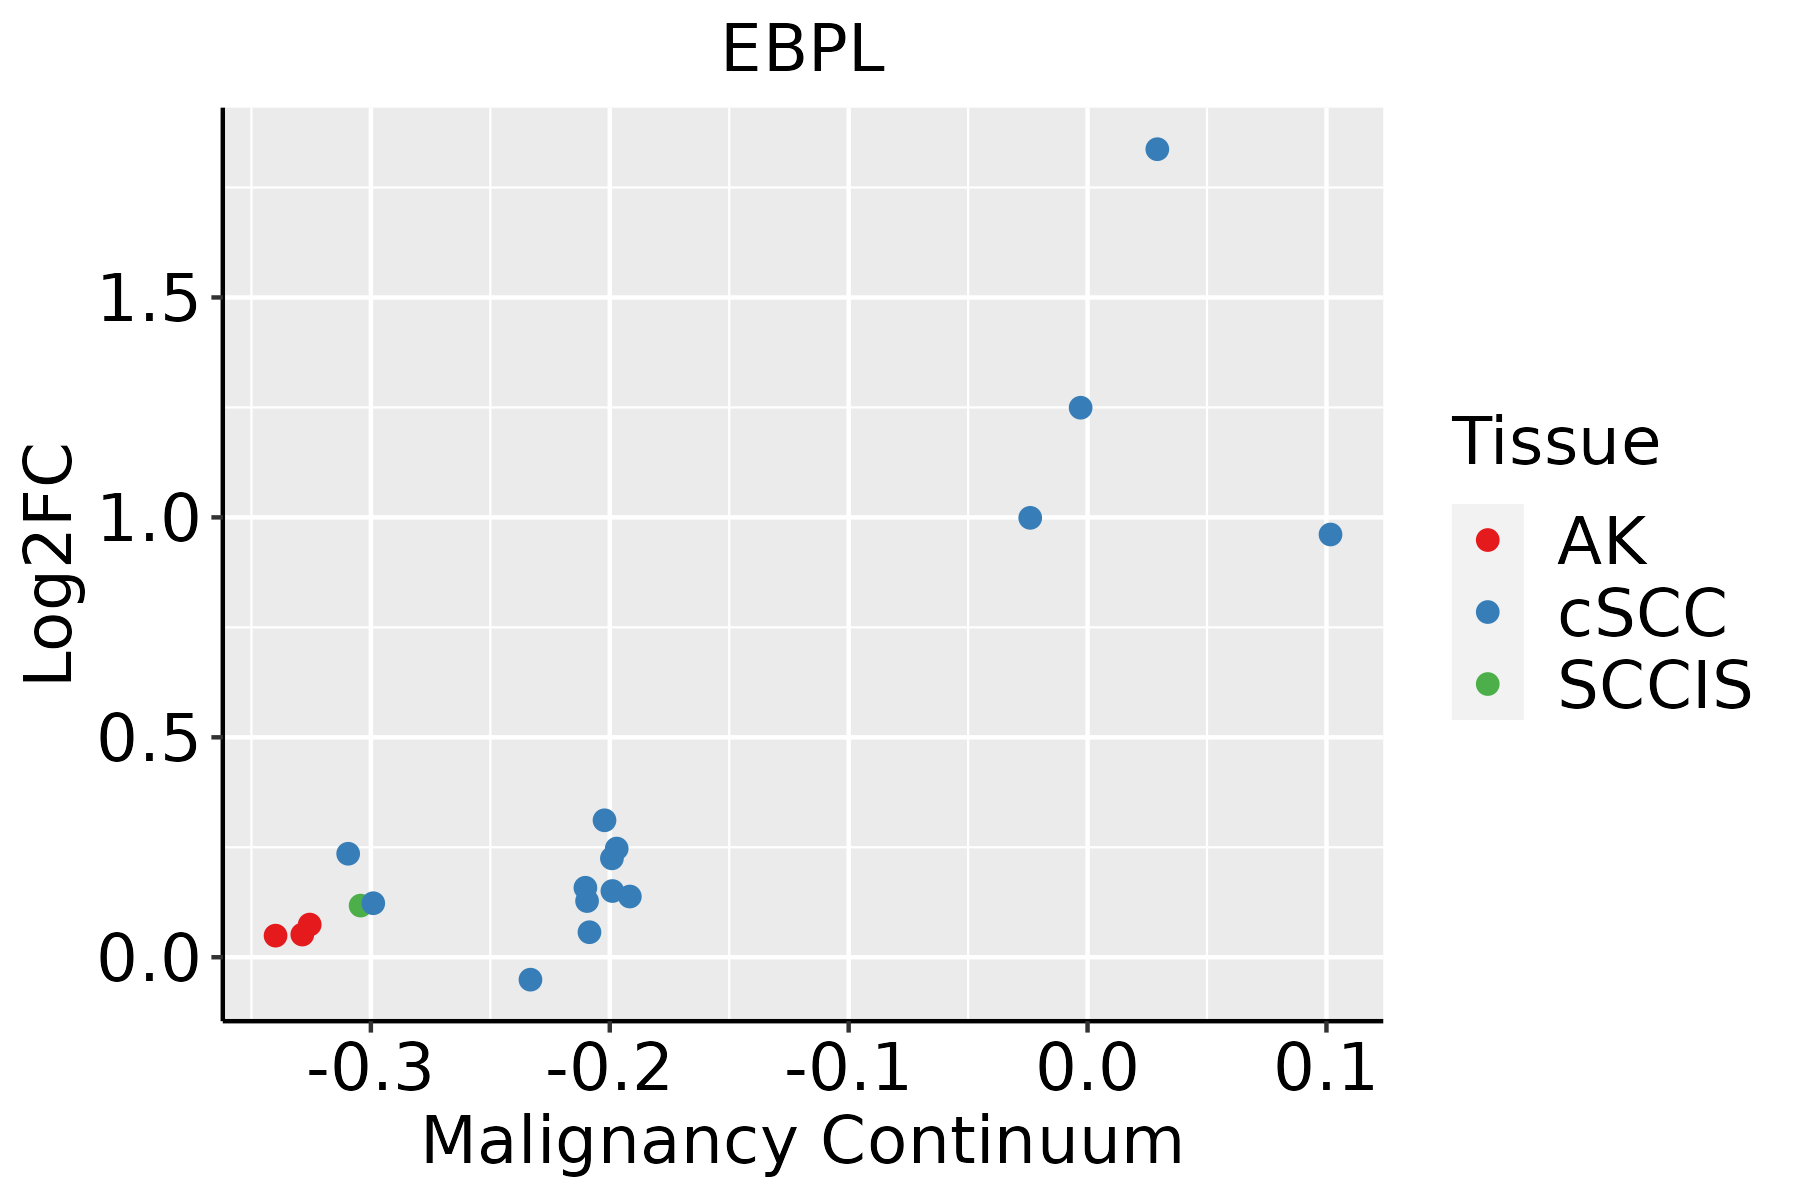 | AK: Actinic keratosis |
| cSCC: Cutaneous squamous cell carcinoma | ||
| SCCIS:squamous cell carcinoma in situ | ||
| Thyroid | 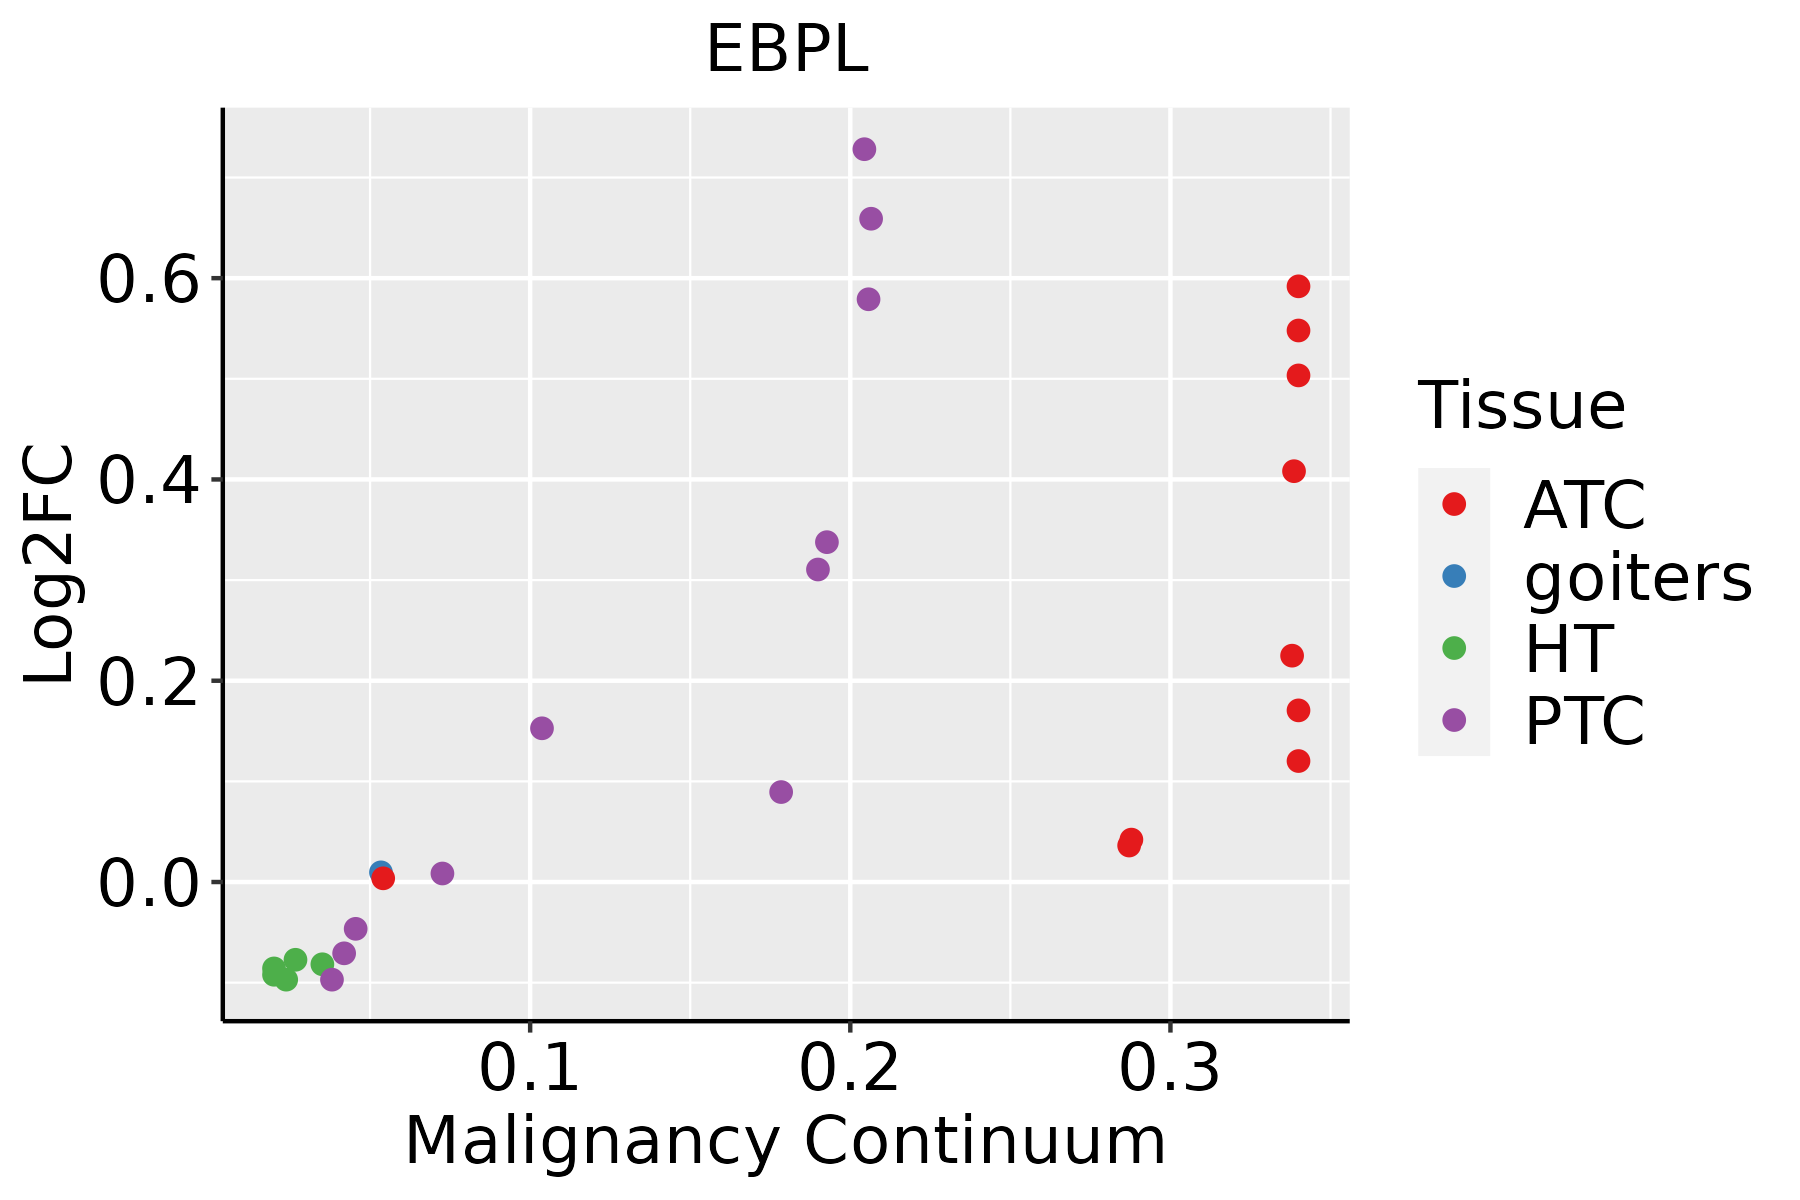 | ATC: Anaplastic thyroid cancer |
| HT: Hashimoto's thyroiditis | ||
| PTC: Papillary thyroid cancer |
| ∗log2FC in expression of this searched gene in stem-like cells from each diseased tissue sample relative to stem-like cells in normal samples in each tissue plotted against the malignancy continuum. Samples are colored based on if they are from different disease stage. |
Top |
Malignant transformation related pathway analysis |
| Find out the enriched GO biological processes and KEGG pathways involved in transition from healthy to precancer to cancer |
| Tissue | Disease Stage | Enriched GO biological Processes |
| Colorectum | AD |  |
| Colorectum | SER |  |
| Colorectum | MSS |  |
| Colorectum | MSI-H |  |
| Colorectum | FAP |  |
| ∗Top 15 enriched GO BP terms are showed in the bar plot of each disease state in each tissue. Each row represents a significant GO biological process which is colored according to the -log10(p.adjust). |
| Page: 1 2 3 4 5 6 7 8 9 |
| GO ID | Tissue | Disease Stage | Description | Gene Ratio | Bg Ratio | pvalue | p.adjust | Count |
| GO:0008202 | Colorectum | AD | steroid metabolic process | 85/3918 | 319/18723 | 8.07e-03 | 4.75e-02 | 85 |
| GO:00161254 | Esophagus | ESCC | sterol metabolic process | 86/8552 | 152/18723 | 4.37e-03 | 1.73e-02 | 86 |
| GO:000820211 | Liver | Cirrhotic | steroid metabolic process | 143/4634 | 319/18723 | 2.79e-15 | 3.18e-13 | 143 |
| GO:00161251 | Liver | Cirrhotic | sterol metabolic process | 75/4634 | 152/18723 | 4.54e-11 | 2.61e-09 | 75 |
| GO:00082022 | Liver | HCC | steroid metabolic process | 188/7958 | 319/18723 | 1.96e-09 | 5.63e-08 | 188 |
| GO:00161252 | Liver | HCC | sterol metabolic process | 101/7958 | 152/18723 | 1.99e-09 | 5.63e-08 | 101 |
| GO:00161253 | Oral cavity | OSCC | sterol metabolic process | 77/7305 | 152/18723 | 2.26e-03 | 1.00e-02 | 77 |
| GO:00082024 | Oral cavity | OSCC | steroid metabolic process | 146/7305 | 319/18723 | 7.78e-03 | 2.85e-02 | 146 |
| GO:001612511 | Oral cavity | LP | sterol metabolic process | 51/4623 | 152/18723 | 8.57e-03 | 4.63e-02 | 51 |
| Page: 1 |
| Pathway ID | Tissue | Disease Stage | Description | Gene Ratio | Bg Ratio | pvalue | p.adjust | qvalue | Count |
| Page: 1 |
Top |
Cell-cell communication analysis |
| Identification of potential cell-cell interactions between two cell types and their ligand-receptor pairs for different disease states |
| Ligand | Receptor | LRpair | Pathway | Tissue | Disease Stage |
| Page: 1 |
Top |
Single-cell gene regulatory network inference analysis |
| Find out the significant the regulons (TFs) and the target genes of each regulon across cell types for different disease states |
| TF | Cell Type | Tissue | Disease Stage | Target Gene | RSS | Regulon Activity |
| ∗The dot plots of a searched regulon are shown for all cell subpopulations in each disease state of each tissue based on the regulon specific score inferred using pySCENIC and by calculating the average expression. |
| Page: 1 |
Top |
Somatic mutation of malignant transformation related genes |
| Annotation of somatic variants for genes involved in malignant transformation |
| Hugo Symbol | Variant Class | Variant Classification | dbSNP RS | HGVSc | HGVSp | HGVSp Short | SWISSPROT | BIOTYPE | SIFT | PolyPhen | Tumor Sample Barcode | Tissue | Histology | Sex | Age | Stage | Therapy Types | Drugs | Outcome |
| EBPL | SNV | Missense_Mutation | novel | c.589N>G | p.Lys197Glu | p.K197E | Q9BY08 | protein_coding | tolerated(0.35) | benign(0.021) | TCGA-B6-A40B-01 | Breast | breast invasive carcinoma | Female | >=65 | I/II | Unknown | Unknown | SD |
| EBPL | deletion | Frame_Shift_Del | rs765134934 | c.516delT | p.Phe172LeufsTer7 | p.F172Lfs*7 | Q9BY08 | protein_coding | TCGA-AN-A0AK-01 | Breast | breast invasive carcinoma | Female | >=65 | I/II | Unknown | Unknown | SD | ||
| EBPL | insertion | Nonsense_Mutation | novel | c.279_280insCCCAGGAGTTTGAGACCAGCCTAGGCAATACAA | p.Tyr93_Phe94insProArgSerLeuArgProAlaTerAlaIleGln | p.Y93_F94insPRSLRPA*AIQ | Q9BY08 | protein_coding | TCGA-B6-A0IN-01 | Breast | breast invasive carcinoma | Female | <65 | I/II | Unknown | Unknown | PD | ||
| EBPL | deletion | Frame_Shift_Del | rs765134934 | c.516delN | p.Phe172LeufsTer7 | p.F172Lfs*7 | Q9BY08 | protein_coding | TCGA-EA-A3HU-01 | Cervix | cervical & endocervical cancer | Female | <65 | I/II | Unknown | Unknown | SD | ||
| EBPL | SNV | Missense_Mutation | novel | c.479G>A | p.Ser160Asn | p.S160N | Q9BY08 | protein_coding | tolerated(0.26) | benign(0.028) | TCGA-AD-6889-01 | Colorectum | colon adenocarcinoma | Male | >=65 | I/II | Chemotherapy | xeloda | PD |
| EBPL | SNV | Missense_Mutation | rs200901347 | c.520G>A | p.Gly174Ser | p.G174S | Q9BY08 | protein_coding | tolerated(0.28) | possibly_damaging(0.796) | TCGA-CM-6168-01 | Colorectum | colon adenocarcinoma | Female | >=65 | I/II | Unknown | Unknown | SD |
| EBPL | SNV | Missense_Mutation | c.421N>A | p.Gly141Ser | p.G141S | Q9BY08 | protein_coding | deleterious(0.03) | possibly_damaging(0.899) | TCGA-AG-4021-01 | Colorectum | rectum adenocarcinoma | Female | >=65 | III/IV | Unknown | Unknown | PD | |
| EBPL | SNV | Missense_Mutation | novel | c.557N>C | p.Gln186Pro | p.Q186P | Q9BY08 | protein_coding | deleterious(0.01) | probably_damaging(0.985) | TCGA-AJ-A3BH-01 | Endometrium | uterine corpus endometrioid carcinoma | Female | Unknown | I/II | Unknown | Unknown | SD |
| EBPL | SNV | Missense_Mutation | novel | c.483N>A | p.Asn161Lys | p.N161K | Q9BY08 | protein_coding | deleterious(0) | possibly_damaging(0.726) | TCGA-AX-A06F-01 | Endometrium | uterine corpus endometrioid carcinoma | Female | <65 | III/IV | Chemotherapy | carboplatin | SD |
| EBPL | SNV | Missense_Mutation | rs754650479 | c.412N>A | p.Glu138Lys | p.E138K | Q9BY08 | protein_coding | deleterious(0) | probably_damaging(0.999) | TCGA-D1-A103-01 | Endometrium | uterine corpus endometrioid carcinoma | Female | >=65 | I/II | Unknown | Unknown | SD |
| Page: 1 2 3 4 |
Top |
Related drugs of malignant transformation related genes |
| Identification of chemicals and drugs interact with genes involved in malignant transfromation |
| (DGIdb 4.0) |
| Entrez ID | Symbol | Category | Interaction Types | Drug Claim Name | Drug Name | PMIDs |
| Page: 1 |

Copyright 2023-Present -The University of Texas Health Science Center at Houston |