
|
|||||
|
 | |
| |
| |
| |
| |
| |
|
Gene: EBNA1BP2 |
Gene summary for EBNA1BP2 |
| Gene information | Species | Human | Gene symbol | EBNA1BP2 | Gene ID | 10969 |
| Gene name | EBNA1 binding protein 2 | |
| Gene Alias | EBP2 | |
| Cytomap | 1p34.2 | |
| Gene Type | protein-coding | GO ID | GO:0006139 | UniProtAcc | H7C2Q8 |
Top |
Malignant transformation analysis |
| Identification of the aberrant gene expression in precancerous and cancerous lesions by comparing the gene expression of stem-like cells in diseased tissues with normal stem cells |
| Entrez ID | Symbol | Replicates | Species | Organ | Tissue | Adj P-value | Log2FC | Malignancy |
| 10969 | EBNA1BP2 | GSM4909281 | Human | Breast | IDC | 1.70e-04 | 3.05e-01 | 0.21 |
| 10969 | EBNA1BP2 | GSM4909285 | Human | Breast | IDC | 4.15e-08 | 3.63e-01 | 0.21 |
| 10969 | EBNA1BP2 | GSM4909286 | Human | Breast | IDC | 1.92e-04 | 1.97e-01 | 0.1081 |
| 10969 | EBNA1BP2 | GSM4909296 | Human | Breast | IDC | 1.22e-06 | 7.03e-02 | 0.1524 |
| 10969 | EBNA1BP2 | GSM4909297 | Human | Breast | IDC | 4.34e-04 | -7.39e-03 | 0.1517 |
| 10969 | EBNA1BP2 | GSM4909311 | Human | Breast | IDC | 3.20e-14 | -4.76e-02 | 0.1534 |
| 10969 | EBNA1BP2 | GSM4909312 | Human | Breast | IDC | 2.17e-09 | 1.75e-01 | 0.1552 |
| 10969 | EBNA1BP2 | GSM4909319 | Human | Breast | IDC | 1.46e-21 | -9.22e-02 | 0.1563 |
| 10969 | EBNA1BP2 | GSM4909321 | Human | Breast | IDC | 9.47e-09 | 1.03e-01 | 0.1559 |
| 10969 | EBNA1BP2 | brca1 | Human | Breast | Precancer | 4.70e-19 | 6.41e-01 | -0.0338 |
| 10969 | EBNA1BP2 | brca2 | Human | Breast | Precancer | 1.35e-09 | 3.42e-01 | -0.024 |
| 10969 | EBNA1BP2 | brca3 | Human | Breast | Precancer | 1.35e-02 | 2.61e-01 | -0.0263 |
| 10969 | EBNA1BP2 | NCCBC5 | Human | Breast | DCIS | 6.66e-14 | 4.77e-01 | 0.2046 |
| 10969 | EBNA1BP2 | P1 | Human | Breast | IDC | 1.89e-05 | -2.37e-01 | 0.1527 |
| 10969 | EBNA1BP2 | DCIS2 | Human | Breast | DCIS | 1.09e-66 | 2.97e-01 | 0.0085 |
| 10969 | EBNA1BP2 | LZE2T | Human | Esophagus | ESCC | 1.18e-02 | 8.84e-01 | 0.082 |
| 10969 | EBNA1BP2 | LZE4T | Human | Esophagus | ESCC | 5.76e-12 | 2.27e-01 | 0.0811 |
| 10969 | EBNA1BP2 | LZE5T | Human | Esophagus | ESCC | 3.11e-03 | 1.93e-01 | 0.0514 |
| 10969 | EBNA1BP2 | LZE7T | Human | Esophagus | ESCC | 7.12e-06 | 7.21e-01 | 0.0667 |
| 10969 | EBNA1BP2 | LZE8T | Human | Esophagus | ESCC | 2.19e-08 | 3.21e-01 | 0.067 |
| Page: 1 2 3 4 5 6 7 8 |
| Tissue | Expression Dynamics | Abbreviation |
| Breast |  | IDC: Invasive ductal carcinoma |
| DCIS: Ductal carcinoma in situ | ||
| Precancer(BRCA1-mut): Precancerous lesion from BRCA1 mutation carriers | ||
| Esophagus | 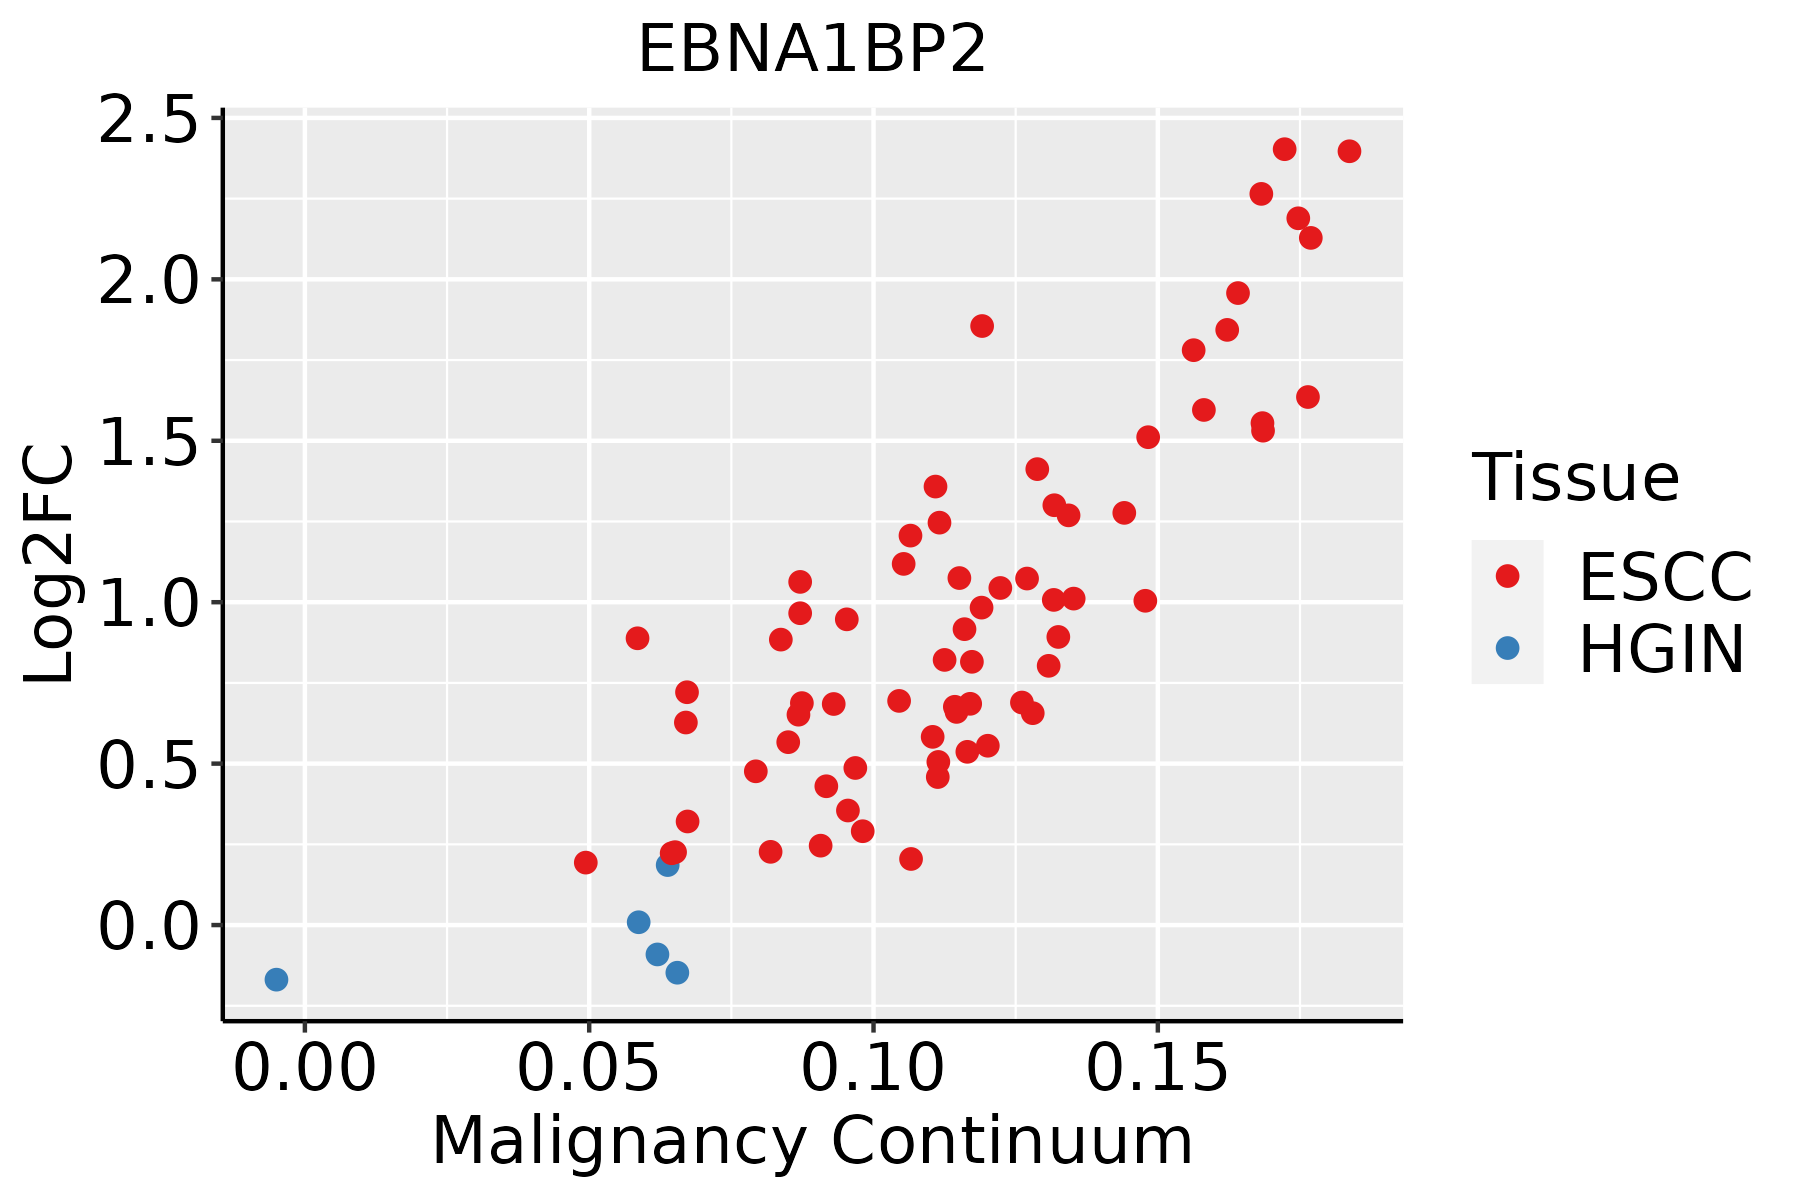 | ESCC: Esophageal squamous cell carcinoma |
| HGIN: High-grade intraepithelial neoplasias | ||
| LGIN: Low-grade intraepithelial neoplasias | ||
| Liver |  | HCC: Hepatocellular carcinoma |
| NAFLD: Non-alcoholic fatty liver disease | ||
| Oral Cavity | 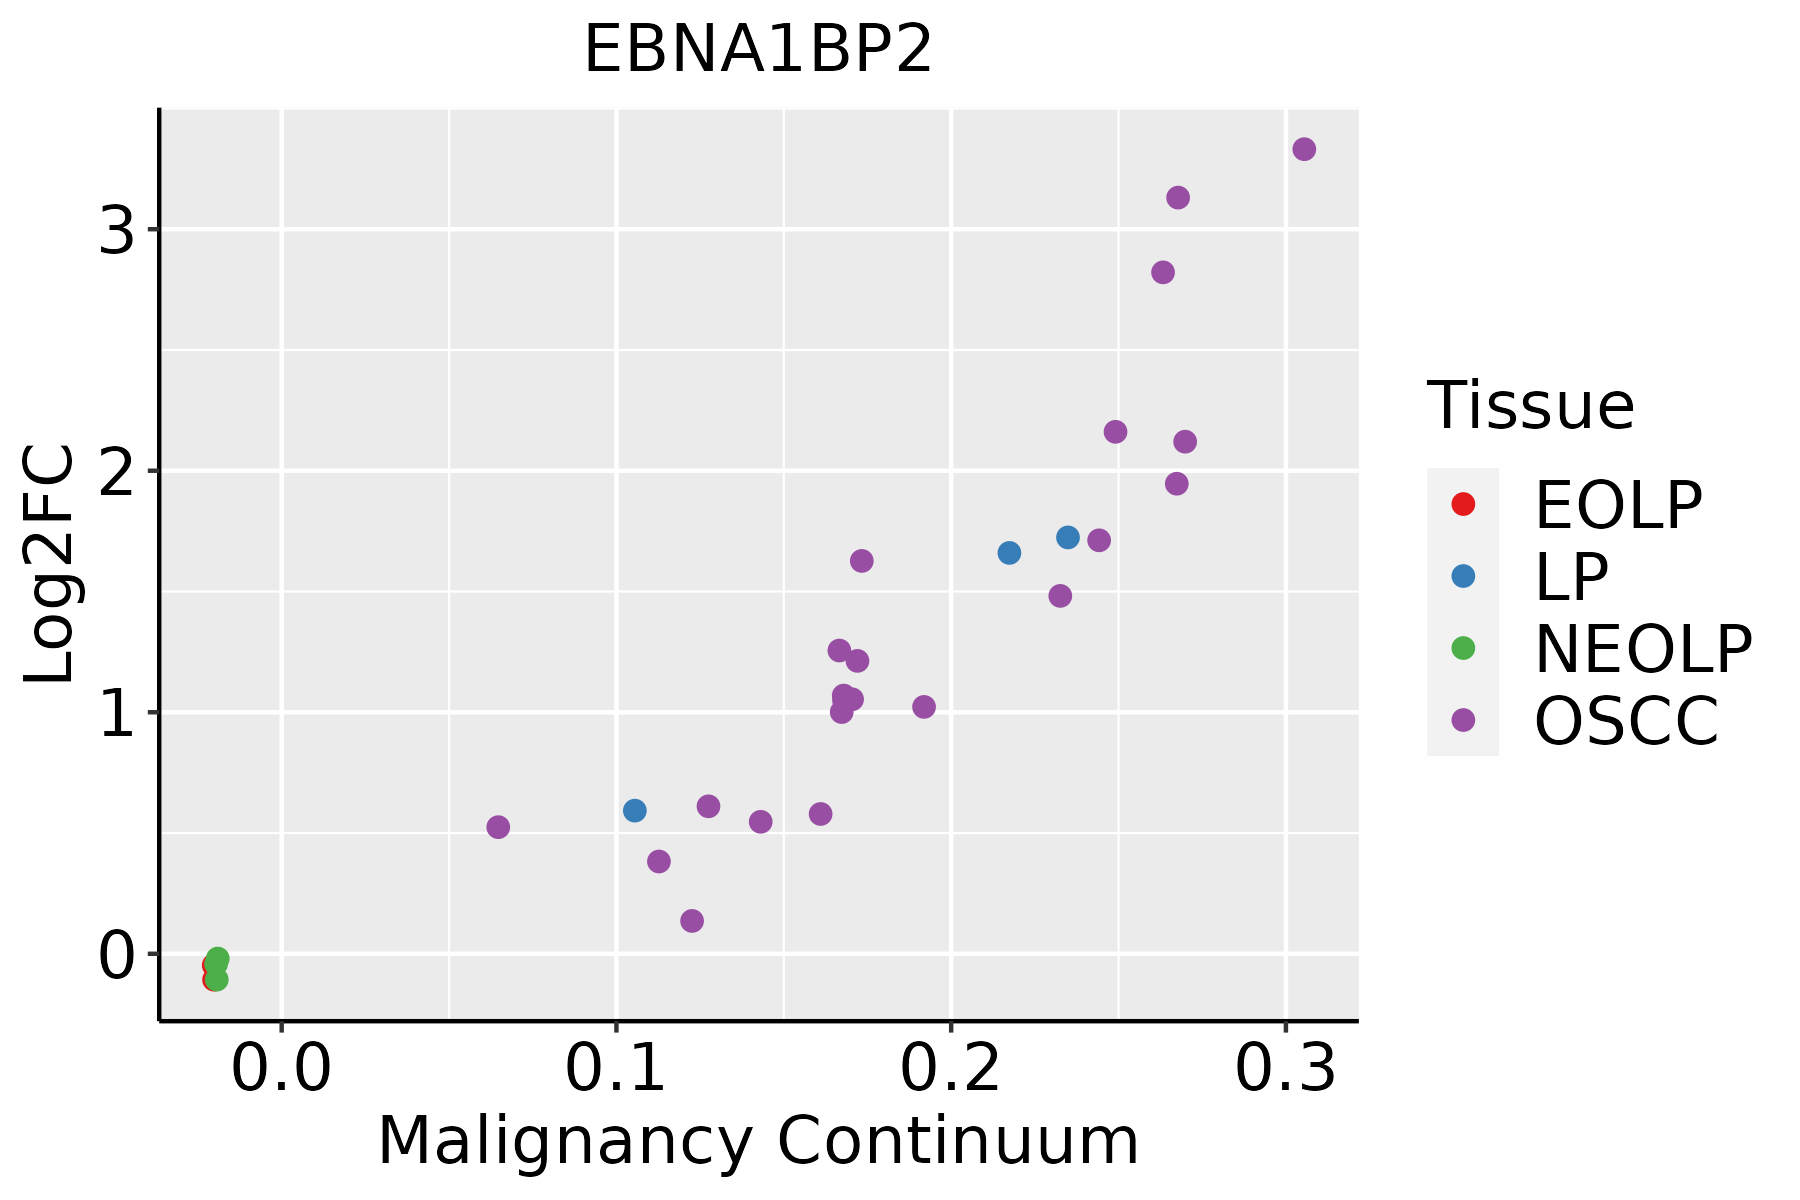 | EOLP: Erosive Oral lichen planus |
| LP: leukoplakia | ||
| NEOLP: Non-erosive oral lichen planus | ||
| OSCC: Oral squamous cell carcinoma | ||
| Skin |  | AK: Actinic keratosis |
| cSCC: Cutaneous squamous cell carcinoma | ||
| SCCIS:squamous cell carcinoma in situ | ||
| Thyroid | 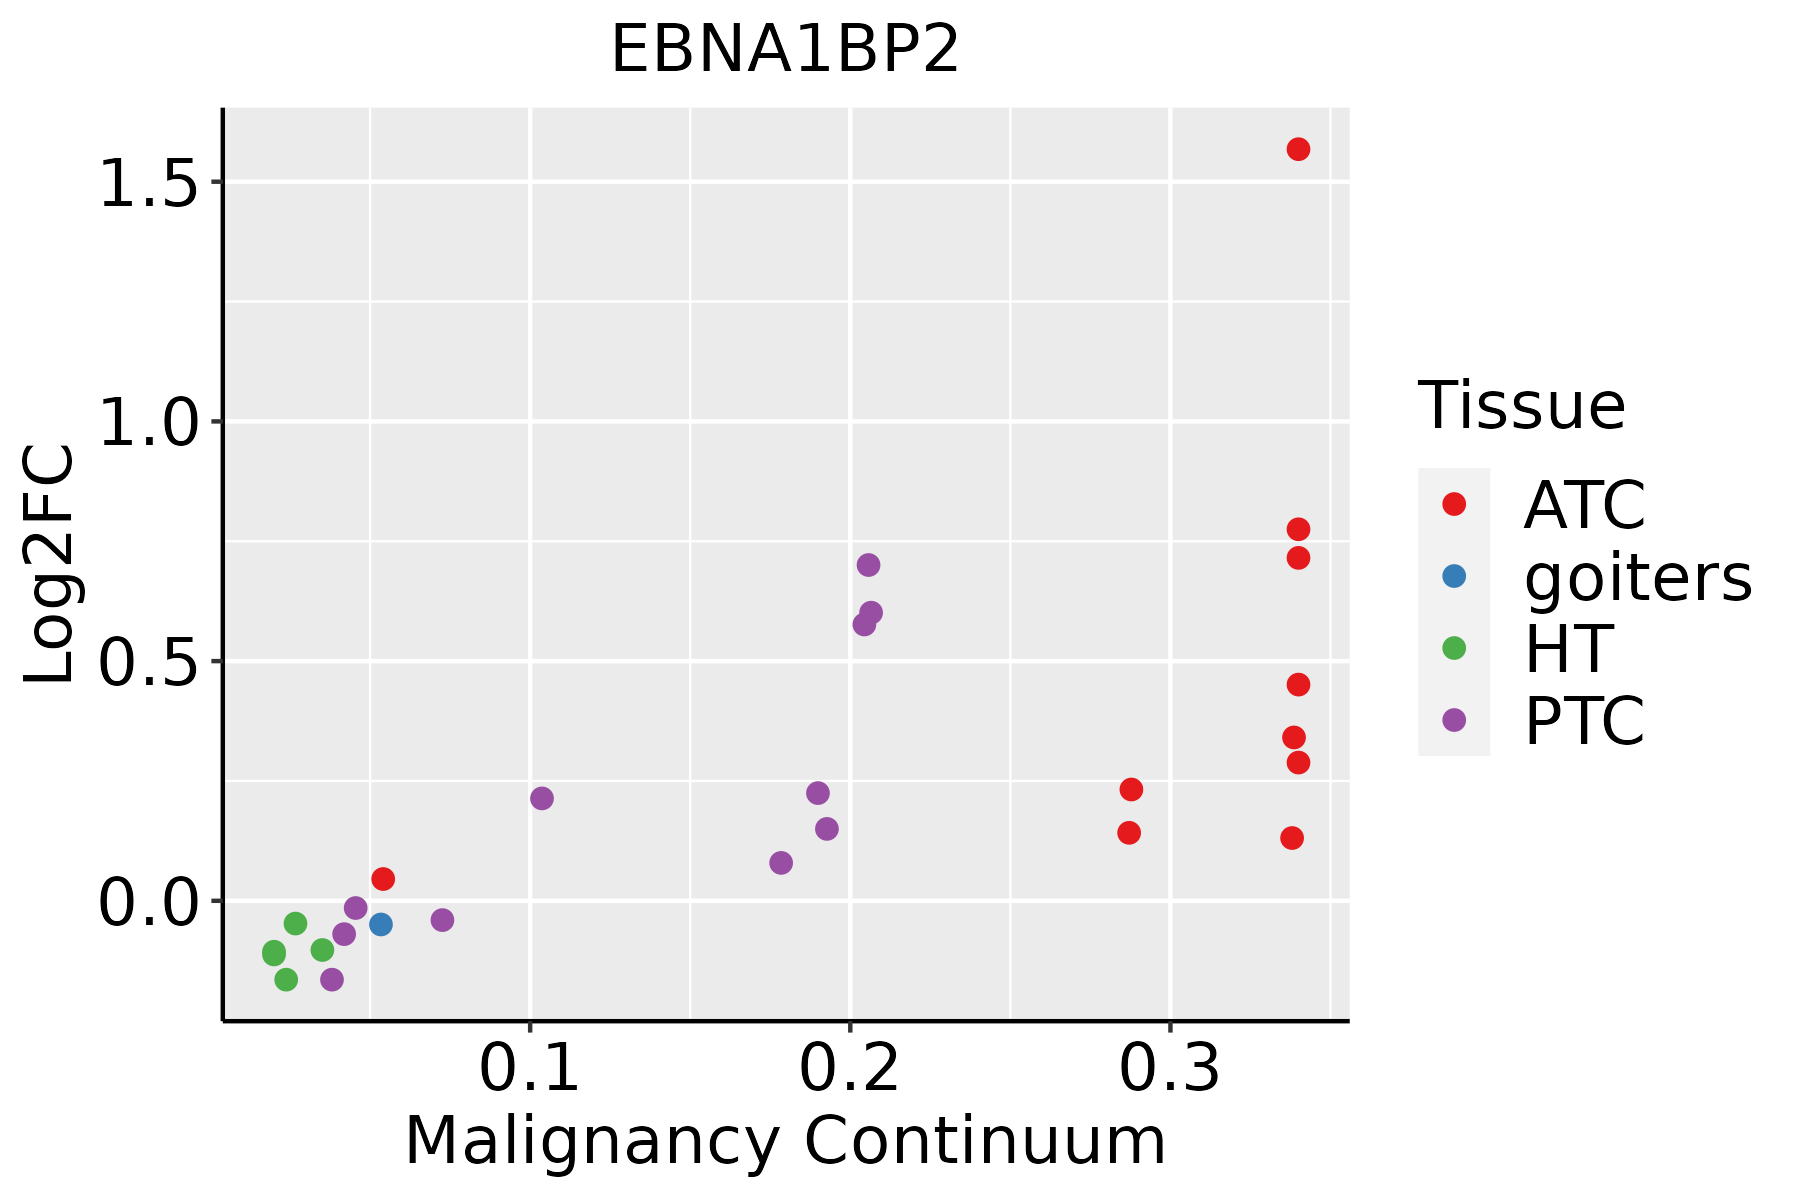 | ATC: Anaplastic thyroid cancer |
| HT: Hashimoto's thyroiditis | ||
| PTC: Papillary thyroid cancer |
| ∗log2FC in expression of this searched gene in stem-like cells from each diseased tissue sample relative to stem-like cells in normal samples in each tissue plotted against the malignancy continuum. Samples are colored based on if they are from different disease stage. |
Top |
Malignant transformation related pathway analysis |
| Find out the enriched GO biological processes and KEGG pathways involved in transition from healthy to precancer to cancer |
| Tissue | Disease Stage | Enriched GO biological Processes |
| Colorectum | AD |  |
| Colorectum | SER |  |
| Colorectum | MSS |  |
| Colorectum | MSI-H |  |
| Colorectum | FAP |  |
| ∗Top 15 enriched GO BP terms are showed in the bar plot of each disease state in each tissue. Each row represents a significant GO biological process which is colored according to the -log10(p.adjust). |
| Page: 1 2 3 4 5 6 7 8 9 |
| GO ID | Tissue | Disease Stage | Description | Gene Ratio | Bg Ratio | pvalue | p.adjust | Count |
| GO:00226139 | Breast | Precancer | ribonucleoprotein complex biogenesis | 79/1080 | 463/18723 | 2.11e-18 | 1.03e-15 | 79 |
| GO:00422549 | Breast | Precancer | ribosome biogenesis | 52/1080 | 299/18723 | 7.35e-13 | 1.51e-10 | 52 |
| GO:00422739 | Breast | Precancer | ribosomal large subunit biogenesis | 22/1080 | 72/18723 | 5.03e-11 | 5.61e-09 | 22 |
| GO:00063646 | Breast | Precancer | rRNA processing | 35/1080 | 225/18723 | 7.90e-08 | 4.60e-06 | 35 |
| GO:00160726 | Breast | Precancer | rRNA metabolic process | 36/1080 | 236/18723 | 8.59e-08 | 4.84e-06 | 36 |
| GO:00344705 | Breast | Precancer | ncRNA processing | 42/1080 | 395/18723 | 9.91e-05 | 1.83e-03 | 42 |
| GO:00346604 | Breast | Precancer | ncRNA metabolic process | 45/1080 | 485/18723 | 1.15e-03 | 1.26e-02 | 45 |
| GO:002261314 | Breast | IDC | ribonucleoprotein complex biogenesis | 83/1434 | 463/18723 | 2.01e-13 | 5.20e-11 | 83 |
| GO:004227314 | Breast | IDC | ribosomal large subunit biogenesis | 22/1434 | 72/18723 | 1.04e-08 | 7.67e-07 | 22 |
| GO:004225414 | Breast | IDC | ribosome biogenesis | 52/1434 | 299/18723 | 1.90e-08 | 1.32e-06 | 52 |
| GO:000636414 | Breast | IDC | rRNA processing | 35/1434 | 225/18723 | 4.59e-05 | 1.03e-03 | 35 |
| GO:001607214 | Breast | IDC | rRNA metabolic process | 36/1434 | 236/18723 | 5.48e-05 | 1.17e-03 | 36 |
| GO:002261324 | Breast | DCIS | ribonucleoprotein complex biogenesis | 83/1390 | 463/18723 | 3.65e-14 | 1.09e-11 | 83 |
| GO:004227324 | Breast | DCIS | ribosomal large subunit biogenesis | 22/1390 | 72/18723 | 5.88e-09 | 4.82e-07 | 22 |
| GO:004225423 | Breast | DCIS | ribosome biogenesis | 52/1390 | 299/18723 | 6.73e-09 | 5.44e-07 | 52 |
| GO:000636422 | Breast | DCIS | rRNA processing | 35/1390 | 225/18723 | 2.41e-05 | 5.62e-04 | 35 |
| GO:001607222 | Breast | DCIS | rRNA metabolic process | 36/1390 | 236/18723 | 2.86e-05 | 6.42e-04 | 36 |
| GO:003447011 | Breast | DCIS | ncRNA processing | 44/1390 | 395/18723 | 4.56e-03 | 3.49e-02 | 44 |
| GO:002261327 | Esophagus | HGIN | ribonucleoprotein complex biogenesis | 158/2587 | 463/18723 | 2.61e-29 | 5.23e-26 | 158 |
| GO:004225426 | Esophagus | HGIN | ribosome biogenesis | 101/2587 | 299/18723 | 8.74e-19 | 4.03e-16 | 101 |
| Page: 1 2 3 4 5 |
| Pathway ID | Tissue | Disease Stage | Description | Gene Ratio | Bg Ratio | pvalue | p.adjust | qvalue | Count |
| Page: 1 |
Top |
Cell-cell communication analysis |
| Identification of potential cell-cell interactions between two cell types and their ligand-receptor pairs for different disease states |
| Ligand | Receptor | LRpair | Pathway | Tissue | Disease Stage |
| Page: 1 |
Top |
Single-cell gene regulatory network inference analysis |
| Find out the significant the regulons (TFs) and the target genes of each regulon across cell types for different disease states |
| TF | Cell Type | Tissue | Disease Stage | Target Gene | RSS | Regulon Activity |
| ∗The dot plots of a searched regulon are shown for all cell subpopulations in each disease state of each tissue based on the regulon specific score inferred using pySCENIC and by calculating the average expression. |
| Page: 1 |
Top |
Somatic mutation of malignant transformation related genes |
| Annotation of somatic variants for genes involved in malignant transformation |
| Hugo Symbol | Variant Class | Variant Classification | dbSNP RS | HGVSc | HGVSp | HGVSp Short | SWISSPROT | BIOTYPE | SIFT | PolyPhen | Tumor Sample Barcode | Tissue | Histology | Sex | Age | Stage | Therapy Types | Drugs | Outcome |
| EBNA1BP2 | SNV | Missense_Mutation | novel | c.161N>C | p.Gly54Ala | p.G54A | protein_coding | tolerated_low_confidence(0.14) | benign(0.001) | TCGA-A7-A6VW-01 | Breast | breast invasive carcinoma | Female | <65 | I/II | Chemotherapy | doxorubicin | CR | |
| EBNA1BP2 | SNV | Missense_Mutation | c.1038G>T | p.Lys346Asn | p.K346N | protein_coding | deleterious(0) | possibly_damaging(0.614) | TCGA-2W-A8YY-01 | Cervix | cervical & endocervical cancer | Female | <65 | I/II | Chemotherapy | cisplatin | CR | ||
| EBNA1BP2 | SNV | Missense_Mutation | novel | c.1037N>G | p.Lys346Arg | p.K346R | protein_coding | tolerated(0.08) | possibly_damaging(0.614) | TCGA-AA-3852-01 | Colorectum | colon adenocarcinoma | Male | >=65 | I/II | Unknown | Unknown | PD | |
| EBNA1BP2 | SNV | Missense_Mutation | novel | c.428N>A | p.Pro143His | p.P143H | protein_coding | deleterious(0.05) | benign(0.014) | TCGA-AA-3950-01 | Colorectum | colon adenocarcinoma | Female | >=65 | I/II | Unknown | Unknown | SD | |
| EBNA1BP2 | SNV | Missense_Mutation | rs535649425 | c.530N>A | p.Arg177His | p.R177H | protein_coding | deleterious(0.04) | benign(0.071) | TCGA-AA-A010-01 | Colorectum | colon adenocarcinoma | Female | <65 | I/II | Chemotherapy | folinic | CR | |
| EBNA1BP2 | SNV | Missense_Mutation | c.22G>A | p.Val8Ile | p.V8I | protein_coding | benign(0.001) | TCGA-AZ-4615-01 | Colorectum | colon adenocarcinoma | Male | >=65 | III/IV | Chemotherapy | xeloda | PD | |||
| EBNA1BP2 | SNV | Missense_Mutation | c.445N>C | p.Lys149Gln | p.K149Q | protein_coding | tolerated(0.3) | benign(0.185) | TCGA-CK-6746-01 | Colorectum | colon adenocarcinoma | Female | >=65 | I/II | Unknown | Unknown | SD | ||
| EBNA1BP2 | SNV | Missense_Mutation | c.97T>C | p.Phe33Leu | p.F33L | protein_coding | benign(0) | TCGA-CM-5861-01 | Colorectum | colon adenocarcinoma | Female | <65 | I/II | Unknown | Unknown | PD | |||
| EBNA1BP2 | SNV | Missense_Mutation | novel | c.765G>T | p.Lys255Asn | p.K255N | protein_coding | deleterious(0) | probably_damaging(0.994) | TCGA-AG-A002-01 | Colorectum | rectum adenocarcinoma | Male | <65 | I/II | Unknown | Unknown | SD | |
| EBNA1BP2 | SNV | Missense_Mutation | c.593N>A | p.Ser198Tyr | p.S198Y | protein_coding | deleterious(0) | probably_damaging(0.986) | TCGA-F5-6813-01 | Colorectum | rectum adenocarcinoma | Male | >=65 | III/IV | Unknown | Unknown | PD |
| Page: 1 2 3 4 |
Top |
Related drugs of malignant transformation related genes |
| Identification of chemicals and drugs interact with genes involved in malignant transfromation |
| (DGIdb 4.0) |
| Entrez ID | Symbol | Category | Interaction Types | Drug Claim Name | Drug Name | PMIDs |
| Page: 1 |

Copyright 2023-Present -The University of Texas Health Science Center at Houston |