
|
|||||
|
 | |
| |
| |
| |
| |
| |
|
Gene: EAPP |
Gene summary for EAPP |
| Gene information | Species | Human | Gene symbol | EAPP | Gene ID | 55837 |
| Gene name | E2F associated phosphoprotein | |
| Gene Alias | BM036 | |
| Cytomap | 14q13.1 | |
| Gene Type | protein-coding | GO ID | GO:0006139 | UniProtAcc | Q56P03 |
Top |
Malignant transformation analysis |
| Identification of the aberrant gene expression in precancerous and cancerous lesions by comparing the gene expression of stem-like cells in diseased tissues with normal stem cells |
| Entrez ID | Symbol | Replicates | Species | Organ | Tissue | Adj P-value | Log2FC | Malignancy |
| 55837 | EAPP | HTA11_1938_2000001011 | Human | Colorectum | AD | 2.45e-02 | 3.06e-01 | -0.0811 |
| 55837 | EAPP | HTA11_78_2000001011 | Human | Colorectum | AD | 1.15e-04 | 3.57e-01 | -0.1088 |
| 55837 | EAPP | HTA11_347_2000001011 | Human | Colorectum | AD | 1.08e-31 | 8.14e-01 | -0.1954 |
| 55837 | EAPP | HTA11_83_2000001011 | Human | Colorectum | SER | 1.15e-02 | 4.05e-01 | -0.1526 |
| 55837 | EAPP | HTA11_866_2000001011 | Human | Colorectum | AD | 3.33e-02 | 3.30e-01 | -0.1001 |
| 55837 | EAPP | HTA11_1391_2000001011 | Human | Colorectum | AD | 3.49e-06 | 3.69e-01 | -0.059 |
| 55837 | EAPP | HTA11_10623_2000001011 | Human | Colorectum | AD | 1.10e-02 | 3.92e-01 | -0.0177 |
| 55837 | EAPP | HTA11_99999965104_69814 | Human | Colorectum | MSS | 7.59e-04 | 3.18e-01 | 0.281 |
| 55837 | EAPP | A015-C-203 | Human | Colorectum | FAP | 1.32e-09 | -2.20e-01 | -0.1294 |
| 55837 | EAPP | A002-C-201 | Human | Colorectum | FAP | 1.42e-03 | -2.05e-01 | 0.0324 |
| 55837 | EAPP | A001-C-108 | Human | Colorectum | FAP | 4.11e-04 | -1.19e-01 | -0.0272 |
| 55837 | EAPP | A002-C-205 | Human | Colorectum | FAP | 1.92e-07 | -1.14e-01 | -0.1236 |
| 55837 | EAPP | A015-C-006 | Human | Colorectum | FAP | 1.54e-04 | -2.93e-01 | -0.0994 |
| 55837 | EAPP | A015-C-106 | Human | Colorectum | FAP | 1.04e-02 | -1.34e-01 | -0.0511 |
| 55837 | EAPP | A002-C-114 | Human | Colorectum | FAP | 4.16e-05 | -1.99e-01 | -0.1561 |
| 55837 | EAPP | A015-C-104 | Human | Colorectum | FAP | 1.66e-09 | -2.05e-01 | -0.1899 |
| 55837 | EAPP | A001-C-014 | Human | Colorectum | FAP | 8.02e-04 | -1.83e-01 | 0.0135 |
| 55837 | EAPP | A002-C-016 | Human | Colorectum | FAP | 7.70e-06 | -2.04e-01 | 0.0521 |
| 55837 | EAPP | A015-C-002 | Human | Colorectum | FAP | 5.05e-04 | -3.13e-01 | -0.0763 |
| 55837 | EAPP | A002-C-116 | Human | Colorectum | FAP | 1.21e-12 | -2.06e-01 | -0.0452 |
| Page: 1 2 3 4 5 6 7 8 |
| Tissue | Expression Dynamics | Abbreviation |
| Colorectum (GSE201348) |  | FAP: Familial adenomatous polyposis |
| CRC: Colorectal cancer | ||
| Colorectum (HTA11) |  | AD: Adenomas |
| SER: Sessile serrated lesions | ||
| MSI-H: Microsatellite-high colorectal cancer | ||
| MSS: Microsatellite stable colorectal cancer | ||
| Esophagus | 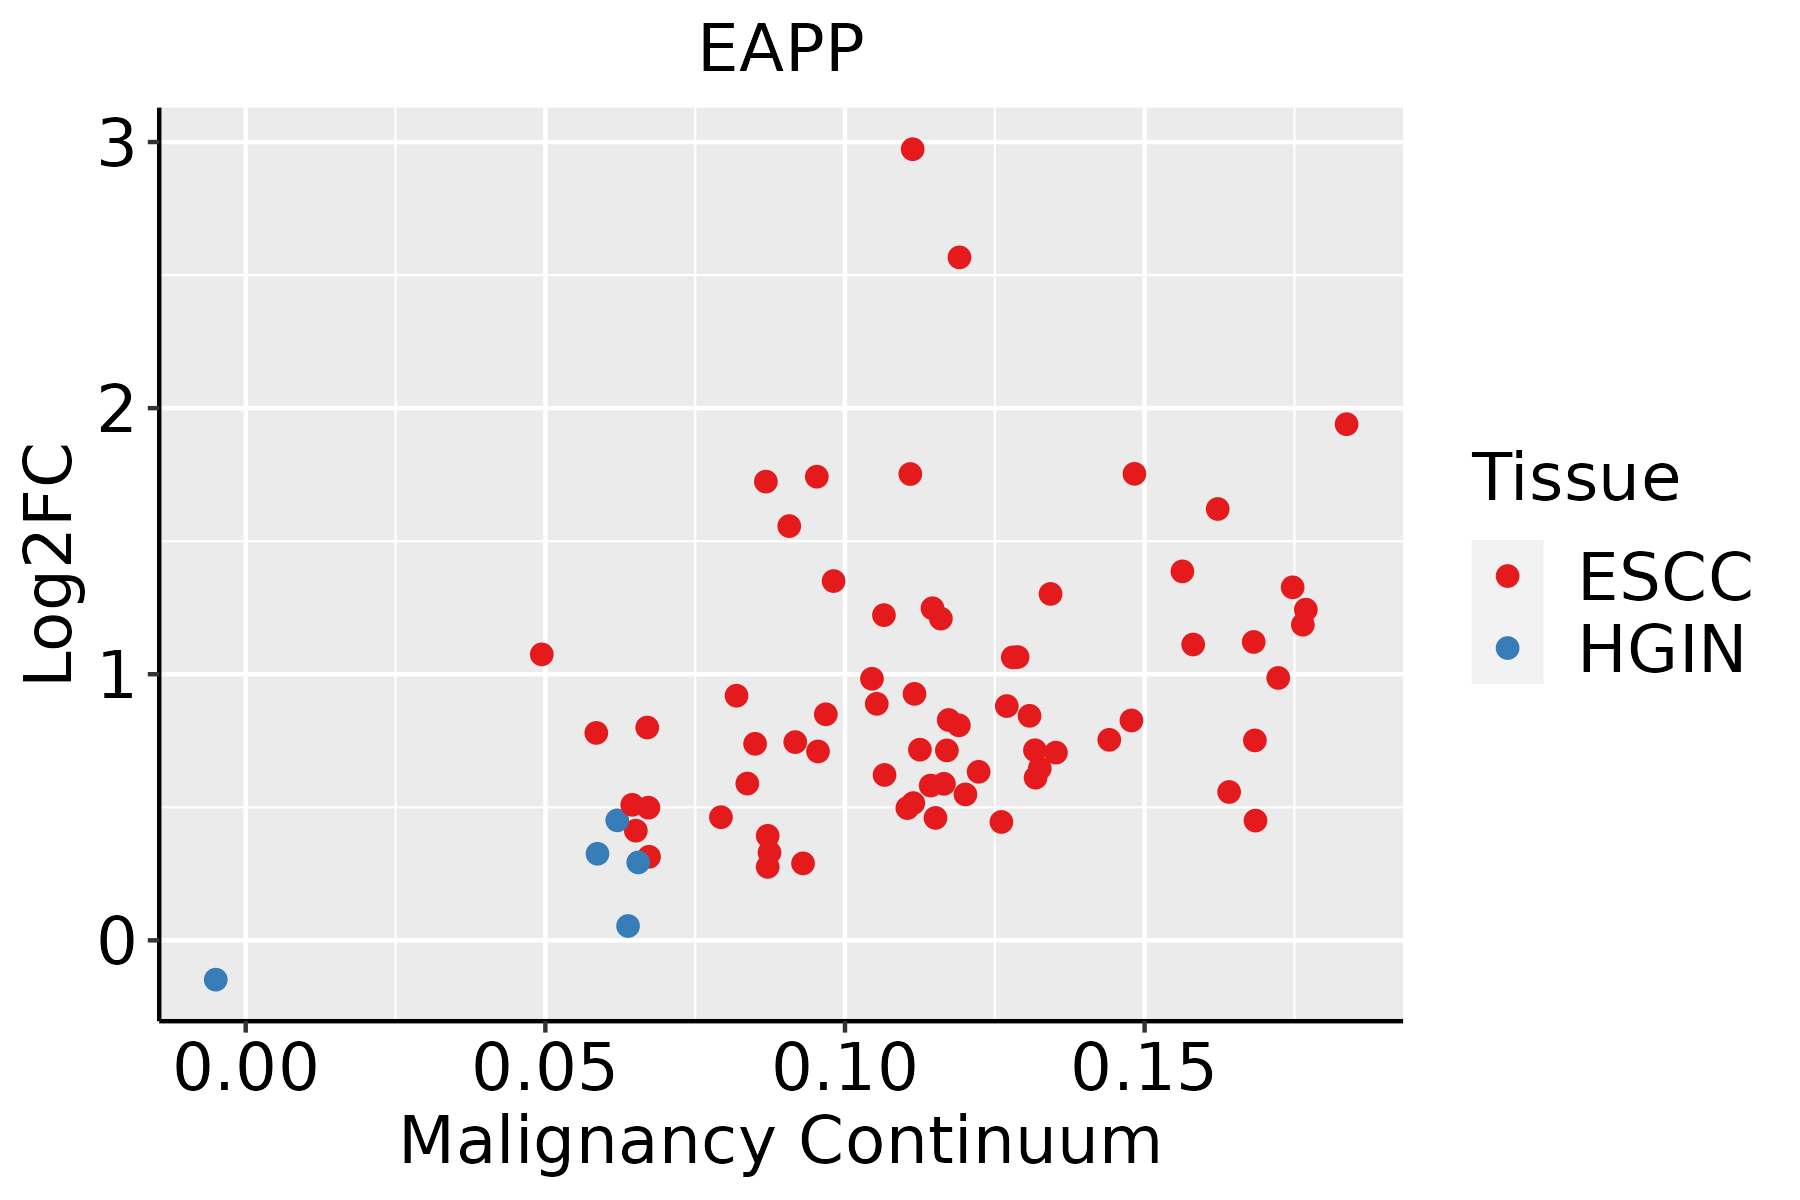 | ESCC: Esophageal squamous cell carcinoma |
| HGIN: High-grade intraepithelial neoplasias | ||
| LGIN: Low-grade intraepithelial neoplasias | ||
| Liver | 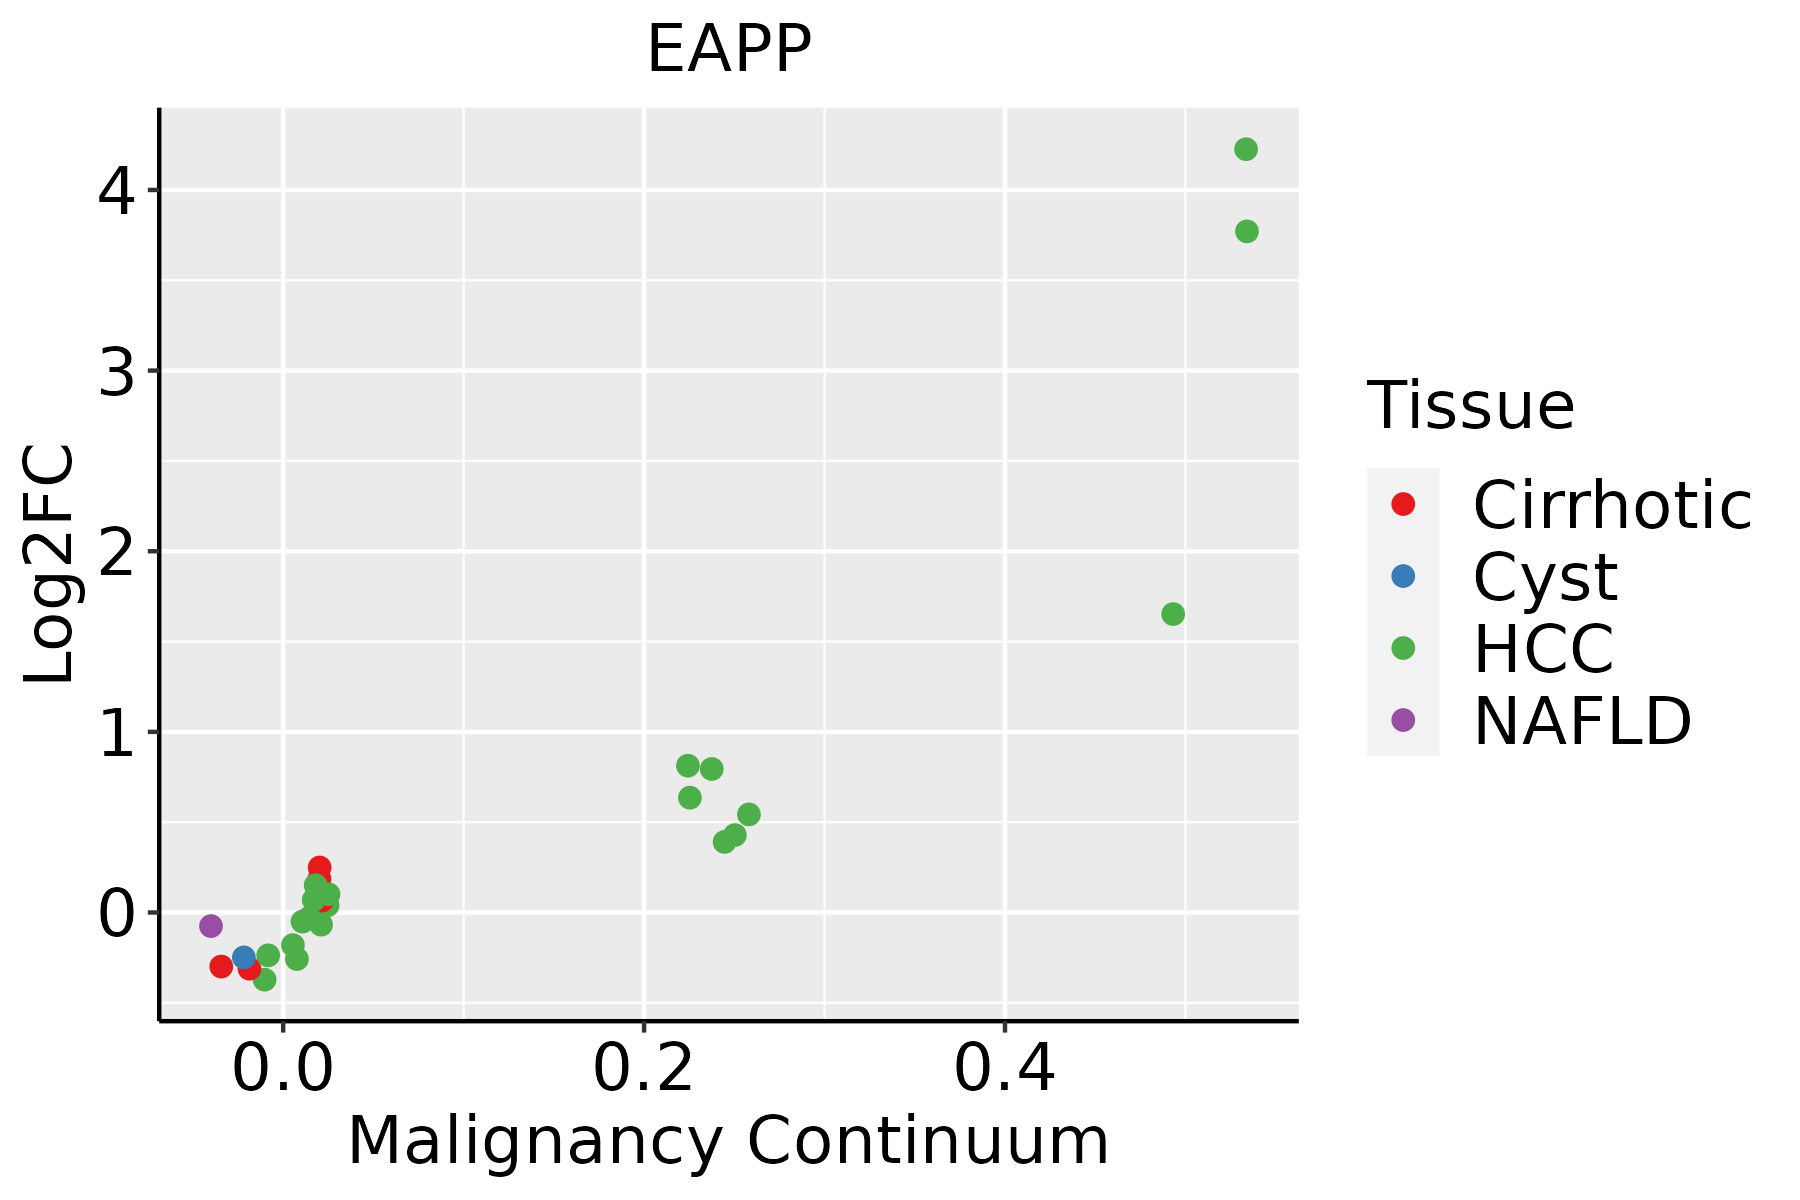 | HCC: Hepatocellular carcinoma |
| NAFLD: Non-alcoholic fatty liver disease | ||
| Oral Cavity |  | EOLP: Erosive Oral lichen planus |
| LP: leukoplakia | ||
| NEOLP: Non-erosive oral lichen planus | ||
| OSCC: Oral squamous cell carcinoma | ||
| Prostate | 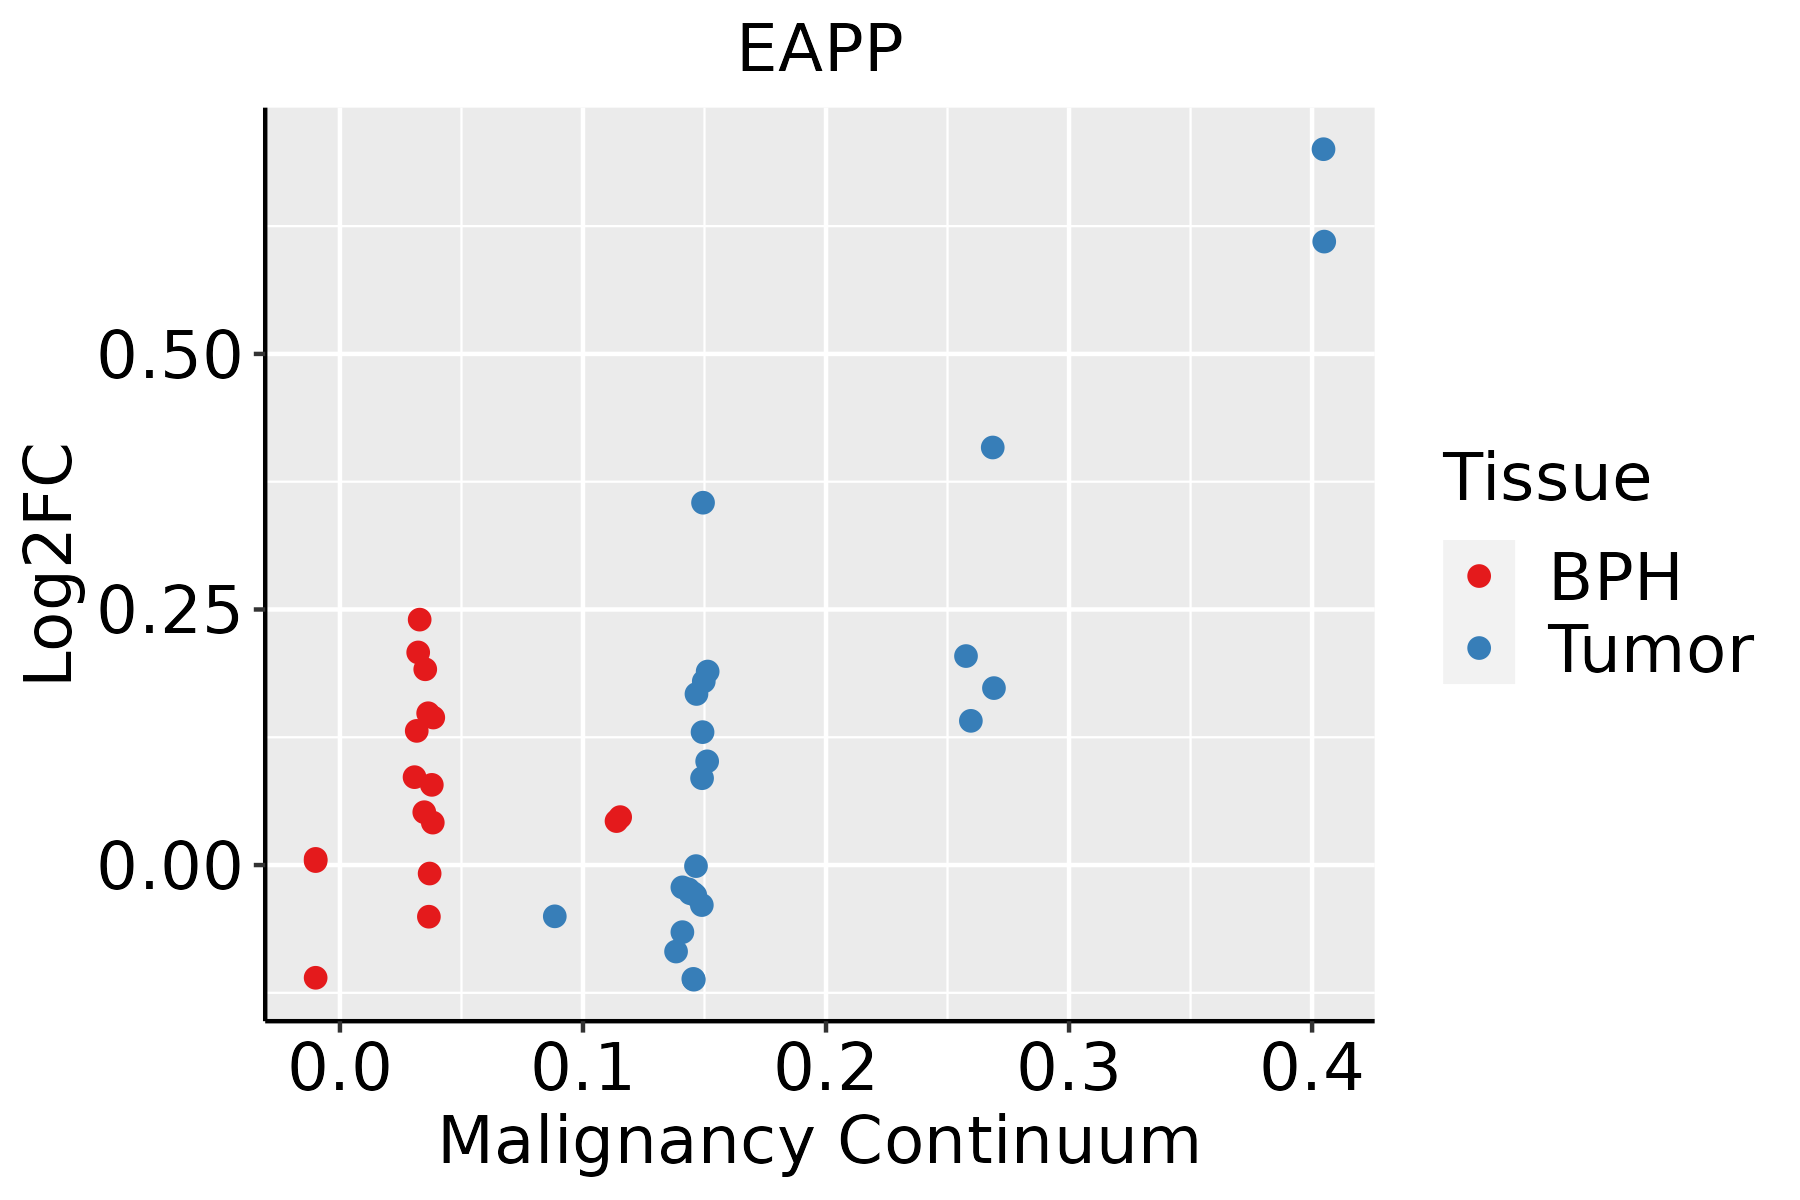 | BPH: Benign Prostatic Hyperplasia |
| Skin | 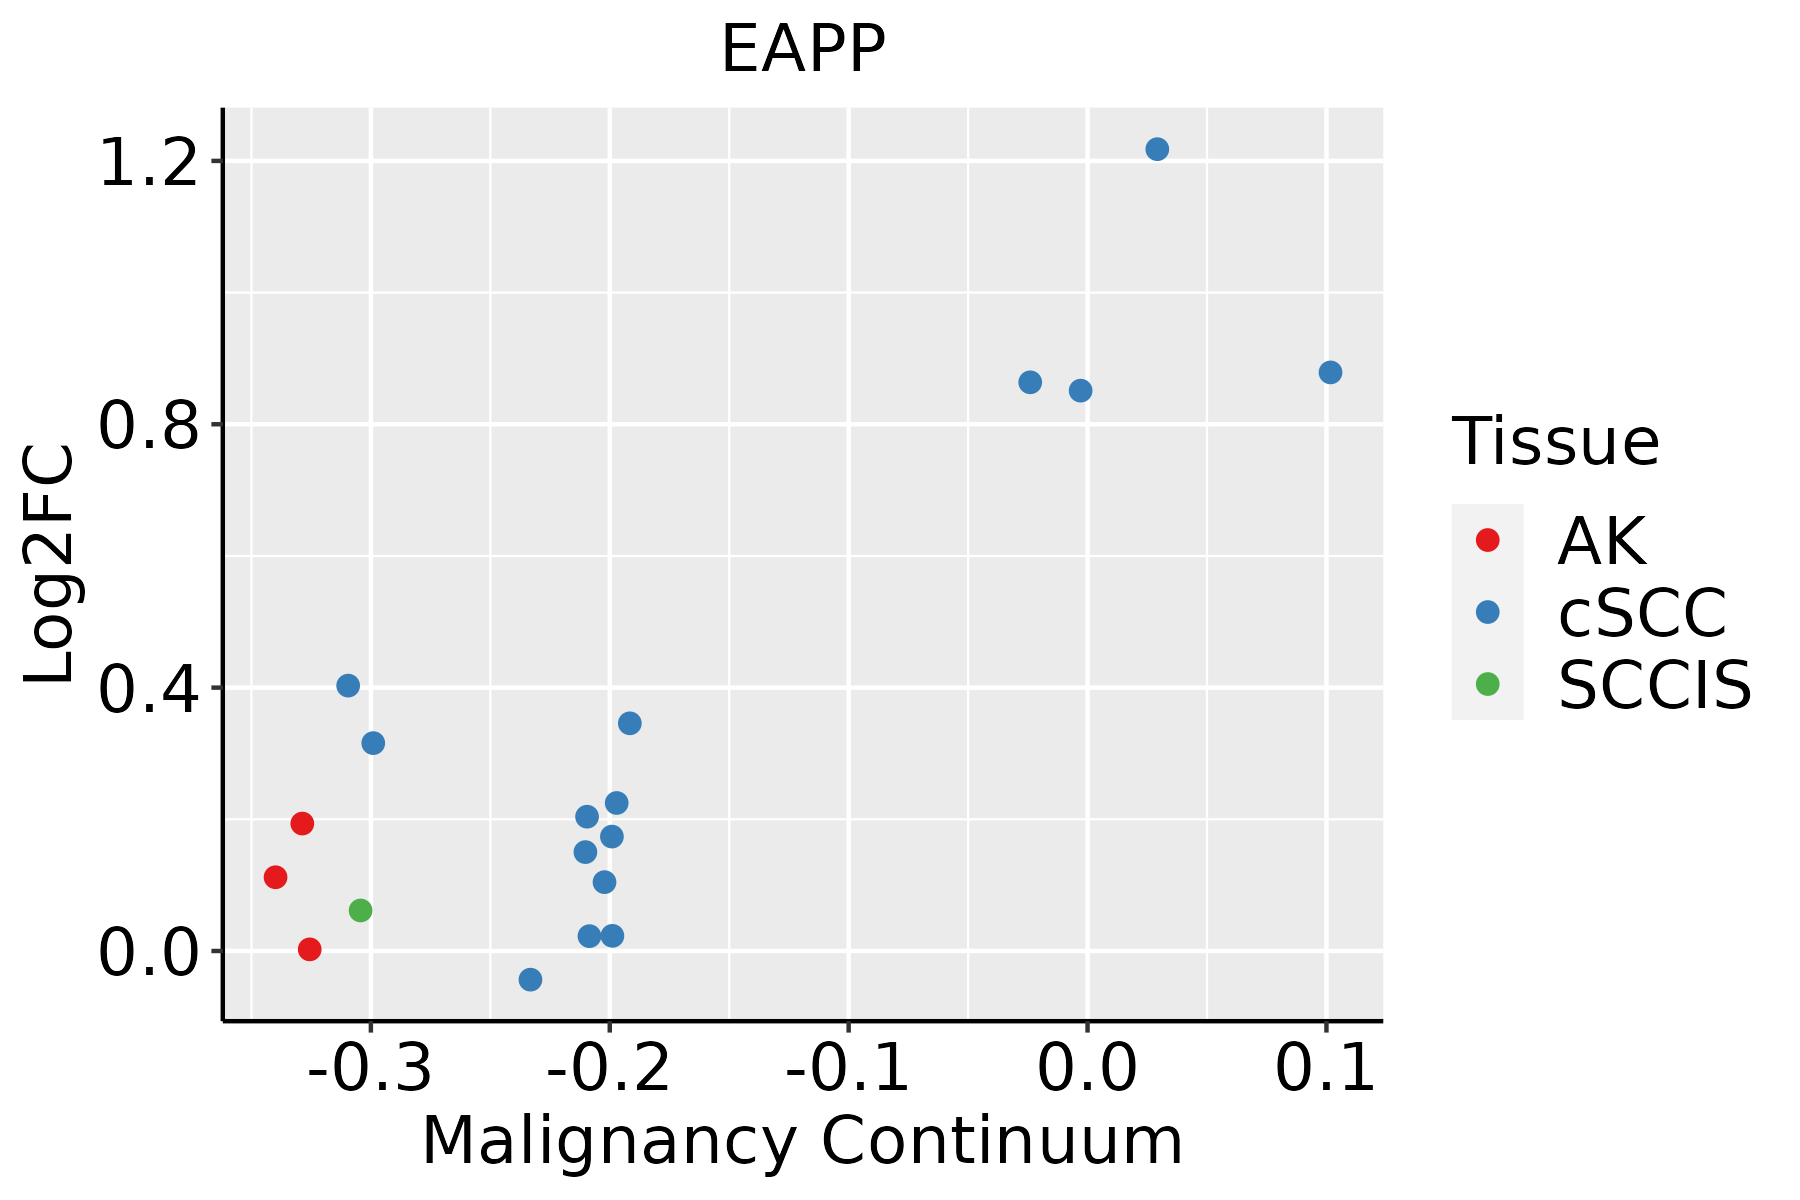 | AK: Actinic keratosis |
| cSCC: Cutaneous squamous cell carcinoma | ||
| SCCIS:squamous cell carcinoma in situ | ||
| Thyroid | 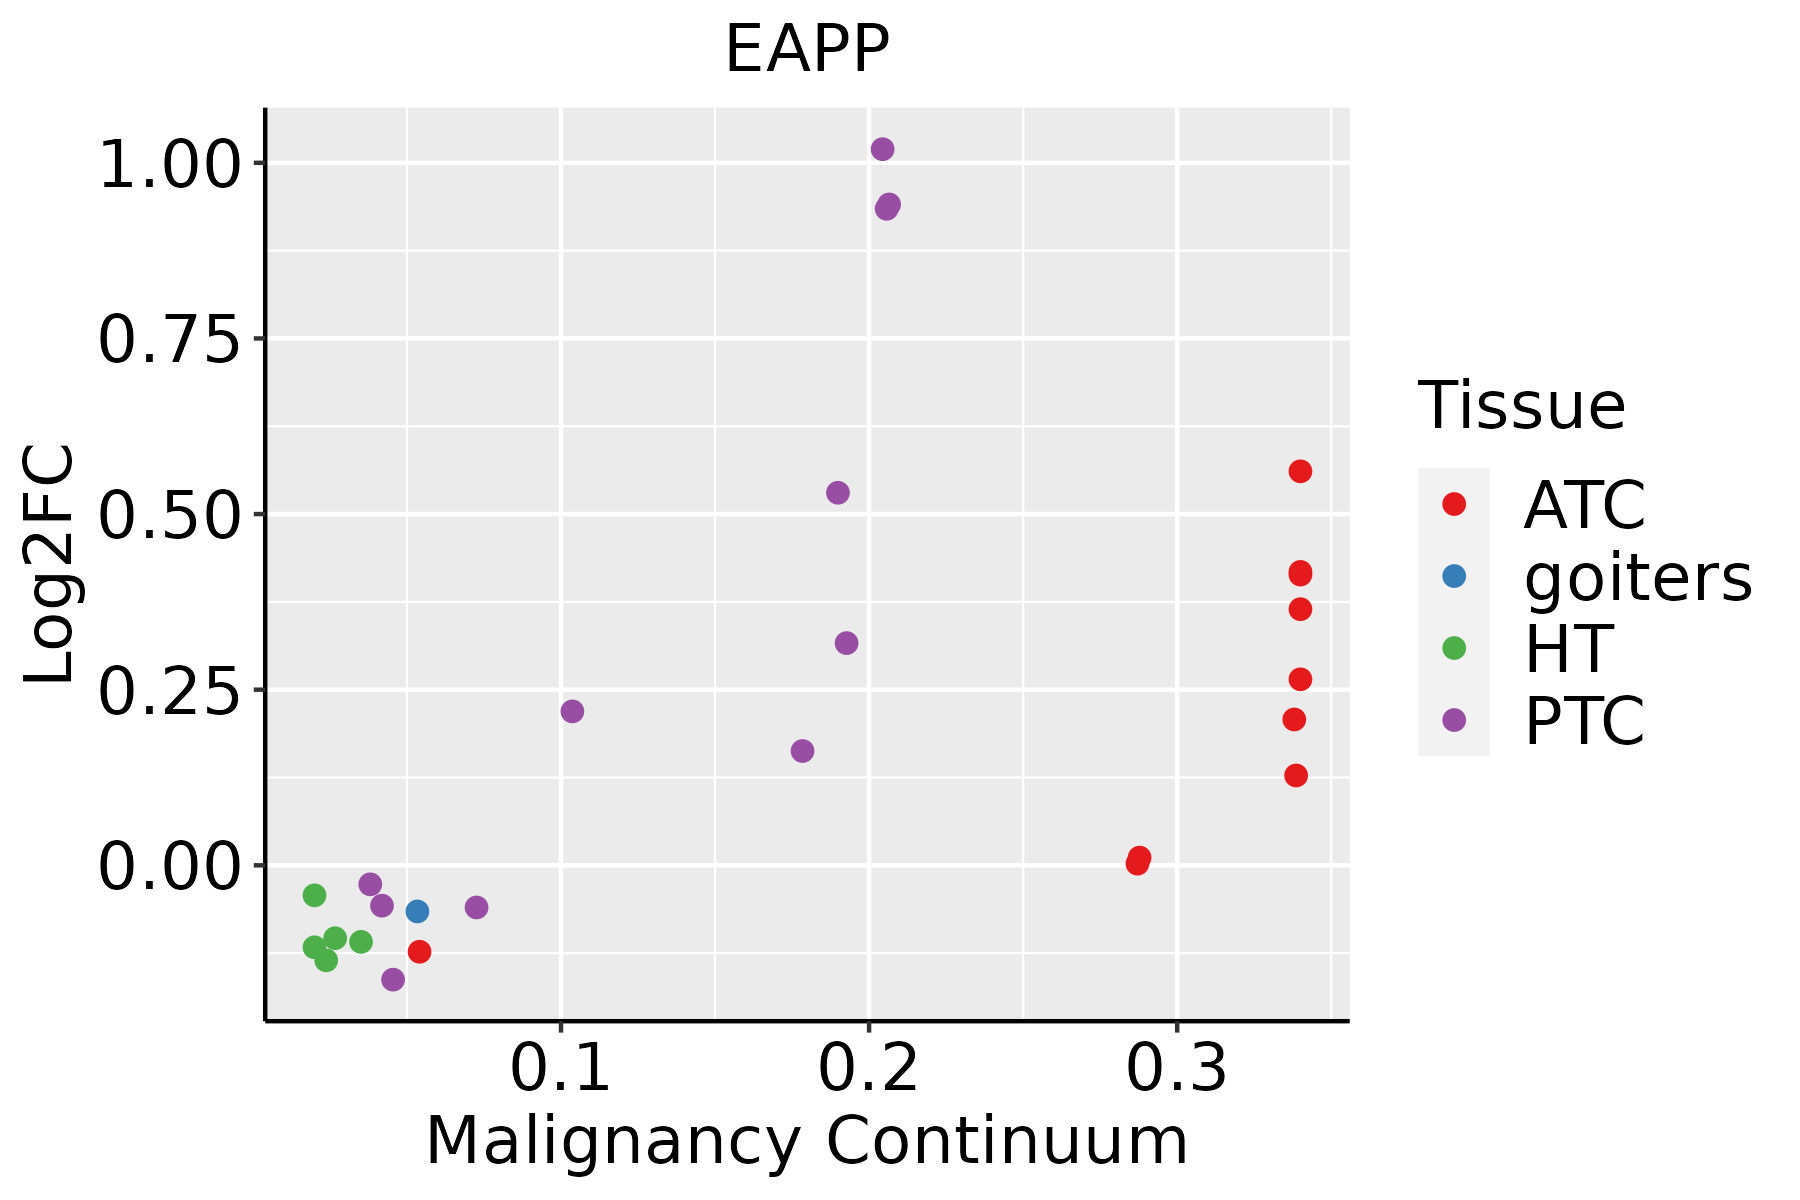 | ATC: Anaplastic thyroid cancer |
| HT: Hashimoto's thyroiditis | ||
| PTC: Papillary thyroid cancer |
| ∗log2FC in expression of this searched gene in stem-like cells from each diseased tissue sample relative to stem-like cells in normal samples in each tissue plotted against the malignancy continuum. Samples are colored based on if they are from different disease stage. |
Top |
Malignant transformation related pathway analysis |
| Find out the enriched GO biological processes and KEGG pathways involved in transition from healthy to precancer to cancer |
| Tissue | Disease Stage | Enriched GO biological Processes |
| Colorectum | AD |  |
| Colorectum | SER |  |
| Colorectum | MSS |  |
| Colorectum | MSI-H |  |
| Colorectum | FAP |  |
| ∗Top 15 enriched GO BP terms are showed in the bar plot of each disease state in each tissue. Each row represents a significant GO biological process which is colored according to the -log10(p.adjust). |
| Page: 1 2 3 4 5 6 7 8 9 |
| GO ID | Tissue | Disease Stage | Description | Gene Ratio | Bg Ratio | pvalue | p.adjust | Count |
| GO:0032786 | Colorectum | AD | positive regulation of DNA-templated transcription, elongation | 13/3918 | 27/18723 | 1.47e-03 | 1.25e-02 | 13 |
| GO:0006354 | Colorectum | AD | DNA-templated transcription, elongation | 31/3918 | 91/18723 | 2.46e-03 | 1.90e-02 | 31 |
| GO:0006368 | Colorectum | AD | transcription elongation from RNA polymerase II promoter | 24/3918 | 69/18723 | 5.35e-03 | 3.52e-02 | 24 |
| GO:00063541 | Colorectum | MSS | DNA-templated transcription, elongation | 29/3467 | 91/18723 | 1.52e-03 | 1.39e-02 | 29 |
| GO:00327861 | Colorectum | MSS | positive regulation of DNA-templated transcription, elongation | 12/3467 | 27/18723 | 1.74e-03 | 1.55e-02 | 12 |
| GO:00063681 | Colorectum | MSS | transcription elongation from RNA polymerase II promoter | 22/3467 | 69/18723 | 5.31e-03 | 3.62e-02 | 22 |
| GO:00327862 | Colorectum | FAP | positive regulation of DNA-templated transcription, elongation | 11/2622 | 27/18723 | 5.93e-04 | 6.58e-03 | 11 |
| GO:00063682 | Colorectum | FAP | transcription elongation from RNA polymerase II promoter | 20/2622 | 69/18723 | 9.25e-04 | 9.26e-03 | 20 |
| GO:00063542 | Colorectum | FAP | DNA-templated transcription, elongation | 24/2622 | 91/18723 | 1.32e-03 | 1.22e-02 | 24 |
| GO:0032968 | Colorectum | FAP | positive regulation of transcription elongation from RNA polymerase II promoter | 6/2622 | 13/18723 | 5.32e-03 | 3.49e-02 | 6 |
| GO:000635414 | Esophagus | ESCC | DNA-templated transcription, elongation | 76/8552 | 91/18723 | 8.35e-14 | 4.11e-12 | 76 |
| GO:000636814 | Esophagus | ESCC | transcription elongation from RNA polymerase II promoter | 56/8552 | 69/18723 | 1.40e-09 | 3.30e-08 | 56 |
| GO:003278412 | Esophagus | ESCC | regulation of DNA-templated transcription, elongation | 45/8552 | 53/18723 | 3.64e-09 | 7.61e-08 | 45 |
| GO:003424312 | Esophagus | ESCC | regulation of transcription elongation from RNA polymerase II promoter | 28/8552 | 32/18723 | 1.02e-06 | 1.29e-05 | 28 |
| GO:003278613 | Esophagus | ESCC | positive regulation of DNA-templated transcription, elongation | 24/8552 | 27/18723 | 3.48e-06 | 3.84e-05 | 24 |
| GO:003296812 | Esophagus | ESCC | positive regulation of transcription elongation from RNA polymerase II promoter | 12/8552 | 13/18723 | 6.18e-04 | 3.32e-03 | 12 |
| GO:003424411 | Esophagus | ESCC | negative regulation of transcription elongation from RNA polymerase II promoter | 14/8552 | 16/18723 | 6.78e-04 | 3.56e-03 | 14 |
| GO:003278511 | Esophagus | ESCC | negative regulation of DNA-templated transcription, elongation | 15/8552 | 18/18723 | 1.20e-03 | 5.88e-03 | 15 |
| GO:00063544 | Liver | Cirrhotic | DNA-templated transcription, elongation | 35/4634 | 91/18723 | 2.56e-03 | 1.53e-02 | 35 |
| GO:00063683 | Liver | Cirrhotic | transcription elongation from RNA polymerase II promoter | 28/4634 | 69/18723 | 2.70e-03 | 1.58e-02 | 28 |
| Page: 1 2 3 4 5 |
| Pathway ID | Tissue | Disease Stage | Description | Gene Ratio | Bg Ratio | pvalue | p.adjust | qvalue | Count |
| Page: 1 |
Top |
Cell-cell communication analysis |
| Identification of potential cell-cell interactions between two cell types and their ligand-receptor pairs for different disease states |
| Ligand | Receptor | LRpair | Pathway | Tissue | Disease Stage |
| Page: 1 |
Top |
Single-cell gene regulatory network inference analysis |
| Find out the significant the regulons (TFs) and the target genes of each regulon across cell types for different disease states |
| TF | Cell Type | Tissue | Disease Stage | Target Gene | RSS | Regulon Activity |
| ∗The dot plots of a searched regulon are shown for all cell subpopulations in each disease state of each tissue based on the regulon specific score inferred using pySCENIC and by calculating the average expression. |
| Page: 1 |
Top |
Somatic mutation of malignant transformation related genes |
| Annotation of somatic variants for genes involved in malignant transformation |
| Hugo Symbol | Variant Class | Variant Classification | dbSNP RS | HGVSc | HGVSp | HGVSp Short | SWISSPROT | BIOTYPE | SIFT | PolyPhen | Tumor Sample Barcode | Tissue | Histology | Sex | Age | Stage | Therapy Types | Drugs | Outcome |
| EAPP | SNV | Missense_Mutation | c.445G>A | p.Ala149Thr | p.A149T | Q56P03 | protein_coding | tolerated(0.21) | possibly_damaging(0.597) | TCGA-A8-A09Z-01 | Breast | breast invasive carcinoma | Female | >=65 | I/II | Unknown | Unknown | SD | |
| EAPP | SNV | Missense_Mutation | c.646G>A | p.Glu216Lys | p.E216K | Q56P03 | protein_coding | deleterious(0) | probably_damaging(0.999) | TCGA-GM-A2D9-01 | Breast | breast invasive carcinoma | Female | >=65 | I/II | Hormone Therapy | arimidex | SD | |
| EAPP | insertion | Frame_Shift_Ins | novel | c.374_375insA | p.Lys126GlufsTer10 | p.K126Efs*10 | Q56P03 | protein_coding | TCGA-UL-AAZ6-01 | Breast | breast invasive carcinoma | Female | >=65 | I/II | Chemotherapy | herceptin | SD | ||
| EAPP | SNV | Missense_Mutation | novel | c.310N>T | p.Asp104Tyr | p.D104Y | Q56P03 | protein_coding | deleterious(0) | possibly_damaging(0.653) | TCGA-MA-AA41-01 | Cervix | cervical & endocervical cancer | Female | <65 | I/II | Unknown | Unknown | SD |
| EAPP | SNV | Missense_Mutation | rs149923274 | c.836N>G | p.Asn279Ser | p.N279S | Q56P03 | protein_coding | deleterious(0.04) | benign(0.076) | TCGA-AA-A03F-01 | Colorectum | colon adenocarcinoma | Female | >=65 | III/IV | Unknown | Unknown | PD |
| EAPP | SNV | Missense_Mutation | c.347N>T | p.Arg116Ile | p.R116I | Q56P03 | protein_coding | tolerated(0.05) | benign(0) | TCGA-AD-5900-01 | Colorectum | colon adenocarcinoma | Male | >=65 | I/II | Unknown | Unknown | SD | |
| EAPP | SNV | Missense_Mutation | c.800N>T | p.Ala267Val | p.A267V | Q56P03 | protein_coding | deleterious(0) | probably_damaging(0.999) | TCGA-CK-4951-01 | Colorectum | colon adenocarcinoma | Female | >=65 | I/II | Unknown | Unknown | PD | |
| EAPP | SNV | Missense_Mutation | c.437N>A | p.Arg146Lys | p.R146K | Q56P03 | protein_coding | tolerated(0.19) | benign(0.026) | TCGA-AG-4007-01 | Colorectum | rectum adenocarcinoma | Male | >=65 | III/IV | Unknown | Unknown | SD | |
| EAPP | SNV | Missense_Mutation | c.710C>A | p.Ser237Tyr | p.S237Y | Q56P03 | protein_coding | tolerated(0.12) | benign(0.34) | TCGA-AG-A002-01 | Colorectum | rectum adenocarcinoma | Male | <65 | I/II | Unknown | Unknown | SD | |
| EAPP | deletion | Frame_Shift_Del | novel | c.833delN | p.Phe278SerfsTer4 | p.F278Sfs*4 | Q56P03 | protein_coding | TCGA-AA-3966-01 | Colorectum | colon adenocarcinoma | Female | >=65 | I/II | Unknown | Unknown | SD |
| Page: 1 2 3 |
Top |
Related drugs of malignant transformation related genes |
| Identification of chemicals and drugs interact with genes involved in malignant transfromation |
| (DGIdb 4.0) |
| Entrez ID | Symbol | Category | Interaction Types | Drug Claim Name | Drug Name | PMIDs |
| Page: 1 |

Copyright 2023-Present -The University of Texas Health Science Center at Houston |