
|
|||||
|
 | |
| |
| |
| |
| |
| |
|
Gene: E4F1 |
Gene summary for E4F1 |
| Gene information | Species | Human | Gene symbol | E4F1 | Gene ID | 1877 |
| Gene name | E4F transcription factor 1 | |
| Gene Alias | E4F | |
| Cytomap | 16p13.3 | |
| Gene Type | protein-coding | GO ID | GO:0000122 | UniProtAcc | Q66K89 |
Top |
Malignant transformation analysis |
| Identification of the aberrant gene expression in precancerous and cancerous lesions by comparing the gene expression of stem-like cells in diseased tissues with normal stem cells |
| Entrez ID | Symbol | Replicates | Species | Organ | Tissue | Adj P-value | Log2FC | Malignancy |
| 1877 | E4F1 | LZE4T | Human | Esophagus | ESCC | 2.31e-05 | 2.46e-01 | 0.0811 |
| 1877 | E4F1 | LZE7T | Human | Esophagus | ESCC | 2.39e-09 | 5.11e-01 | 0.0667 |
| 1877 | E4F1 | LZE20T | Human | Esophagus | ESCC | 2.61e-05 | 2.57e-01 | 0.0662 |
| 1877 | E4F1 | LZE24T | Human | Esophagus | ESCC | 1.44e-07 | 2.55e-01 | 0.0596 |
| 1877 | E4F1 | P1T-E | Human | Esophagus | ESCC | 1.25e-19 | 7.13e-01 | 0.0875 |
| 1877 | E4F1 | P2T-E | Human | Esophagus | ESCC | 1.80e-31 | 5.88e-01 | 0.1177 |
| 1877 | E4F1 | P4T-E | Human | Esophagus | ESCC | 1.40e-15 | 3.68e-01 | 0.1323 |
| 1877 | E4F1 | P5T-E | Human | Esophagus | ESCC | 1.42e-13 | 3.01e-01 | 0.1327 |
| 1877 | E4F1 | P8T-E | Human | Esophagus | ESCC | 6.69e-12 | 2.47e-01 | 0.0889 |
| 1877 | E4F1 | P9T-E | Human | Esophagus | ESCC | 1.78e-09 | 2.16e-01 | 0.1131 |
| 1877 | E4F1 | P10T-E | Human | Esophagus | ESCC | 2.39e-13 | 2.36e-01 | 0.116 |
| 1877 | E4F1 | P11T-E | Human | Esophagus | ESCC | 6.11e-12 | 6.06e-01 | 0.1426 |
| 1877 | E4F1 | P12T-E | Human | Esophagus | ESCC | 8.01e-24 | 5.11e-01 | 0.1122 |
| 1877 | E4F1 | P15T-E | Human | Esophagus | ESCC | 1.92e-19 | 4.34e-01 | 0.1149 |
| 1877 | E4F1 | P16T-E | Human | Esophagus | ESCC | 1.78e-15 | 2.53e-01 | 0.1153 |
| 1877 | E4F1 | P17T-E | Human | Esophagus | ESCC | 1.96e-07 | 3.63e-01 | 0.1278 |
| 1877 | E4F1 | P19T-E | Human | Esophagus | ESCC | 4.75e-04 | 4.39e-01 | 0.1662 |
| 1877 | E4F1 | P20T-E | Human | Esophagus | ESCC | 9.38e-27 | 5.79e-01 | 0.1124 |
| 1877 | E4F1 | P21T-E | Human | Esophagus | ESCC | 1.21e-15 | 2.77e-01 | 0.1617 |
| 1877 | E4F1 | P22T-E | Human | Esophagus | ESCC | 4.84e-16 | 2.97e-01 | 0.1236 |
| Page: 1 2 3 4 |
| Tissue | Expression Dynamics | Abbreviation |
| Esophagus |  | ESCC: Esophageal squamous cell carcinoma |
| HGIN: High-grade intraepithelial neoplasias | ||
| LGIN: Low-grade intraepithelial neoplasias | ||
| Liver | 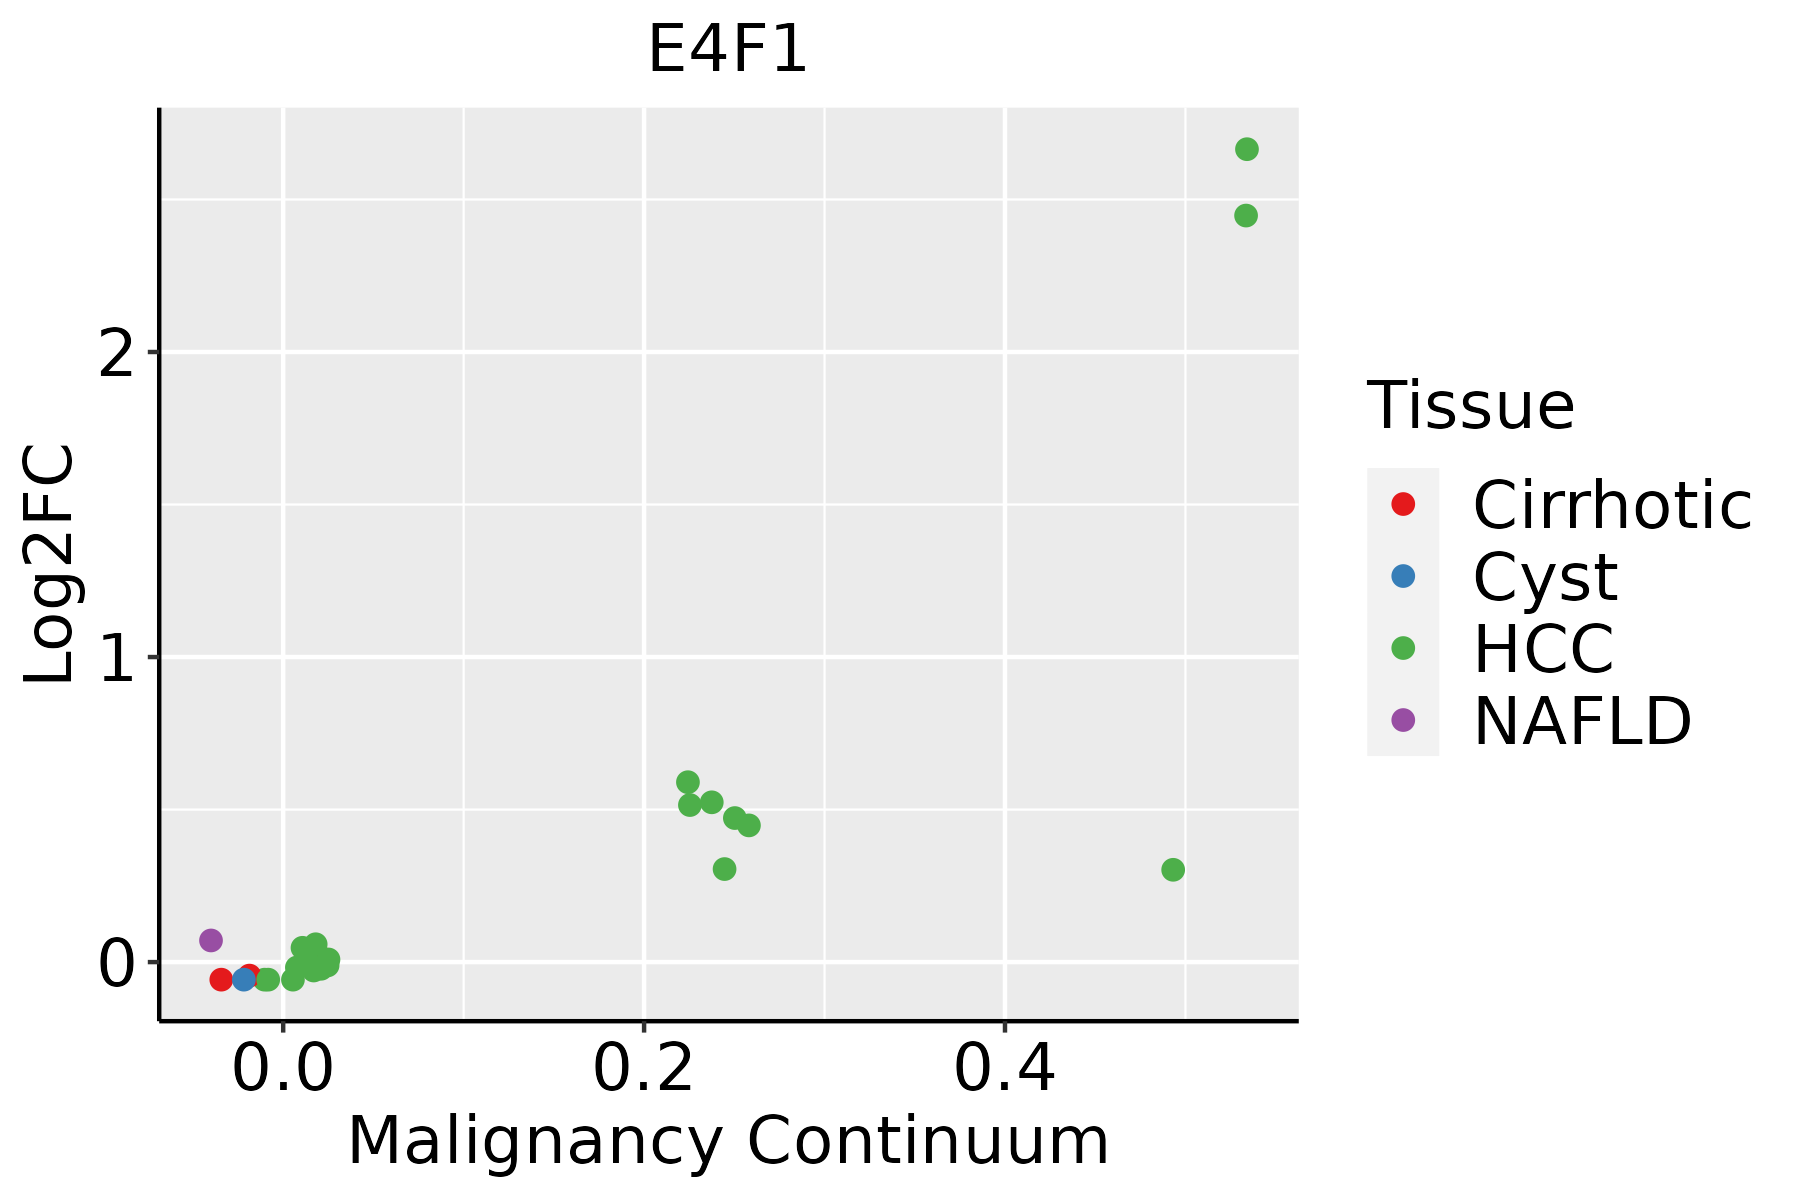 | HCC: Hepatocellular carcinoma |
| NAFLD: Non-alcoholic fatty liver disease | ||
| Oral Cavity |  | EOLP: Erosive Oral lichen planus |
| LP: leukoplakia | ||
| NEOLP: Non-erosive oral lichen planus | ||
| OSCC: Oral squamous cell carcinoma |
| ∗log2FC in expression of this searched gene in stem-like cells from each diseased tissue sample relative to stem-like cells in normal samples in each tissue plotted against the malignancy continuum. Samples are colored based on if they are from different disease stage. |
Top |
Malignant transformation related pathway analysis |
| Find out the enriched GO biological processes and KEGG pathways involved in transition from healthy to precancer to cancer |
| Tissue | Disease Stage | Enriched GO biological Processes |
| Colorectum | AD |  |
| Colorectum | SER |  |
| Colorectum | MSS |  |
| Colorectum | MSI-H |  |
| Colorectum | FAP |  |
| ∗Top 15 enriched GO BP terms are showed in the bar plot of each disease state in each tissue. Each row represents a significant GO biological process which is colored according to the -log10(p.adjust). |
| Page: 1 2 3 4 5 6 7 8 9 |
| GO ID | Tissue | Disease Stage | Description | Gene Ratio | Bg Ratio | pvalue | p.adjust | Count |
| GO:000734615 | Esophagus | ESCC | regulation of mitotic cell cycle | 293/8552 | 457/18723 | 8.00e-16 | 5.64e-14 | 293 |
| GO:00062604 | Esophagus | ESCC | DNA replication | 181/8552 | 260/18723 | 3.55e-15 | 2.05e-13 | 181 |
| GO:000734611 | Liver | HCC | regulation of mitotic cell cycle | 255/7958 | 457/18723 | 4.96e-09 | 1.30e-07 | 255 |
| GO:00062601 | Liver | HCC | DNA replication | 146/7958 | 260/18723 | 5.68e-06 | 7.02e-05 | 146 |
| GO:00073469 | Oral cavity | OSCC | regulation of mitotic cell cycle | 266/7305 | 457/18723 | 3.87e-17 | 3.41e-15 | 266 |
| GO:00062603 | Oral cavity | OSCC | DNA replication | 159/7305 | 260/18723 | 3.25e-13 | 1.59e-11 | 159 |
| GO:000734614 | Oral cavity | LP | regulation of mitotic cell cycle | 163/4623 | 457/18723 | 7.64e-08 | 2.56e-06 | 163 |
| GO:000626011 | Oral cavity | LP | DNA replication | 97/4623 | 260/18723 | 3.67e-06 | 7.75e-05 | 97 |
| Page: 1 |
| Pathway ID | Tissue | Disease Stage | Description | Gene Ratio | Bg Ratio | pvalue | p.adjust | qvalue | Count |
| Page: 1 |
Top |
Cell-cell communication analysis |
| Identification of potential cell-cell interactions between two cell types and their ligand-receptor pairs for different disease states |
| Ligand | Receptor | LRpair | Pathway | Tissue | Disease Stage |
| Page: 1 |
Top |
Single-cell gene regulatory network inference analysis |
| Find out the significant the regulons (TFs) and the target genes of each regulon across cell types for different disease states |
| TF | Cell Type | Tissue | Disease Stage | Target Gene | RSS | Regulon Activity |
| E4F1 | SMC | Breast | ADJ | SLC2A8,TFF1,ACSF3, etc. | 1.12e-02 |  |
| E4F1 | SMC | Breast | Healthy | SLC2A8,TFF1,ACSF3, etc. | 1.19e-01 |  |
| E4F1 | PERI | Breast | Healthy | SLC2A8,TFF1,ACSF3, etc. | 1.63e-01 | |
| E4F1 | PERI | Breast | IDC | SLC2A8,TFF1,ACSF3, etc. | 2.42e-01 |  |
| E4F1 | SMC | Breast | Precancer | SLC2A8,TFF1,ACSF3, etc. | 1.04e-01 |  |
| E4F1 | PERI | Breast | Precancer | SLC2A8,TFF1,ACSF3, etc. | 4.08e-02 | |
| E4F1 | EE | Colorectum | ADJ | MAK,DONSON,PTP4A3, etc. | 3.11e-02 |  |
| E4F1 | SSC | Colorectum | ADJ | MAK,DONSON,PTP4A3, etc. | 7.60e-03 | |
| E4F1 | PLA | Lung | AAH | NUP42,SGCD,OGFOD1, etc. | 1.89e-02 |  |
| E4F1 | GMC | Stomach | CAG with IM | RPP40,RASSF4,ARL13B, etc. | 1.37e-01 |  |
| ∗The dot plots of a searched regulon are shown for all cell subpopulations in each disease state of each tissue based on the regulon specific score inferred using pySCENIC and by calculating the average expression. |
| Page: 1 2 |
Top |
Somatic mutation of malignant transformation related genes |
| Annotation of somatic variants for genes involved in malignant transformation |
| Hugo Symbol | Variant Class | Variant Classification | dbSNP RS | HGVSc | HGVSp | HGVSp Short | SWISSPROT | BIOTYPE | SIFT | PolyPhen | Tumor Sample Barcode | Tissue | Histology | Sex | Age | Stage | Therapy Types | Drugs | Outcome |
| E4F1 | SNV | Missense_Mutation | c.1274C>T | p.Ala425Val | p.A425V | Q66K89 | protein_coding | tolerated(0.15) | benign(0) | TCGA-BH-A18G-01 | Breast | breast invasive carcinoma | Female | >=65 | I/II | Unknown | Unknown | SD | |
| E4F1 | SNV | Missense_Mutation | rs144383218 | c.649N>T | p.Arg217Cys | p.R217C | Q66K89 | protein_coding | deleterious(0) | possibly_damaging(0.877) | TCGA-E2-A15I-01 | Breast | breast invasive carcinoma | Female | <65 | I/II | Hormone Therapy | tamoxiphen | SD |
| E4F1 | SNV | Missense_Mutation | c.1541N>T | p.Ser514Leu | p.S514L | Q66K89 | protein_coding | deleterious(0.04) | probably_damaging(0.99) | TCGA-E2-A1L7-01 | Breast | breast invasive carcinoma | Female | <65 | III/IV | Chemotherapy | cyclophosphamide | PD | |
| E4F1 | SNV | Missense_Mutation | novel | c.988N>G | p.Thr330Ala | p.T330A | Q66K89 | protein_coding | tolerated(0.12) | benign(0.026) | TCGA-E9-A3HO-01 | Breast | breast invasive carcinoma | Female | <65 | I/II | Chemotherapy | cyclophosphamide | CR |
| E4F1 | SNV | Missense_Mutation | novel | c.1009G>A | p.Val337Ile | p.V337I | Q66K89 | protein_coding | tolerated(0.17) | benign(0.029) | TCGA-2W-A8YY-01 | Cervix | cervical & endocervical cancer | Female | <65 | I/II | Chemotherapy | cisplatin | CR |
| E4F1 | SNV | Missense_Mutation | rs542965861 | c.2350G>A | p.Val784Ile | p.V784I | Q66K89 | protein_coding | deleterious(0.04) | possibly_damaging(0.53) | TCGA-EA-A3HU-01 | Cervix | cervical & endocervical cancer | Female | <65 | I/II | Unknown | Unknown | SD |
| E4F1 | SNV | Missense_Mutation | c.1390N>A | p.Ala464Thr | p.A464T | Q66K89 | protein_coding | tolerated(0.61) | benign(0) | TCGA-AA-A022-01 | Colorectum | colon adenocarcinoma | Female | >=65 | I/II | Unknown | Unknown | SD | |
| E4F1 | SNV | Missense_Mutation | c.1339N>A | p.Ala447Thr | p.A447T | Q66K89 | protein_coding | tolerated(0.24) | possibly_damaging(0.829) | TCGA-AD-6889-01 | Colorectum | colon adenocarcinoma | Male | >=65 | I/II | Chemotherapy | xeloda | PD | |
| E4F1 | SNV | Missense_Mutation | rs868100576 | c.400G>A | p.Ala134Thr | p.A134T | Q66K89 | protein_coding | tolerated(0.49) | benign(0.001) | TCGA-AD-6895-01 | Colorectum | colon adenocarcinoma | Male | >=65 | III/IV | Unknown | Unknown | SD |
| E4F1 | SNV | Missense_Mutation | c.728N>T | p.Thr243Met | p.T243M | Q66K89 | protein_coding | deleterious(0) | probably_damaging(0.998) | TCGA-AZ-4323-01 | Colorectum | colon adenocarcinoma | Male | <65 | III/IV | Chemotherapy | oxaliplatin | PD |
| Page: 1 2 3 4 5 6 7 8 |
Top |
Related drugs of malignant transformation related genes |
| Identification of chemicals and drugs interact with genes involved in malignant transfromation |
| (DGIdb 4.0) |
| Entrez ID | Symbol | Category | Interaction Types | Drug Claim Name | Drug Name | PMIDs |
| Page: 1 |

Copyright 2023-Present -The University of Texas Health Science Center at Houston |