
|
|||||
|
 | |
| |
| |
| |
| |
| |
|
Gene: E2F6 |
Gene summary for E2F6 |
| Gene information | Species | Human | Gene symbol | E2F6 | Gene ID | 1876 |
| Gene name | E2F transcription factor 6 | |
| Gene Alias | E2F-6 | |
| Cytomap | 2p25.1 | |
| Gene Type | protein-coding | GO ID | GO:0000082 | UniProtAcc | O75461 |
Top |
Malignant transformation analysis |
| Identification of the aberrant gene expression in precancerous and cancerous lesions by comparing the gene expression of stem-like cells in diseased tissues with normal stem cells |
| Entrez ID | Symbol | Replicates | Species | Organ | Tissue | Adj P-value | Log2FC | Malignancy |
| 1876 | E2F6 | LZE4T | Human | Esophagus | ESCC | 7.89e-08 | 2.95e-01 | 0.0811 |
| 1876 | E2F6 | LZE7T | Human | Esophagus | ESCC | 7.23e-06 | 3.14e-01 | 0.0667 |
| 1876 | E2F6 | LZE24T | Human | Esophagus | ESCC | 1.05e-04 | 1.87e-01 | 0.0596 |
| 1876 | E2F6 | LZE21T | Human | Esophagus | ESCC | 2.63e-03 | 2.58e-01 | 0.0655 |
| 1876 | E2F6 | P2T-E | Human | Esophagus | ESCC | 2.24e-29 | 6.62e-01 | 0.1177 |
| 1876 | E2F6 | P4T-E | Human | Esophagus | ESCC | 3.13e-15 | 3.74e-01 | 0.1323 |
| 1876 | E2F6 | P5T-E | Human | Esophagus | ESCC | 1.67e-08 | 1.27e-01 | 0.1327 |
| 1876 | E2F6 | P8T-E | Human | Esophagus | ESCC | 3.93e-08 | 1.92e-01 | 0.0889 |
| 1876 | E2F6 | P9T-E | Human | Esophagus | ESCC | 1.54e-08 | 1.68e-01 | 0.1131 |
| 1876 | E2F6 | P10T-E | Human | Esophagus | ESCC | 1.19e-16 | 3.34e-01 | 0.116 |
| 1876 | E2F6 | P11T-E | Human | Esophagus | ESCC | 1.14e-03 | 4.05e-01 | 0.1426 |
| 1876 | E2F6 | P12T-E | Human | Esophagus | ESCC | 2.65e-18 | 3.54e-01 | 0.1122 |
| 1876 | E2F6 | P15T-E | Human | Esophagus | ESCC | 5.58e-14 | 3.34e-01 | 0.1149 |
| 1876 | E2F6 | P16T-E | Human | Esophagus | ESCC | 4.00e-13 | 2.82e-01 | 0.1153 |
| 1876 | E2F6 | P17T-E | Human | Esophagus | ESCC | 1.86e-02 | 1.37e-01 | 0.1278 |
| 1876 | E2F6 | P20T-E | Human | Esophagus | ESCC | 1.60e-09 | 2.89e-01 | 0.1124 |
| 1876 | E2F6 | P21T-E | Human | Esophagus | ESCC | 4.43e-20 | 3.88e-01 | 0.1617 |
| 1876 | E2F6 | P22T-E | Human | Esophagus | ESCC | 2.91e-14 | 2.68e-01 | 0.1236 |
| 1876 | E2F6 | P23T-E | Human | Esophagus | ESCC | 9.13e-13 | 4.35e-01 | 0.108 |
| 1876 | E2F6 | P24T-E | Human | Esophagus | ESCC | 6.05e-08 | 2.05e-01 | 0.1287 |
| Page: 1 2 3 4 |
| Tissue | Expression Dynamics | Abbreviation |
| Esophagus | 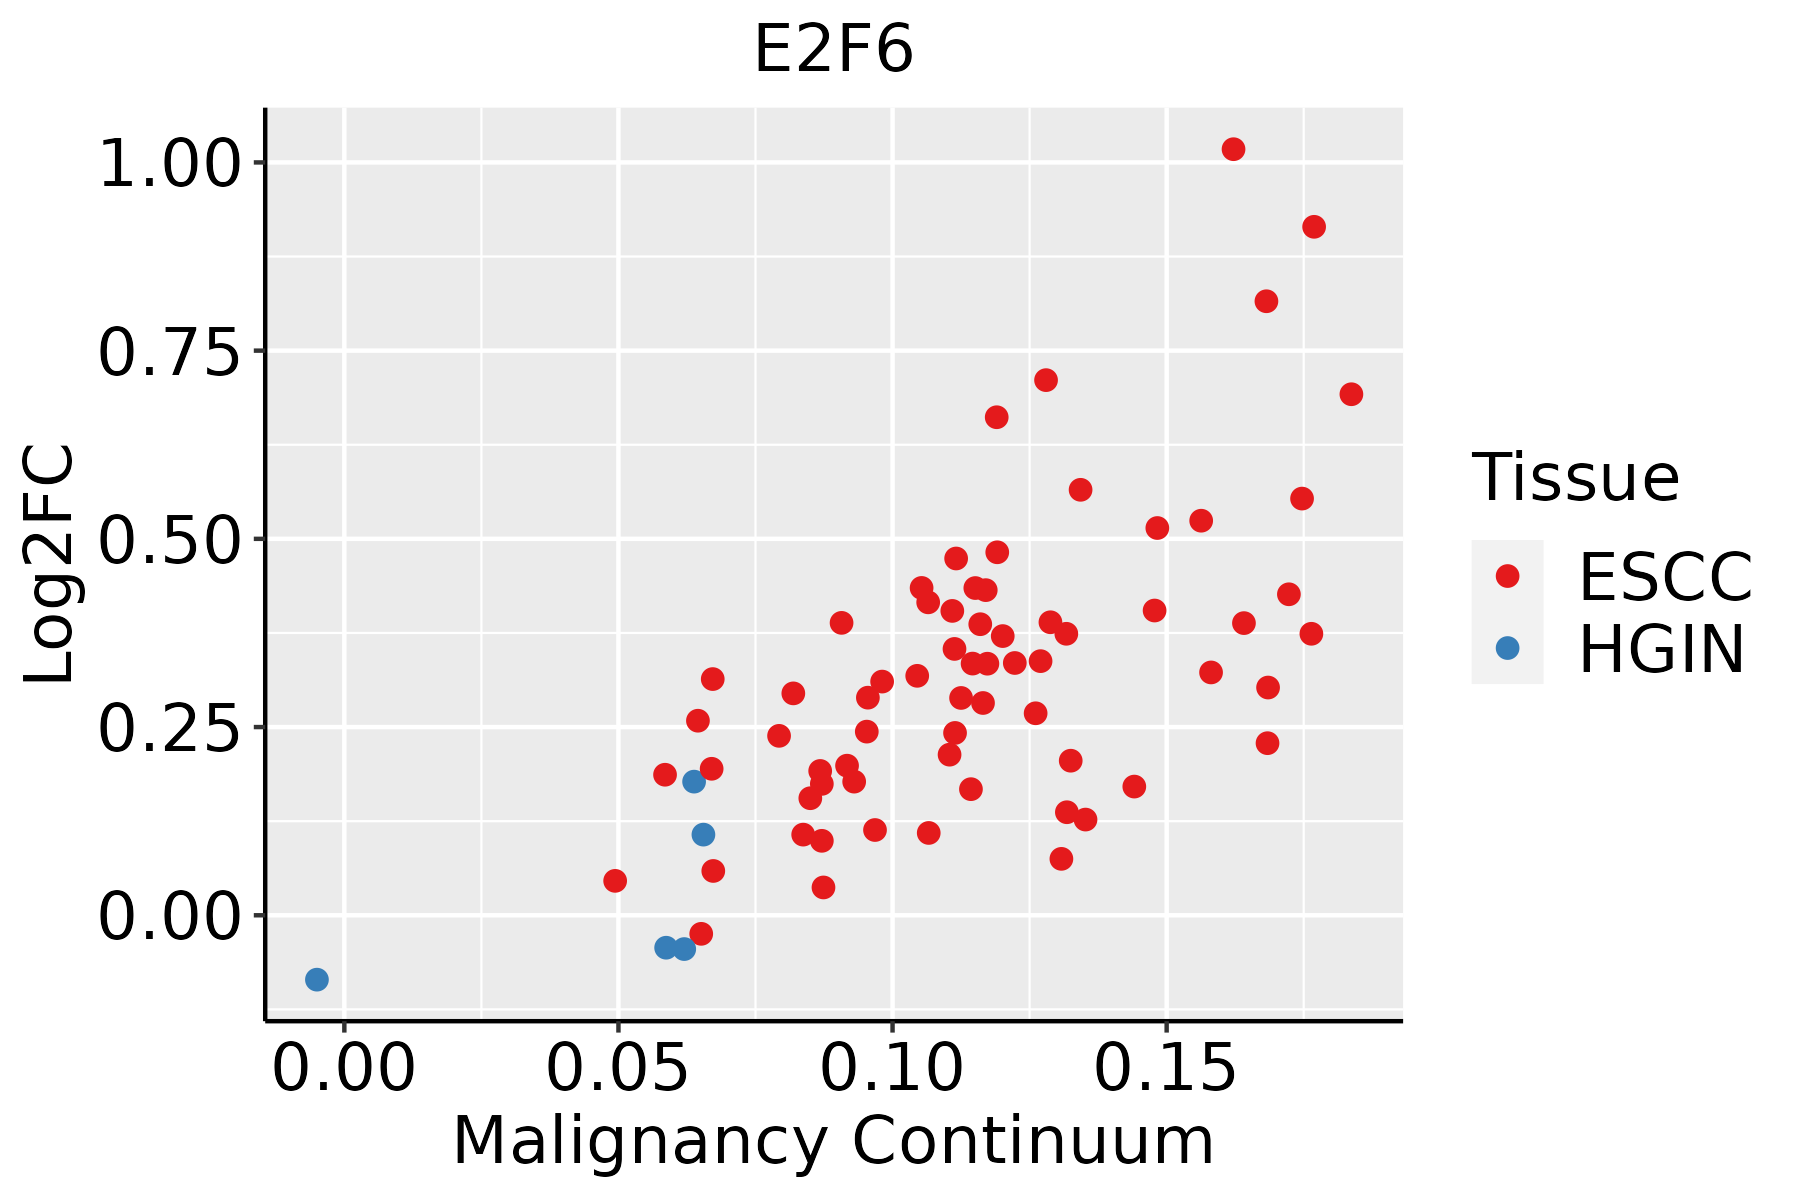 | ESCC: Esophageal squamous cell carcinoma |
| HGIN: High-grade intraepithelial neoplasias | ||
| LGIN: Low-grade intraepithelial neoplasias | ||
| Liver | 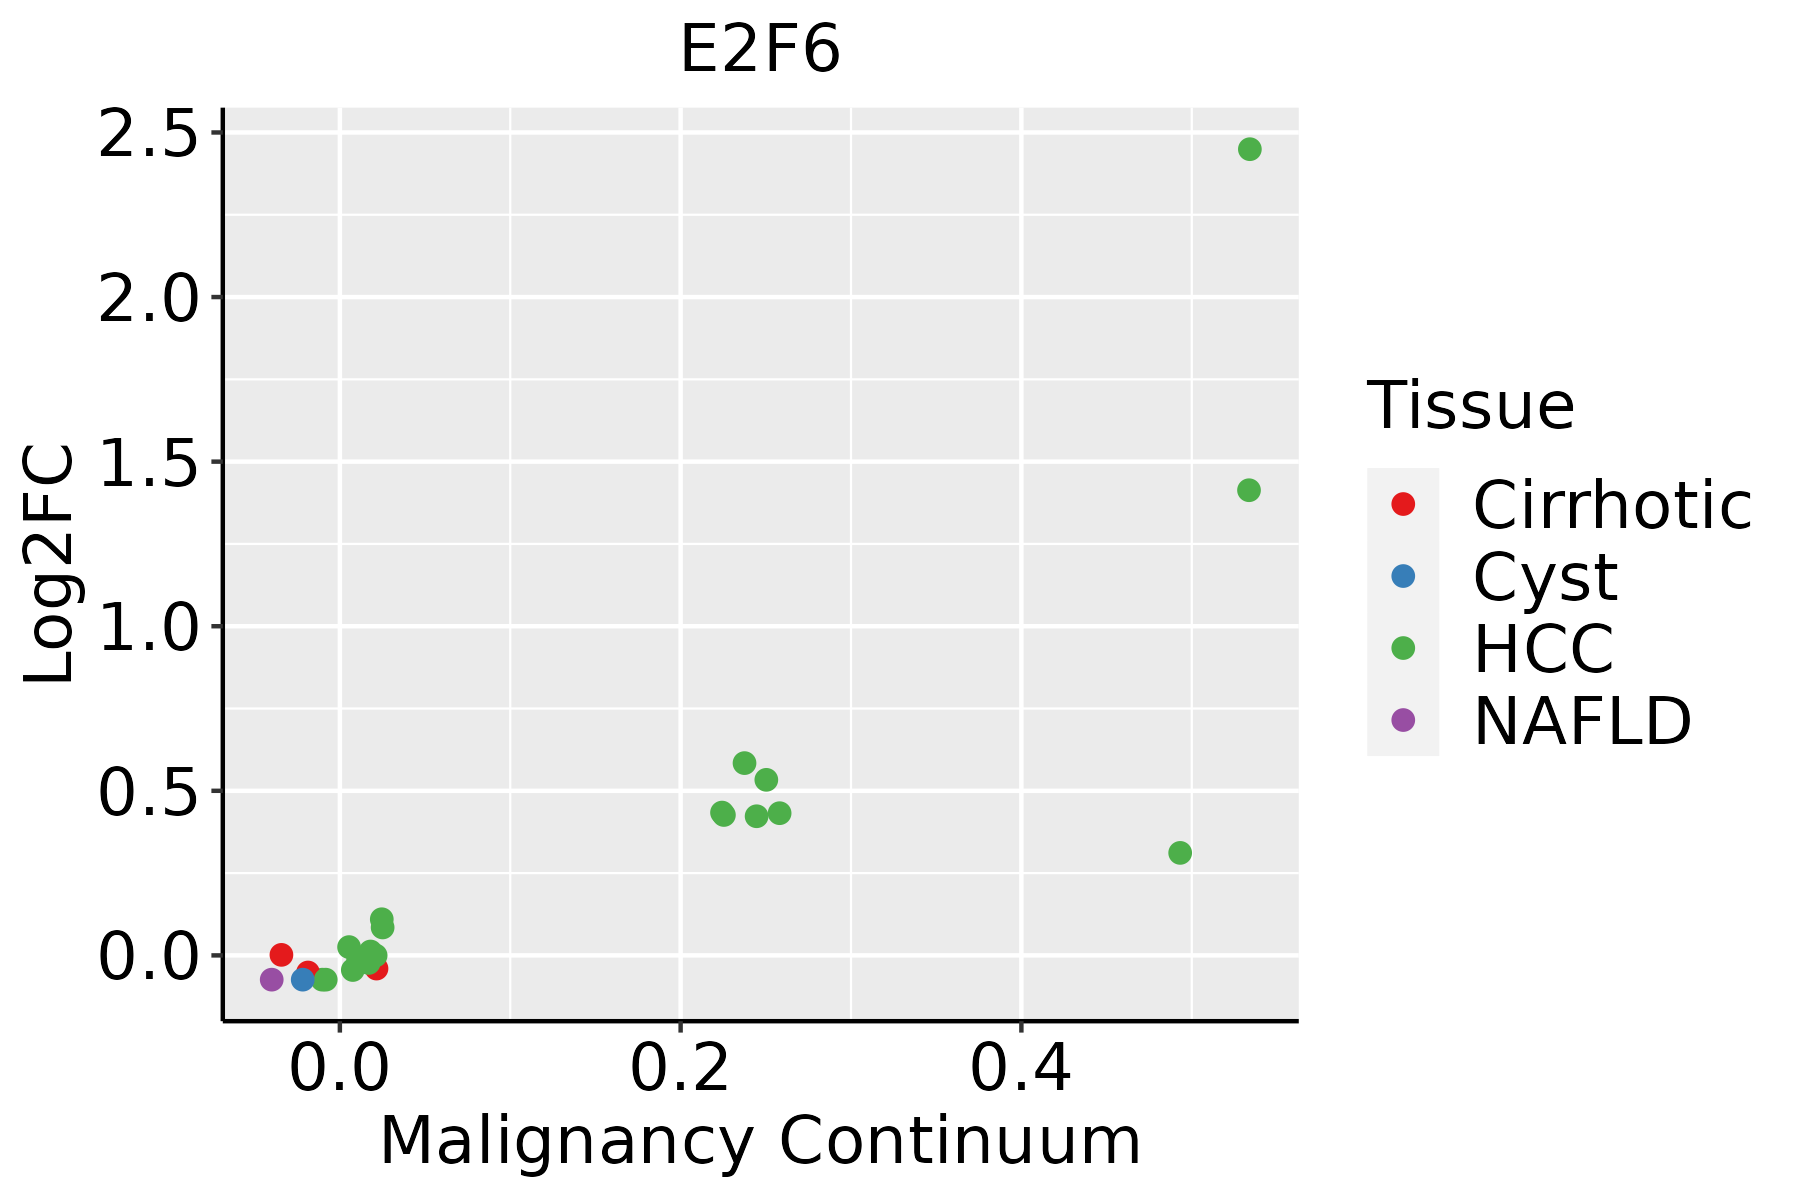 | HCC: Hepatocellular carcinoma |
| NAFLD: Non-alcoholic fatty liver disease | ||
| Oral Cavity |  | EOLP: Erosive Oral lichen planus |
| LP: leukoplakia | ||
| NEOLP: Non-erosive oral lichen planus | ||
| OSCC: Oral squamous cell carcinoma |
| ∗log2FC in expression of this searched gene in stem-like cells from each diseased tissue sample relative to stem-like cells in normal samples in each tissue plotted against the malignancy continuum. Samples are colored based on if they are from different disease stage. |
Top |
Malignant transformation related pathway analysis |
| Find out the enriched GO biological processes and KEGG pathways involved in transition from healthy to precancer to cancer |
| Tissue | Disease Stage | Enriched GO biological Processes |
| Colorectum | AD |  |
| Colorectum | SER |  |
| Colorectum | MSS |  |
| Colorectum | MSI-H |  |
| Colorectum | FAP |  |
| ∗Top 15 enriched GO BP terms are showed in the bar plot of each disease state in each tissue. Each row represents a significant GO biological process which is colored according to the -log10(p.adjust). |
| Page: 1 2 3 4 5 6 7 8 9 |
| GO ID | Tissue | Disease Stage | Description | Gene Ratio | Bg Ratio | pvalue | p.adjust | Count |
| GO:004477216 | Esophagus | ESCC | mitotic cell cycle phase transition | 281/8552 | 424/18723 | 4.63e-18 | 4.45e-16 | 281 |
| GO:000008214 | Esophagus | ESCC | G1/S transition of mitotic cell cycle | 134/8552 | 214/18723 | 4.04e-07 | 5.55e-06 | 134 |
| GO:004484314 | Esophagus | ESCC | cell cycle G1/S phase transition | 148/8552 | 241/18723 | 5.68e-07 | 7.48e-06 | 148 |
| GO:00447722 | Liver | HCC | mitotic cell cycle phase transition | 240/7958 | 424/18723 | 2.47e-09 | 6.84e-08 | 240 |
| GO:00448432 | Liver | HCC | cell cycle G1/S phase transition | 134/7958 | 241/18723 | 2.60e-05 | 2.70e-04 | 134 |
| GO:00000822 | Liver | HCC | G1/S transition of mitotic cell cycle | 119/7958 | 214/18723 | 7.11e-05 | 6.39e-04 | 119 |
| GO:00447728 | Oral cavity | OSCC | mitotic cell cycle phase transition | 255/7305 | 424/18723 | 5.29e-19 | 6.98e-17 | 255 |
| GO:00000826 | Oral cavity | OSCC | G1/S transition of mitotic cell cycle | 120/7305 | 214/18723 | 2.86e-07 | 4.40e-06 | 120 |
| GO:00448436 | Oral cavity | OSCC | cell cycle G1/S phase transition | 131/7305 | 241/18723 | 8.77e-07 | 1.20e-05 | 131 |
| GO:004477215 | Oral cavity | LP | mitotic cell cycle phase transition | 150/4623 | 424/18723 | 4.38e-07 | 1.23e-05 | 150 |
| GO:000008213 | Oral cavity | LP | G1/S transition of mitotic cell cycle | 80/4623 | 214/18723 | 2.30e-05 | 3.74e-04 | 80 |
| GO:004484313 | Oral cavity | LP | cell cycle G1/S phase transition | 88/4623 | 241/18723 | 2.62e-05 | 4.21e-04 | 88 |
| Page: 1 |
| Pathway ID | Tissue | Disease Stage | Description | Gene Ratio | Bg Ratio | pvalue | p.adjust | qvalue | Count |
| Page: 1 |
Top |
Cell-cell communication analysis |
| Identification of potential cell-cell interactions between two cell types and their ligand-receptor pairs for different disease states |
| Ligand | Receptor | LRpair | Pathway | Tissue | Disease Stage |
| Page: 1 |
Top |
Single-cell gene regulatory network inference analysis |
| Find out the significant the regulons (TFs) and the target genes of each regulon across cell types for different disease states |
| TF | Cell Type | Tissue | Disease Stage | Target Gene | RSS | Regulon Activity |
| E2F6 | QUIE | Esophagus | LGIN | PSPH,TNKS2,EML4, etc. | 4.70e-01 |  |
| ∗The dot plots of a searched regulon are shown for all cell subpopulations in each disease state of each tissue based on the regulon specific score inferred using pySCENIC and by calculating the average expression. |
| Page: 1 |
Top |
Somatic mutation of malignant transformation related genes |
| Annotation of somatic variants for genes involved in malignant transformation |
| Hugo Symbol | Variant Class | Variant Classification | dbSNP RS | HGVSc | HGVSp | HGVSp Short | SWISSPROT | BIOTYPE | SIFT | PolyPhen | Tumor Sample Barcode | Tissue | Histology | Sex | Age | Stage | Therapy Types | Drugs | Outcome |
| E2F6 | SNV | Missense_Mutation | rs765543732 | c.694N>A | p.Asp232Asn | p.D232N | O75461 | protein_coding | tolerated(0.17) | benign(0.098) | TCGA-AN-A046-01 | Breast | breast invasive carcinoma | Female | >=65 | I/II | Unknown | Unknown | SD |
| E2F6 | SNV | Missense_Mutation | novel | c.301N>T | p.Arg101Trp | p.R101W | O75461 | protein_coding | deleterious(0) | probably_damaging(0.999) | TCGA-BH-A0E7-01 | Breast | breast invasive carcinoma | Female | >=65 | I/II | Hormone Therapy | arimidex | SD |
| E2F6 | SNV | Missense_Mutation | c.125N>A | p.Ile42Asn | p.I42N | O75461 | protein_coding | tolerated(0.17) | possibly_damaging(0.753) | TCGA-CK-4951-01 | Colorectum | colon adenocarcinoma | Female | >=65 | I/II | Unknown | Unknown | PD | |
| E2F6 | SNV | Missense_Mutation | novel | c.391C>A | p.Leu131Ile | p.L131I | O75461 | protein_coding | tolerated(0.23) | benign(0.132) | TCGA-EI-6917-01 | Colorectum | rectum adenocarcinoma | Male | <65 | III/IV | Chemotherapy | 5fluorouracil+oxaciplatina+l-folinian | SD |
| E2F6 | insertion | Nonsense_Mutation | novel | c.224_225insCACATCCATCTAA | p.Met76ThrfsTer4 | p.M76Tfs*4 | O75461 | protein_coding | TCGA-AM-5820-01 | Colorectum | colon adenocarcinoma | Female | <65 | I/II | Unknown | Unknown | SD | ||
| E2F6 | SNV | Missense_Mutation | rs748327105 | c.595N>A | p.Val199Ile | p.V199I | O75461 | protein_coding | tolerated(0.14) | benign(0.303) | TCGA-A5-A0G1-01 | Endometrium | uterine corpus endometrioid carcinoma | Female | >=65 | I/II | Unknown | Unknown | SD |
| E2F6 | SNV | Missense_Mutation | rs765543732 | c.694N>A | p.Asp232Asn | p.D232N | O75461 | protein_coding | tolerated(0.17) | benign(0.098) | TCGA-A5-A0G2-01 | Endometrium | uterine corpus endometrioid carcinoma | Female | <65 | III/IV | Unknown | Unknown | SD |
| E2F6 | SNV | Missense_Mutation | novel | c.224N>G | p.Phe75Cys | p.F75C | O75461 | protein_coding | deleterious(0) | probably_damaging(1) | TCGA-A5-A2K5-01 | Endometrium | uterine corpus endometrioid carcinoma | Female | >=65 | I/II | Unknown | Unknown | SD |
| E2F6 | SNV | Missense_Mutation | novel | c.161N>T | p.Arg54Ile | p.R54I | O75461 | protein_coding | tolerated(0.11) | benign(0.027) | TCGA-A5-A2K5-01 | Endometrium | uterine corpus endometrioid carcinoma | Female | >=65 | I/II | Unknown | Unknown | SD |
| E2F6 | SNV | Missense_Mutation | novel | c.591N>T | p.Gln197His | p.Q197H | O75461 | protein_coding | deleterious(0) | benign(0.437) | TCGA-AJ-A5DW-01 | Endometrium | uterine corpus endometrioid carcinoma | Female | <65 | I/II | Unknown | Unknown | SD |
| Page: 1 2 3 |
Top |
Related drugs of malignant transformation related genes |
| Identification of chemicals and drugs interact with genes involved in malignant transfromation |
| (DGIdb 4.0) |
| Entrez ID | Symbol | Category | Interaction Types | Drug Claim Name | Drug Name | PMIDs |
| Page: 1 |

Copyright 2023-Present -The University of Texas Health Science Center at Houston |