
|
|||||
|
 | |
| |
| |
| |
| |
| |
|
Gene: E2F4 |
Gene summary for E2F4 |
| Gene information | Species | Human | Gene symbol | E2F4 | Gene ID | 1874 |
| Gene name | E2F transcription factor 4 | |
| Gene Alias | E2F-4 | |
| Cytomap | 16q22.1 | |
| Gene Type | protein-coding | GO ID | GO:0000082 | UniProtAcc | Q16254 |
Top |
Malignant transformation analysis |
| Identification of the aberrant gene expression in precancerous and cancerous lesions by comparing the gene expression of stem-like cells in diseased tissues with normal stem cells |
| Entrez ID | Symbol | Replicates | Species | Organ | Tissue | Adj P-value | Log2FC | Malignancy |
| 1874 | E2F4 | LZE4T | Human | Esophagus | ESCC | 1.48e-03 | 3.12e-02 | 0.0811 |
| 1874 | E2F4 | LZE7T | Human | Esophagus | ESCC | 7.59e-08 | 4.21e-01 | 0.0667 |
| 1874 | E2F4 | LZE20T | Human | Esophagus | ESCC | 2.43e-08 | 1.40e-01 | 0.0662 |
| 1874 | E2F4 | LZE22T | Human | Esophagus | ESCC | 6.52e-10 | 3.15e-01 | 0.068 |
| 1874 | E2F4 | LZE24T | Human | Esophagus | ESCC | 1.85e-14 | 3.15e-01 | 0.0596 |
| 1874 | E2F4 | P1T-E | Human | Esophagus | ESCC | 2.77e-06 | 4.55e-01 | 0.0875 |
| 1874 | E2F4 | P2T-E | Human | Esophagus | ESCC | 2.72e-18 | 4.13e-01 | 0.1177 |
| 1874 | E2F4 | P4T-E | Human | Esophagus | ESCC | 5.18e-25 | 6.68e-01 | 0.1323 |
| 1874 | E2F4 | P5T-E | Human | Esophagus | ESCC | 1.63e-25 | 4.50e-01 | 0.1327 |
| 1874 | E2F4 | P8T-E | Human | Esophagus | ESCC | 4.07e-26 | 4.64e-01 | 0.0889 |
| 1874 | E2F4 | P9T-E | Human | Esophagus | ESCC | 3.47e-06 | 2.56e-01 | 0.1131 |
| 1874 | E2F4 | P10T-E | Human | Esophagus | ESCC | 4.66e-18 | 2.73e-01 | 0.116 |
| 1874 | E2F4 | P11T-E | Human | Esophagus | ESCC | 5.74e-08 | 5.74e-01 | 0.1426 |
| 1874 | E2F4 | P12T-E | Human | Esophagus | ESCC | 9.39e-17 | 2.47e-01 | 0.1122 |
| 1874 | E2F4 | P15T-E | Human | Esophagus | ESCC | 6.83e-17 | 4.30e-01 | 0.1149 |
| 1874 | E2F4 | P16T-E | Human | Esophagus | ESCC | 2.15e-08 | 1.17e-01 | 0.1153 |
| 1874 | E2F4 | P17T-E | Human | Esophagus | ESCC | 4.03e-05 | 2.73e-01 | 0.1278 |
| 1874 | E2F4 | P19T-E | Human | Esophagus | ESCC | 1.63e-03 | 5.23e-01 | 0.1662 |
| 1874 | E2F4 | P20T-E | Human | Esophagus | ESCC | 1.26e-11 | 2.58e-01 | 0.1124 |
| 1874 | E2F4 | P21T-E | Human | Esophagus | ESCC | 2.09e-29 | 5.38e-01 | 0.1617 |
| Page: 1 2 3 4 5 |
| Tissue | Expression Dynamics | Abbreviation |
| Esophagus | 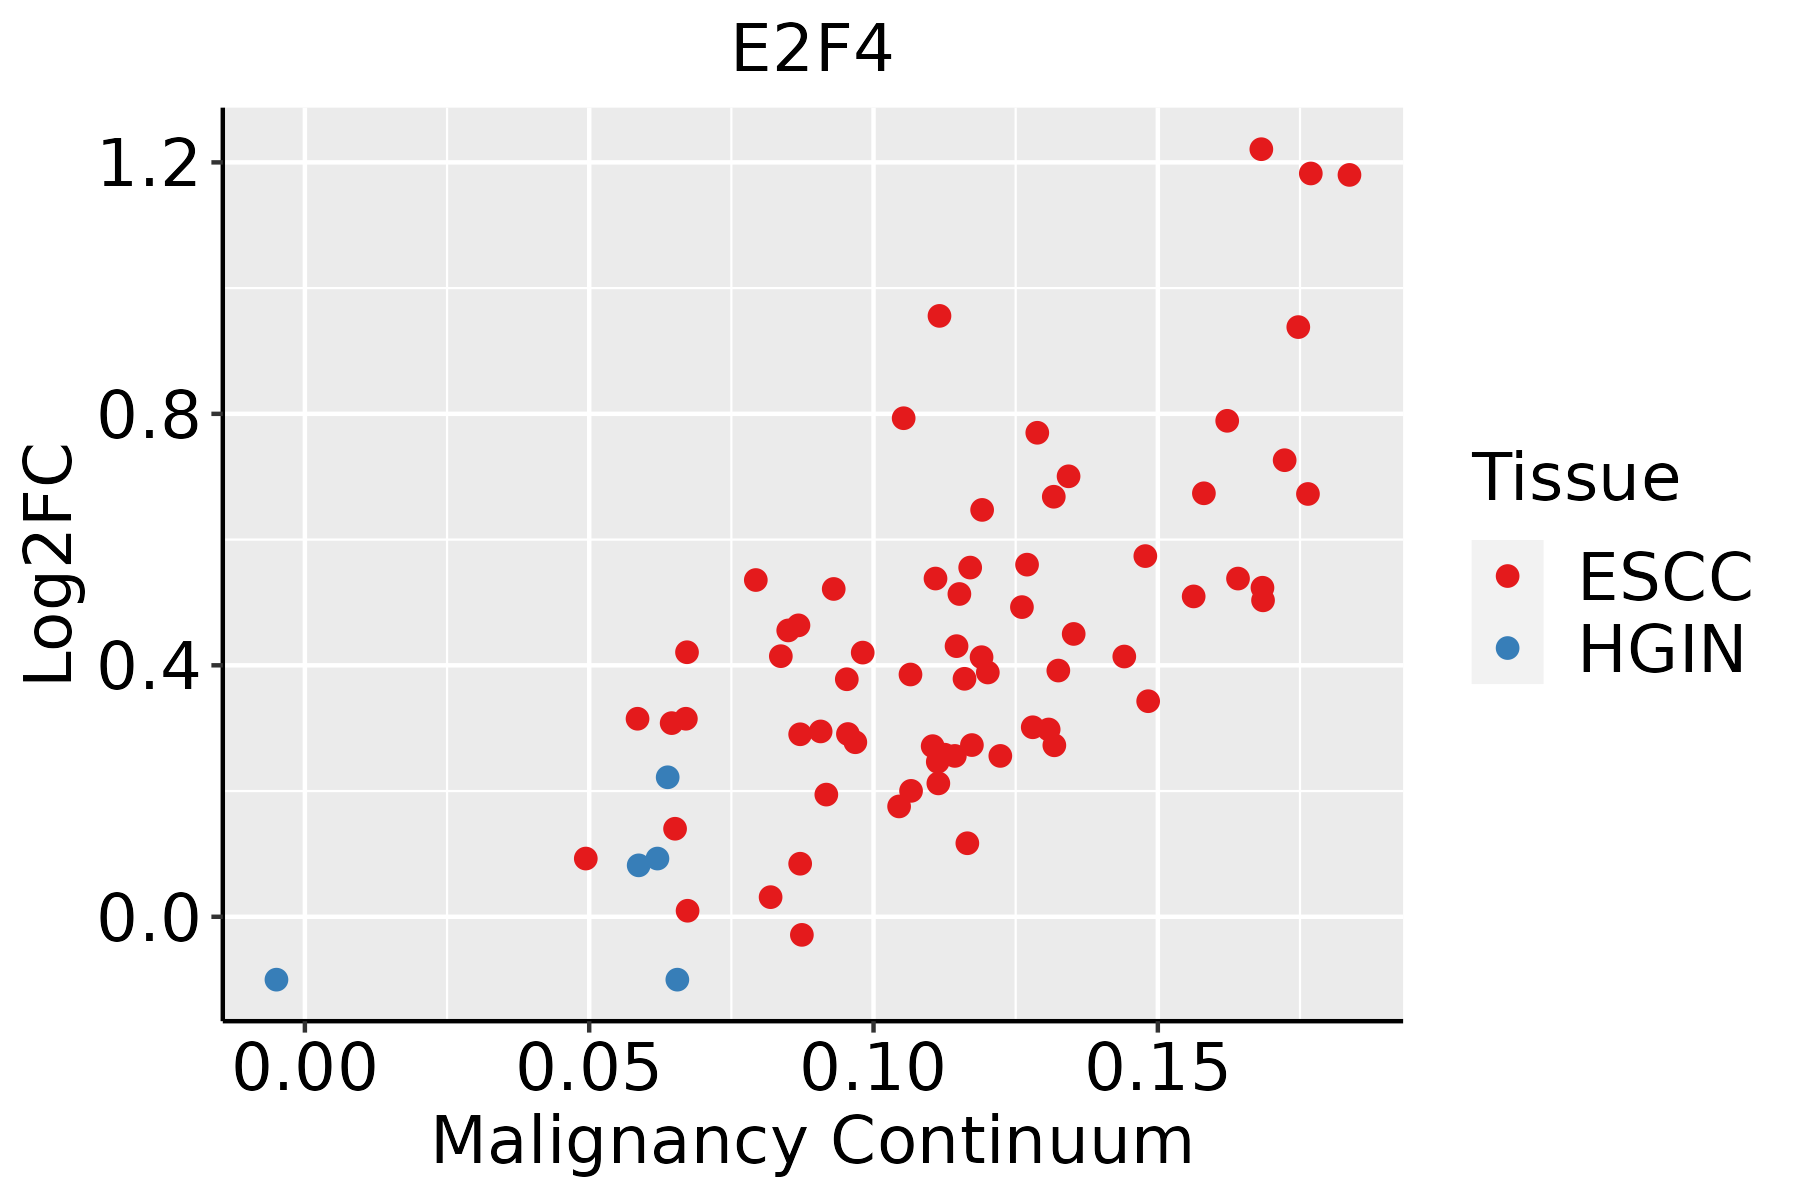 | ESCC: Esophageal squamous cell carcinoma |
| HGIN: High-grade intraepithelial neoplasias | ||
| LGIN: Low-grade intraepithelial neoplasias | ||
| Liver | 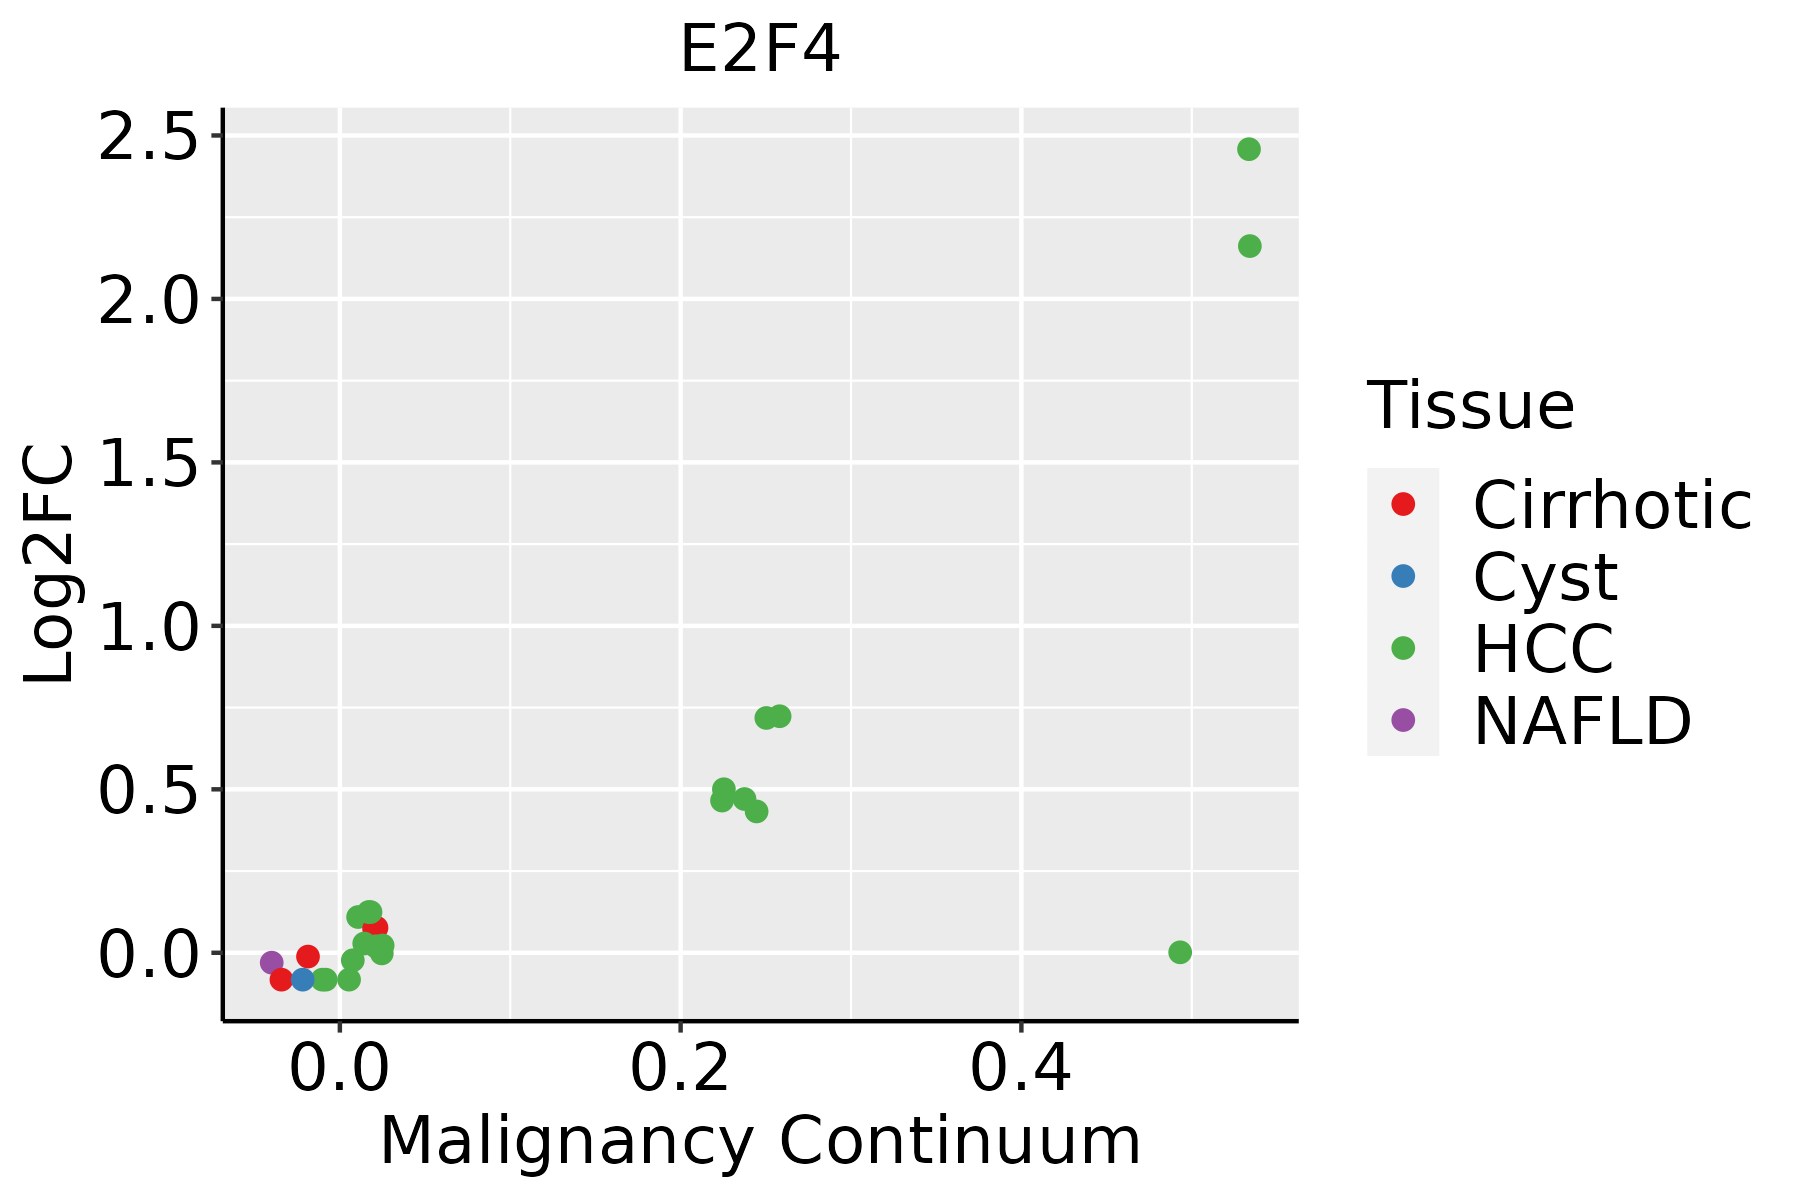 | HCC: Hepatocellular carcinoma |
| NAFLD: Non-alcoholic fatty liver disease | ||
| Oral Cavity | 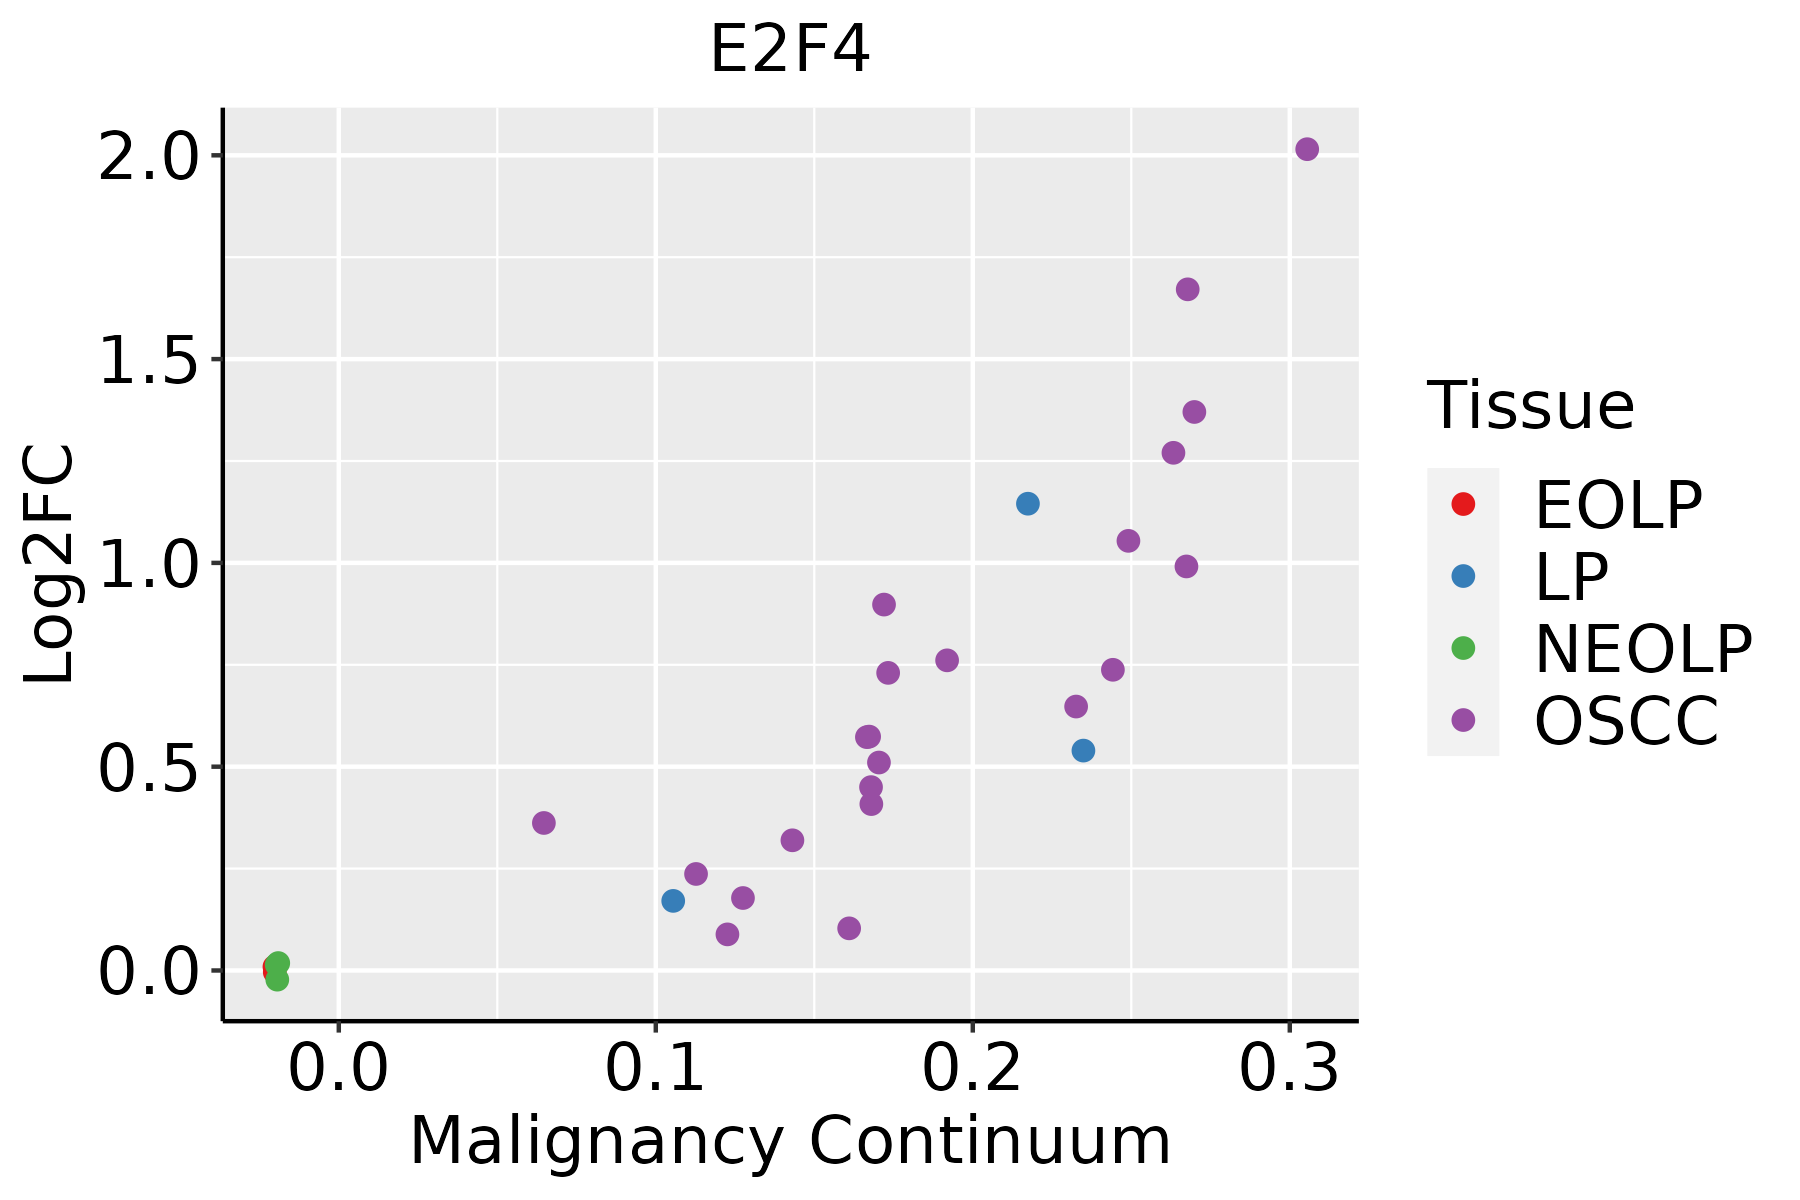 | EOLP: Erosive Oral lichen planus |
| LP: leukoplakia | ||
| NEOLP: Non-erosive oral lichen planus | ||
| OSCC: Oral squamous cell carcinoma | ||
| Skin | 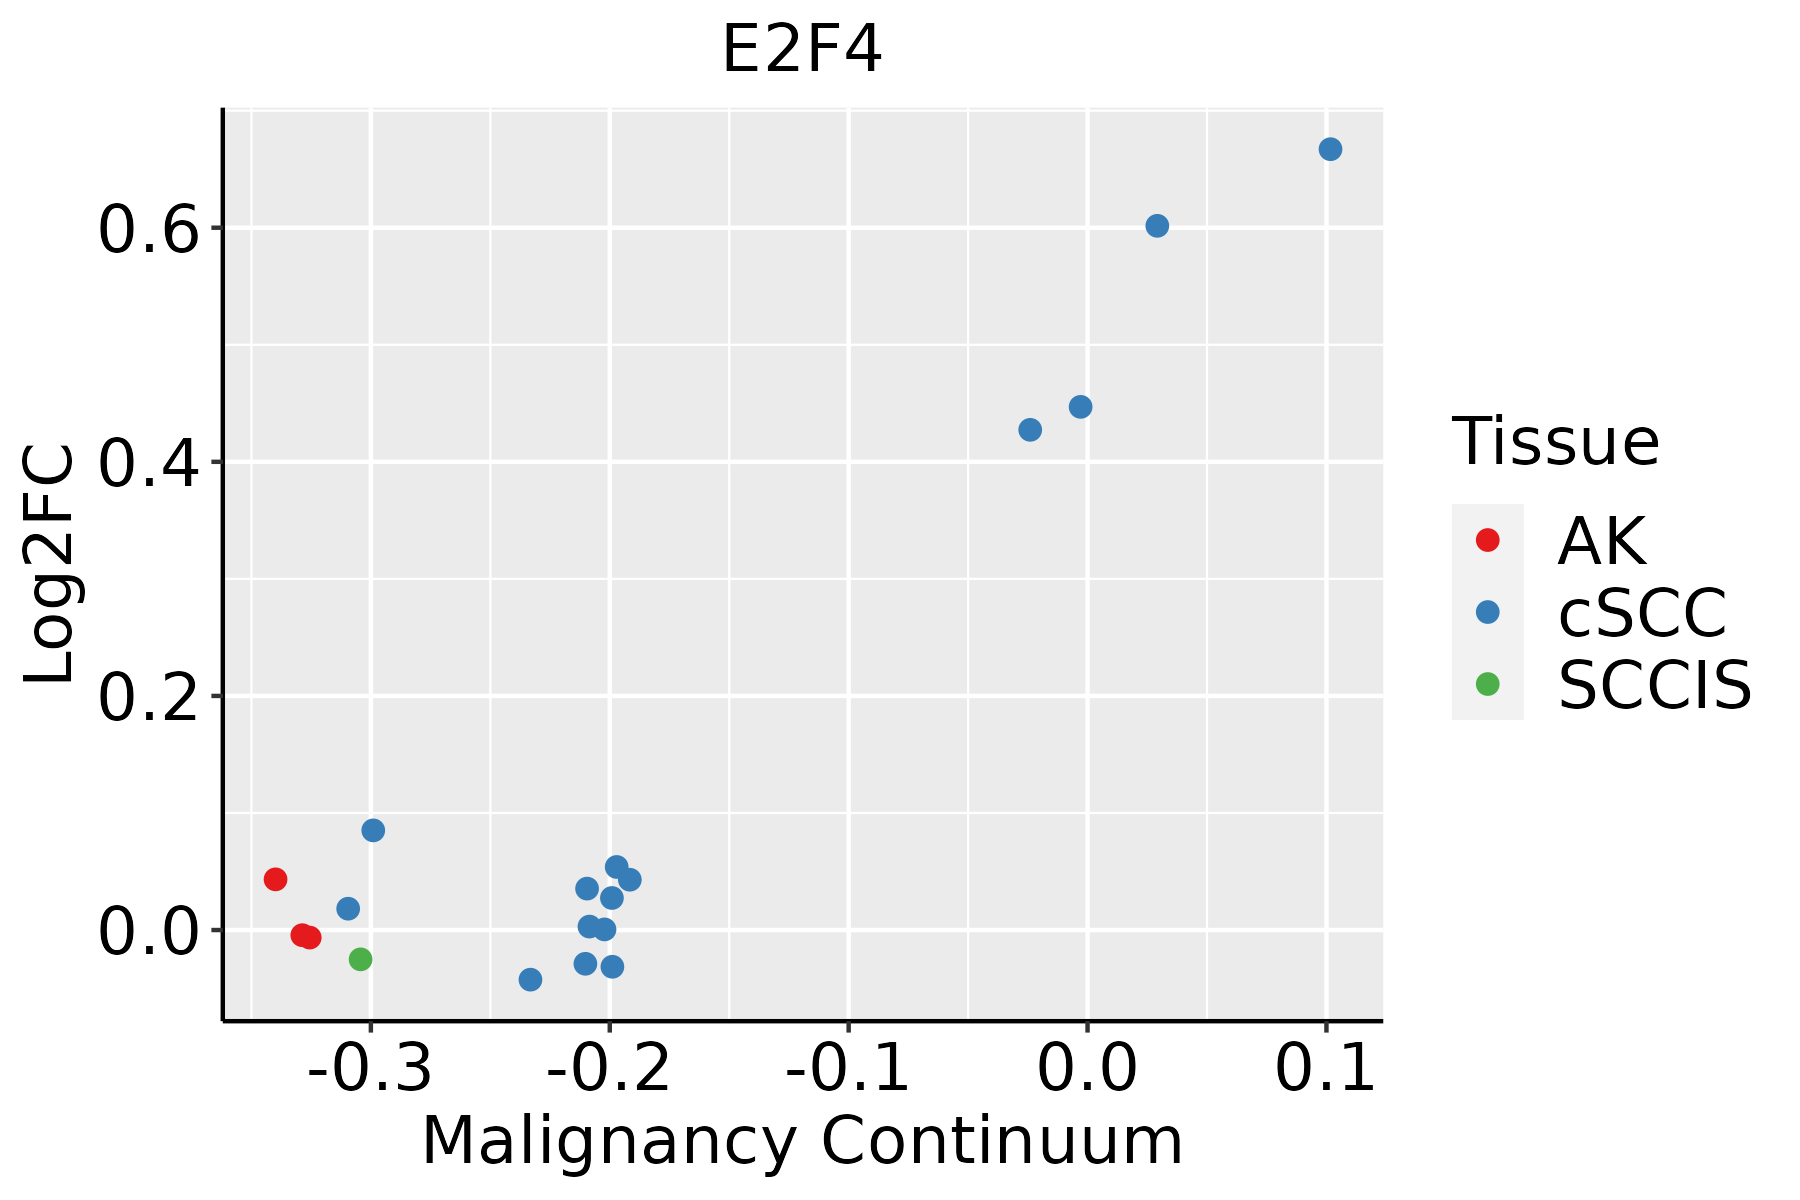 | AK: Actinic keratosis |
| cSCC: Cutaneous squamous cell carcinoma | ||
| SCCIS:squamous cell carcinoma in situ |
| ∗log2FC in expression of this searched gene in stem-like cells from each diseased tissue sample relative to stem-like cells in normal samples in each tissue plotted against the malignancy continuum. Samples are colored based on if they are from different disease stage. |
Top |
Malignant transformation related pathway analysis |
| Find out the enriched GO biological processes and KEGG pathways involved in transition from healthy to precancer to cancer |
| Tissue | Disease Stage | Enriched GO biological Processes |
| Colorectum | AD |  |
| Colorectum | SER |  |
| Colorectum | MSS |  |
| Colorectum | MSI-H |  |
| Colorectum | FAP |  |
| ∗Top 15 enriched GO BP terms are showed in the bar plot of each disease state in each tissue. Each row represents a significant GO biological process which is colored according to the -log10(p.adjust). |
| Page: 1 2 3 4 5 6 7 8 9 |
| GO ID | Tissue | Disease Stage | Description | Gene Ratio | Bg Ratio | pvalue | p.adjust | Count |
| GO:004477216 | Esophagus | ESCC | mitotic cell cycle phase transition | 281/8552 | 424/18723 | 4.63e-18 | 4.45e-16 | 281 |
| GO:003253520 | Esophagus | ESCC | regulation of cellular component size | 227/8552 | 383/18723 | 4.77e-08 | 8.60e-07 | 227 |
| GO:000008214 | Esophagus | ESCC | G1/S transition of mitotic cell cycle | 134/8552 | 214/18723 | 4.04e-07 | 5.55e-06 | 134 |
| GO:004484314 | Esophagus | ESCC | cell cycle G1/S phase transition | 148/8552 | 241/18723 | 5.68e-07 | 7.48e-06 | 148 |
| GO:000206420 | Esophagus | ESCC | epithelial cell development | 136/8552 | 220/18723 | 9.50e-07 | 1.21e-05 | 136 |
| GO:00310233 | Esophagus | ESCC | microtubule organizing center organization | 92/8552 | 143/18723 | 5.04e-06 | 5.31e-05 | 92 |
| GO:00083619 | Esophagus | ESCC | regulation of cell size | 107/8552 | 181/18723 | 1.81e-04 | 1.16e-03 | 107 |
| GO:003253512 | Liver | Cirrhotic | regulation of cellular component size | 135/4634 | 383/18723 | 2.32e-06 | 4.26e-05 | 135 |
| GO:000206412 | Liver | Cirrhotic | epithelial cell development | 80/4634 | 220/18723 | 7.63e-05 | 8.44e-04 | 80 |
| GO:00447721 | Liver | Cirrhotic | mitotic cell cycle phase transition | 139/4634 | 424/18723 | 1.02e-04 | 1.06e-03 | 139 |
| GO:00000821 | Liver | Cirrhotic | G1/S transition of mitotic cell cycle | 72/4634 | 214/18723 | 2.07e-03 | 1.28e-02 | 72 |
| GO:00448431 | Liver | Cirrhotic | cell cycle G1/S phase transition | 77/4634 | 241/18723 | 6.68e-03 | 3.30e-02 | 77 |
| GO:00447722 | Liver | HCC | mitotic cell cycle phase transition | 240/7958 | 424/18723 | 2.47e-09 | 6.84e-08 | 240 |
| GO:003253522 | Liver | HCC | regulation of cellular component size | 217/7958 | 383/18723 | 1.28e-08 | 3.14e-07 | 217 |
| GO:00448432 | Liver | HCC | cell cycle G1/S phase transition | 134/7958 | 241/18723 | 2.60e-05 | 2.70e-04 | 134 |
| GO:00000822 | Liver | HCC | G1/S transition of mitotic cell cycle | 119/7958 | 214/18723 | 7.11e-05 | 6.39e-04 | 119 |
| GO:0031023 | Liver | HCC | microtubule organizing center organization | 82/7958 | 143/18723 | 2.38e-04 | 1.79e-03 | 82 |
| GO:000206422 | Liver | HCC | epithelial cell development | 114/7958 | 220/18723 | 3.19e-03 | 1.47e-02 | 114 |
| GO:00083614 | Liver | HCC | regulation of cell size | 95/7958 | 181/18723 | 4.15e-03 | 1.81e-02 | 95 |
| GO:00447728 | Oral cavity | OSCC | mitotic cell cycle phase transition | 255/7305 | 424/18723 | 5.29e-19 | 6.98e-17 | 255 |
| Page: 1 2 |
| Pathway ID | Tissue | Disease Stage | Description | Gene Ratio | Bg Ratio | pvalue | p.adjust | qvalue | Count |
| hsa0411023 | Esophagus | ESCC | Cell cycle | 126/4205 | 157/8465 | 1.34e-15 | 5.60e-14 | 2.87e-14 | 126 |
| hsa0421829 | Esophagus | ESCC | Cellular senescence | 119/4205 | 156/8465 | 5.89e-12 | 9.40e-11 | 4.81e-11 | 119 |
| hsa043507 | Esophagus | ESCC | TGF-beta signaling pathway | 69/4205 | 108/8465 | 1.92e-03 | 5.54e-03 | 2.84e-03 | 69 |
| hsa0411033 | Esophagus | ESCC | Cell cycle | 126/4205 | 157/8465 | 1.34e-15 | 5.60e-14 | 2.87e-14 | 126 |
| hsa0421838 | Esophagus | ESCC | Cellular senescence | 119/4205 | 156/8465 | 5.89e-12 | 9.40e-11 | 4.81e-11 | 119 |
| hsa0435014 | Esophagus | ESCC | TGF-beta signaling pathway | 69/4205 | 108/8465 | 1.92e-03 | 5.54e-03 | 2.84e-03 | 69 |
| hsa042187 | Liver | Cirrhotic | Cellular senescence | 66/2530 | 156/8465 | 5.94e-04 | 3.60e-03 | 2.22e-03 | 66 |
| hsa041104 | Liver | Cirrhotic | Cell cycle | 61/2530 | 157/8465 | 9.53e-03 | 3.21e-02 | 1.98e-02 | 61 |
| hsa0421812 | Liver | Cirrhotic | Cellular senescence | 66/2530 | 156/8465 | 5.94e-04 | 3.60e-03 | 2.22e-03 | 66 |
| hsa0411011 | Liver | Cirrhotic | Cell cycle | 61/2530 | 157/8465 | 9.53e-03 | 3.21e-02 | 1.98e-02 | 61 |
| hsa041102 | Liver | HCC | Cell cycle | 106/4020 | 157/8465 | 2.54e-07 | 3.04e-06 | 1.69e-06 | 106 |
| hsa0421822 | Liver | HCC | Cellular senescence | 102/4020 | 156/8465 | 4.18e-06 | 3.59e-05 | 2.00e-05 | 102 |
| hsa041103 | Liver | HCC | Cell cycle | 106/4020 | 157/8465 | 2.54e-07 | 3.04e-06 | 1.69e-06 | 106 |
| hsa0421832 | Liver | HCC | Cellular senescence | 102/4020 | 156/8465 | 4.18e-06 | 3.59e-05 | 2.00e-05 | 102 |
| hsa041108 | Oral cavity | OSCC | Cell cycle | 118/3704 | 157/8465 | 7.15e-16 | 2.66e-14 | 1.35e-14 | 118 |
| hsa0421820 | Oral cavity | OSCC | Cellular senescence | 112/3704 | 156/8465 | 8.04e-13 | 1.42e-11 | 7.21e-12 | 112 |
| hsa043506 | Oral cavity | OSCC | TGF-beta signaling pathway | 60/3704 | 108/8465 | 8.66e-03 | 1.97e-02 | 1.00e-02 | 60 |
| hsa0411015 | Oral cavity | OSCC | Cell cycle | 118/3704 | 157/8465 | 7.15e-16 | 2.66e-14 | 1.35e-14 | 118 |
| hsa04218110 | Oral cavity | OSCC | Cellular senescence | 112/3704 | 156/8465 | 8.04e-13 | 1.42e-11 | 7.21e-12 | 112 |
| hsa0435013 | Oral cavity | OSCC | TGF-beta signaling pathway | 60/3704 | 108/8465 | 8.66e-03 | 1.97e-02 | 1.00e-02 | 60 |
| Page: 1 2 |
Top |
Cell-cell communication analysis |
| Identification of potential cell-cell interactions between two cell types and their ligand-receptor pairs for different disease states |
| Ligand | Receptor | LRpair | Pathway | Tissue | Disease Stage |
| Page: 1 |
Top |
Single-cell gene regulatory network inference analysis |
| Find out the significant the regulons (TFs) and the target genes of each regulon across cell types for different disease states |
| TF | Cell Type | Tissue | Disease Stage | Target Gene | RSS | Regulon Activity |
| E2F4 | CD8TEFF | Cervix | N_HPV | AL135818.1,CLEC2B,LRRC61, etc. | 2.64e-01 |  |
| E2F4 | GDT | Thyroid | ADJ | YBEY,BIVM,PYGO2, etc. | 1.54e-01 |  |
| E2F4 | CD8TEFF | Thyroid | ATC | YBEY,BIVM,PYGO2, etc. | 2.10e-01 |  |
| ∗The dot plots of a searched regulon are shown for all cell subpopulations in each disease state of each tissue based on the regulon specific score inferred using pySCENIC and by calculating the average expression. |
| Page: 1 |
Top |
Somatic mutation of malignant transformation related genes |
| Annotation of somatic variants for genes involved in malignant transformation |
| Hugo Symbol | Variant Class | Variant Classification | dbSNP RS | HGVSc | HGVSp | HGVSp Short | SWISSPROT | BIOTYPE | SIFT | PolyPhen | Tumor Sample Barcode | Tissue | Histology | Sex | Age | Stage | Therapy Types | Drugs | Outcome |
| E2F4 | SNV | Missense_Mutation | novel | c.295G>A | p.Glu99Lys | p.E99K | Q16254 | protein_coding | tolerated(0.3) | benign(0.073) | TCGA-A8-A094-01 | Breast | breast invasive carcinoma | Female | >=65 | I/II | Unknown | Unknown | SD |
| E2F4 | insertion | In_Frame_Ins | novel | c.935_936insCAGCAT | p.Ser313_Ser314insIleSer | p.S313_S314insIS | Q16254 | protein_coding | TCGA-C5-A3HD-01 | Cervix | cervical & endocervical cancer | Female | <65 | I/II | Chemotherapy | cisplatin | SD | ||
| E2F4 | SNV | Missense_Mutation | novel | c.949A>G | p.Ser317Gly | p.S317G | Q16254 | protein_coding | tolerated(0.5) | benign(0.264) | TCGA-AZ-5407-01 | Colorectum | colon adenocarcinoma | Female | <65 | I/II | Unknown | Unknown | SD |
| E2F4 | SNV | Missense_Mutation | novel | c.183N>G | p.Ile61Met | p.I61M | Q16254 | protein_coding | deleterious(0) | probably_damaging(0.999) | TCGA-F5-6814-01 | Colorectum | rectum adenocarcinoma | Male | <65 | I/II | Unknown | Unknown | SD |
| E2F4 | SNV | Missense_Mutation | novel | c.640N>T | p.Asp214Tyr | p.D214Y | Q16254 | protein_coding | deleterious(0) | probably_damaging(0.915) | TCGA-A5-A0G2-01 | Endometrium | uterine corpus endometrioid carcinoma | Female | <65 | III/IV | Unknown | Unknown | SD |
| E2F4 | SNV | Missense_Mutation | c.1147N>G | p.Leu383Val | p.L383V | Q16254 | protein_coding | deleterious(0) | probably_damaging(0.987) | TCGA-A5-A0GQ-01 | Endometrium | uterine corpus endometrioid carcinoma | Female | >=65 | I/II | Unknown | Unknown | SD | |
| E2F4 | SNV | Missense_Mutation | rs367663947 | c.1145N>A | p.Arg382His | p.R382H | Q16254 | protein_coding | deleterious(0.01) | probably_damaging(0.994) | TCGA-AP-A059-01 | Endometrium | uterine corpus endometrioid carcinoma | Female | >=65 | I/II | Unknown | Unknown | SD |
| E2F4 | SNV | Missense_Mutation | c.944G>C | p.Ser315Thr | p.S315T | Q16254 | protein_coding | tolerated(0.25) | benign(0.007) | TCGA-AP-A05J-01 | Endometrium | uterine corpus endometrioid carcinoma | Female | >=65 | I/II | Chemotherapy | carboplatin | SD | |
| E2F4 | SNV | Missense_Mutation | novel | c.1098N>T | p.Glu366Asp | p.E366D | Q16254 | protein_coding | tolerated(1) | benign(0) | TCGA-AX-A2HD-01 | Endometrium | uterine corpus endometrioid carcinoma | Female | >=65 | III/IV | Unknown | Unknown | SD |
| E2F4 | SNV | Missense_Mutation | novel | c.653N>A | p.Ser218Asn | p.S218N | Q16254 | protein_coding | tolerated(0.51) | benign(0) | TCGA-AX-A3G8-01 | Endometrium | uterine corpus endometrioid carcinoma | Female | >=65 | I/II | Unknown | Unknown | SD |
| Page: 1 2 3 |
Top |
Related drugs of malignant transformation related genes |
| Identification of chemicals and drugs interact with genes involved in malignant transfromation |
| (DGIdb 4.0) |
| Entrez ID | Symbol | Category | Interaction Types | Drug Claim Name | Drug Name | PMIDs |
| Page: 1 |

Copyright 2023-Present -The University of Texas Health Science Center at Houston |