
|
|||||
|
 | |
| |
| |
| |
| |
| |
|
Gene: E2F3 |
Gene summary for E2F3 |
| Gene information | Species | Human | Gene symbol | E2F3 | Gene ID | 1871 |
| Gene name | E2F transcription factor 3 | |
| Gene Alias | E2F-3 | |
| Cytomap | 6p22.3 | |
| Gene Type | protein-coding | GO ID | GO:0000082 | UniProtAcc | O00716 |
Top |
Malignant transformation analysis |
| Identification of the aberrant gene expression in precancerous and cancerous lesions by comparing the gene expression of stem-like cells in diseased tissues with normal stem cells |
| Entrez ID | Symbol | Replicates | Species | Organ | Tissue | Adj P-value | Log2FC | Malignancy |
| 1871 | E2F3 | CCI_1 | Human | Cervix | CC | 1.52e-06 | 5.52e-01 | 0.528 |
| 1871 | E2F3 | CCI_2 | Human | Cervix | CC | 4.34e-11 | 8.19e-01 | 0.5249 |
| 1871 | E2F3 | CCI_3 | Human | Cervix | CC | 8.39e-12 | 6.92e-01 | 0.516 |
| 1871 | E2F3 | HTA11_3410_2000001011 | Human | Colorectum | AD | 7.52e-09 | -4.28e-01 | 0.0155 |
| 1871 | E2F3 | HTA11_78_2000001011 | Human | Colorectum | AD | 1.60e-03 | -3.55e-01 | -0.1088 |
| 1871 | E2F3 | HTA11_3361_2000001011 | Human | Colorectum | AD | 3.72e-03 | -4.63e-01 | -0.1207 |
| 1871 | E2F3 | HTA11_696_2000001011 | Human | Colorectum | AD | 2.39e-05 | -3.88e-01 | -0.1464 |
| 1871 | E2F3 | HTA11_866_2000001011 | Human | Colorectum | AD | 2.44e-02 | -3.04e-01 | -0.1001 |
| 1871 | E2F3 | HTA11_866_3004761011 | Human | Colorectum | AD | 7.45e-03 | -3.64e-01 | 0.096 |
| 1871 | E2F3 | HTA11_7696_3000711011 | Human | Colorectum | AD | 9.51e-08 | -3.53e-01 | 0.0674 |
| 1871 | E2F3 | HTA11_99999971662_82457 | Human | Colorectum | MSS | 9.07e-04 | -3.16e-01 | 0.3859 |
| 1871 | E2F3 | HTA11_99999974143_84620 | Human | Colorectum | MSS | 2.92e-05 | -3.88e-01 | 0.3005 |
| 1871 | E2F3 | A001-C-207 | Human | Colorectum | FAP | 7.60e-03 | -2.73e-01 | 0.1278 |
| 1871 | E2F3 | A015-C-203 | Human | Colorectum | FAP | 2.07e-25 | -4.04e-01 | -0.1294 |
| 1871 | E2F3 | A015-C-204 | Human | Colorectum | FAP | 7.06e-06 | -3.42e-01 | -0.0228 |
| 1871 | E2F3 | A014-C-040 | Human | Colorectum | FAP | 1.44e-07 | -5.97e-01 | -0.1184 |
| 1871 | E2F3 | A002-C-201 | Human | Colorectum | FAP | 1.48e-08 | -2.65e-01 | 0.0324 |
| 1871 | E2F3 | A002-C-203 | Human | Colorectum | FAP | 2.26e-04 | -2.04e-01 | 0.2786 |
| 1871 | E2F3 | A001-C-119 | Human | Colorectum | FAP | 3.80e-08 | -3.94e-01 | -0.1557 |
| 1871 | E2F3 | A001-C-108 | Human | Colorectum | FAP | 1.37e-15 | -3.73e-01 | -0.0272 |
| Page: 1 2 3 4 5 6 |
| Tissue | Expression Dynamics | Abbreviation |
| Cervix | 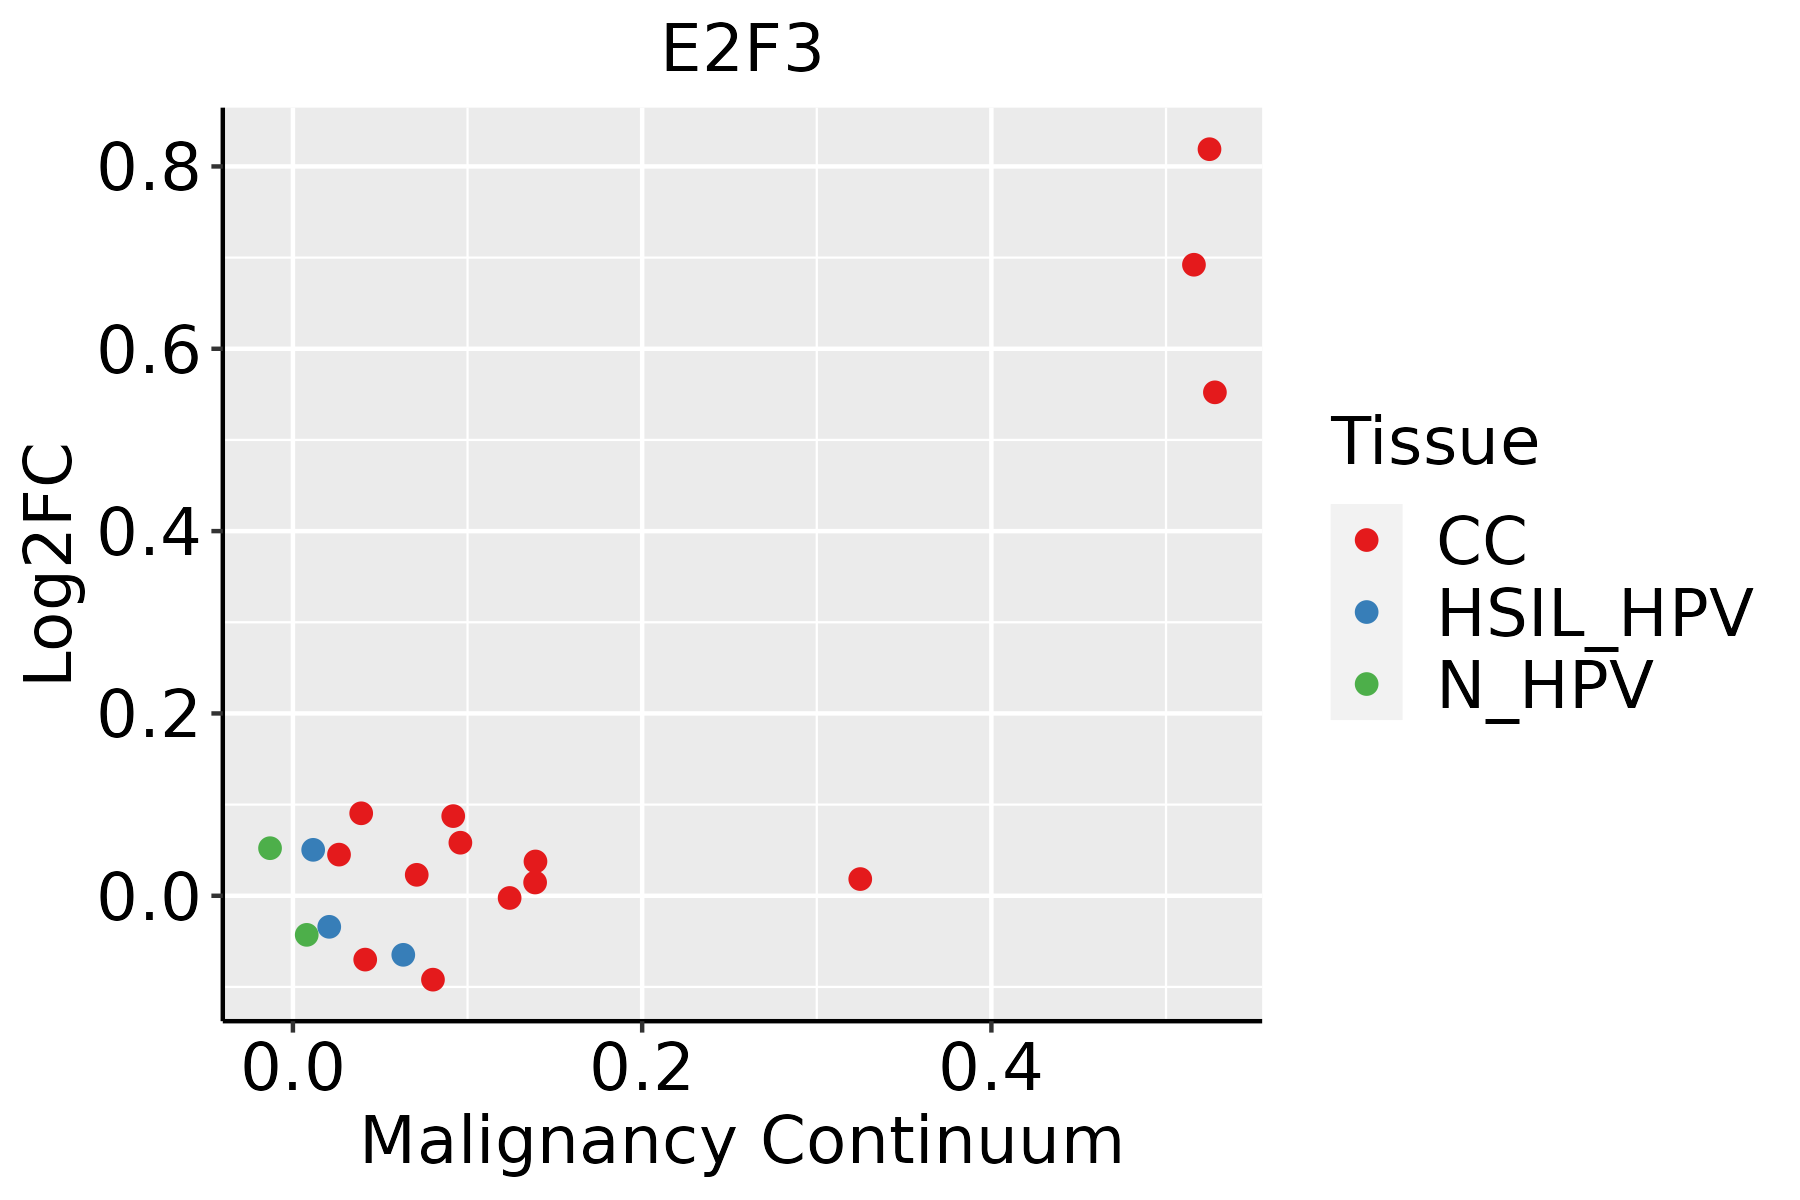 | CC: Cervix cancer |
| HSIL_HPV: HPV-infected high-grade squamous intraepithelial lesions | ||
| N_HPV: HPV-infected normal cervix | ||
| Colorectum (GSE201348) | 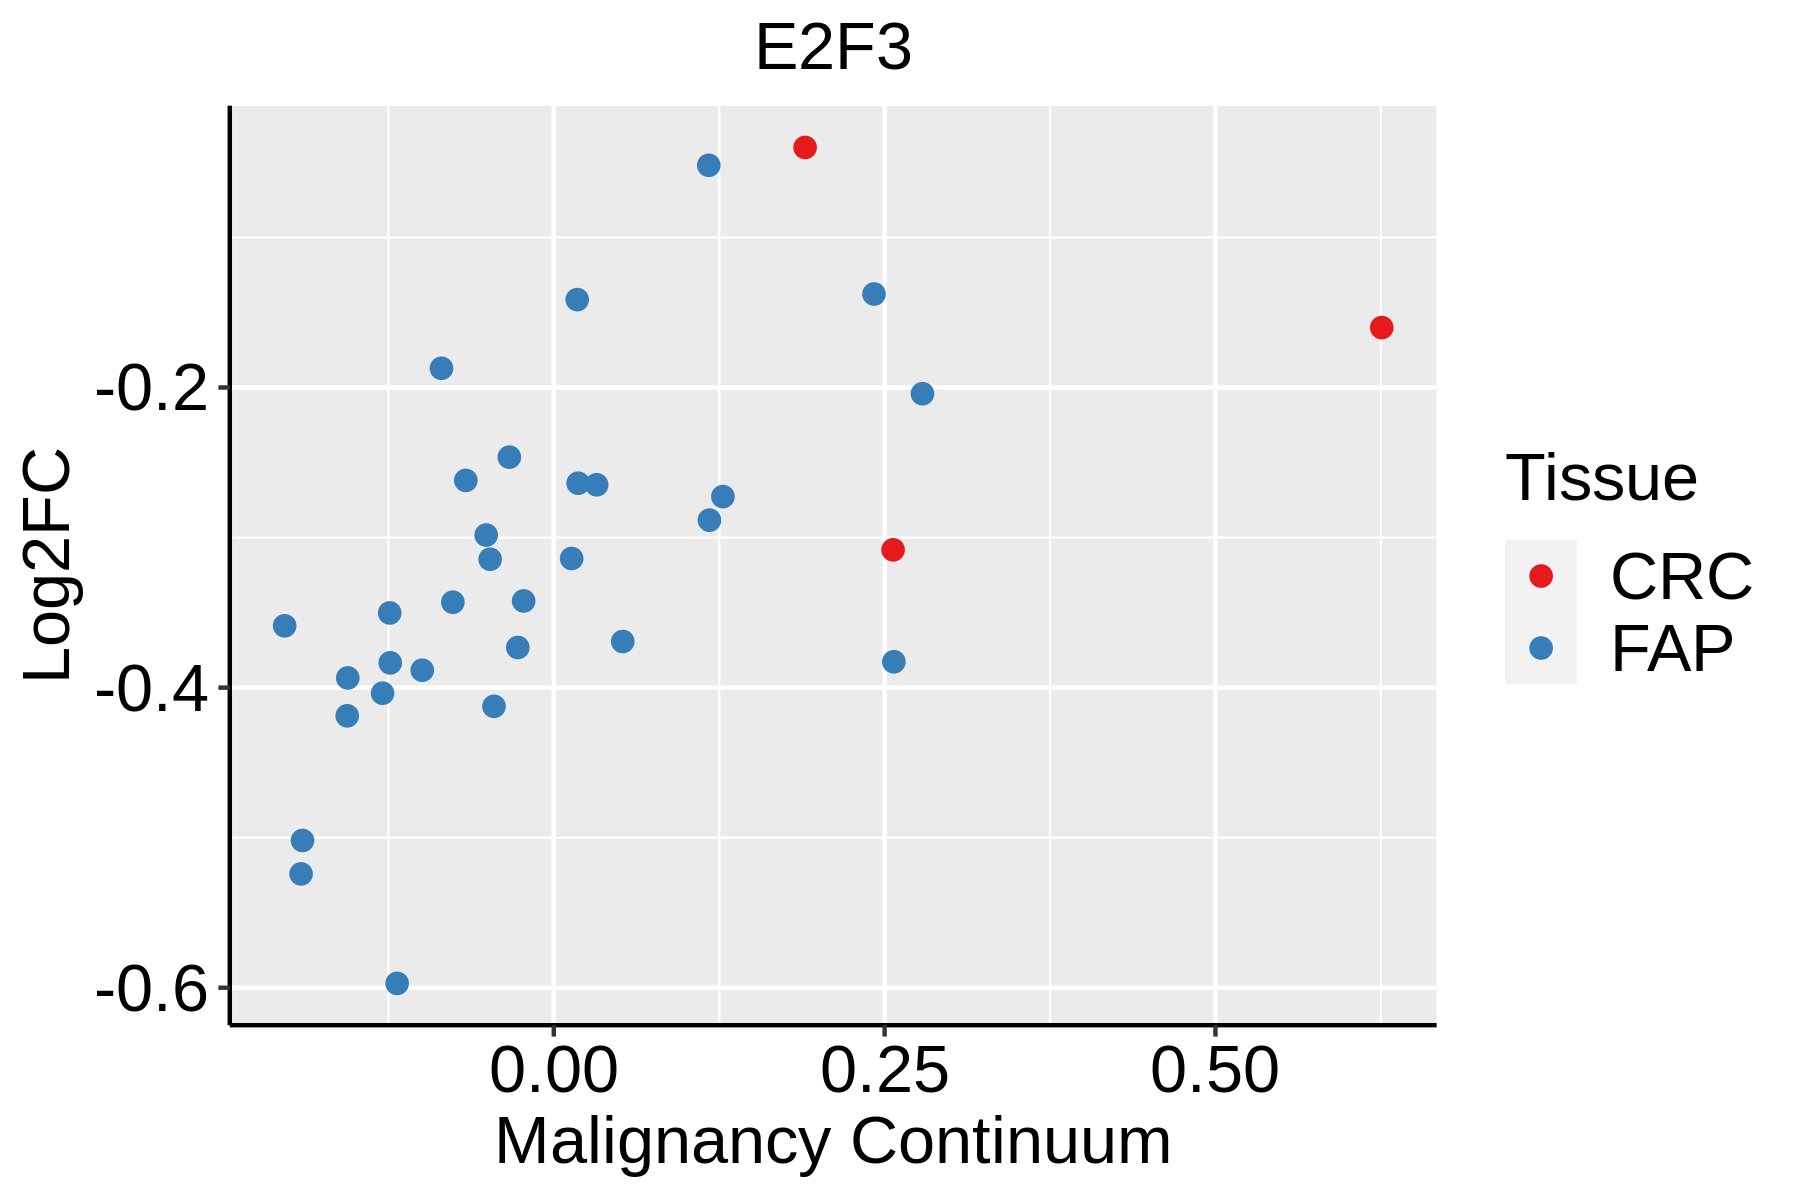 | FAP: Familial adenomatous polyposis |
| CRC: Colorectal cancer | ||
| Colorectum (HTA11) | 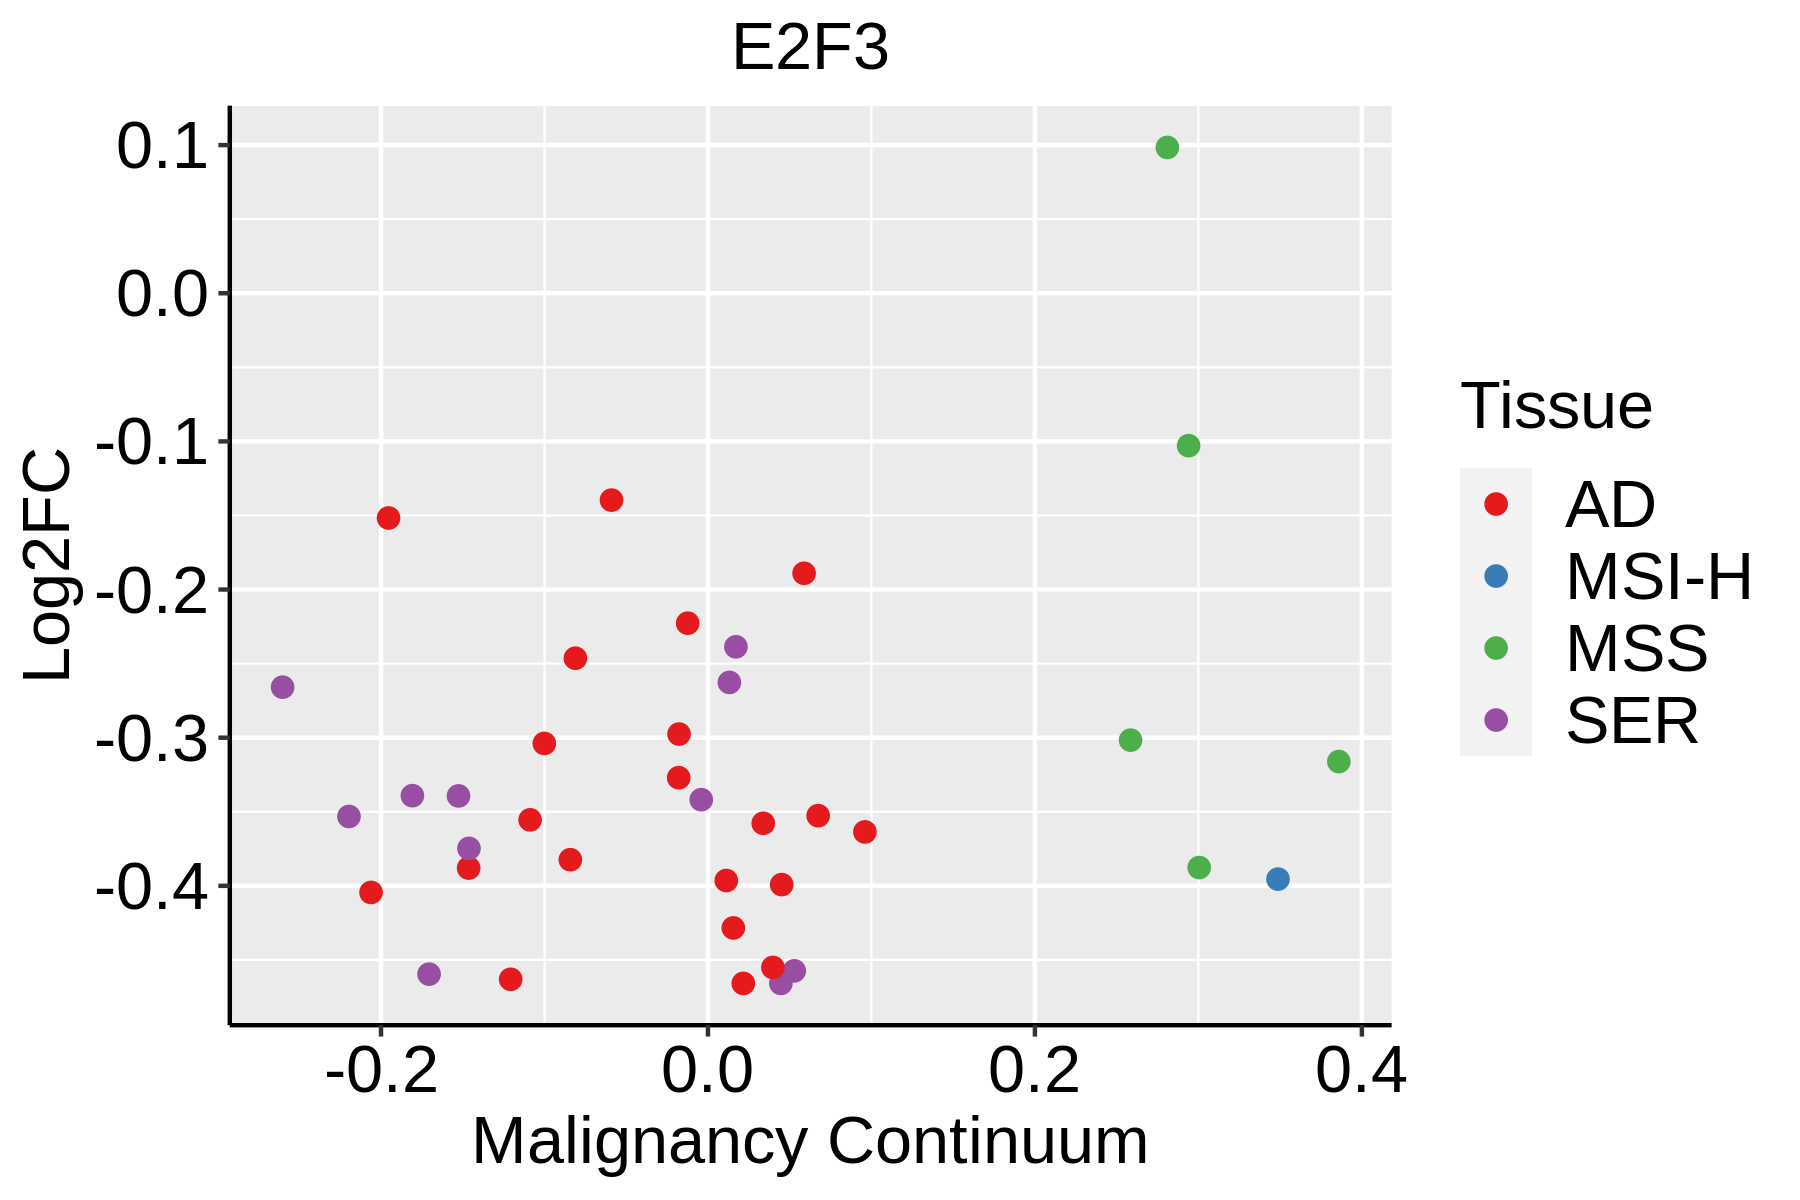 | AD: Adenomas |
| SER: Sessile serrated lesions | ||
| MSI-H: Microsatellite-high colorectal cancer | ||
| MSS: Microsatellite stable colorectal cancer | ||
| Esophagus | 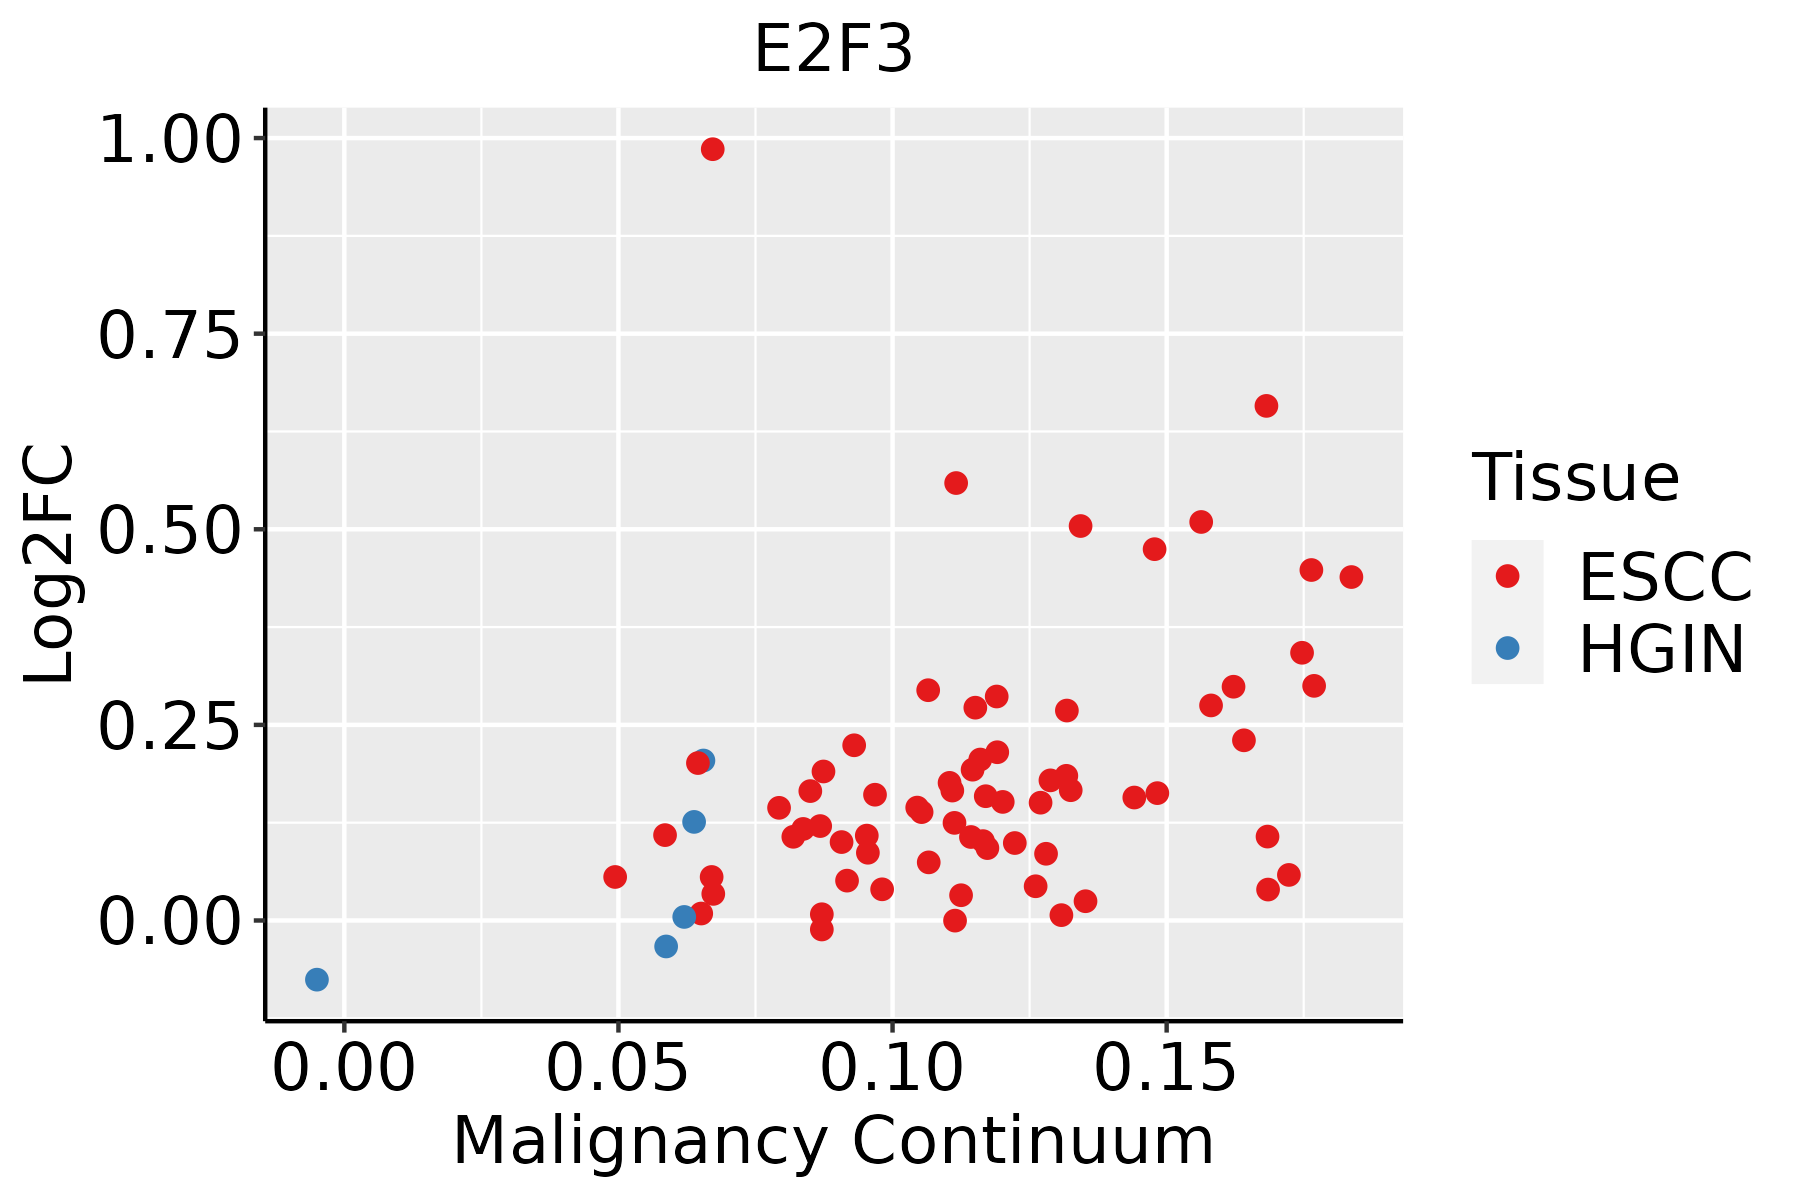 | ESCC: Esophageal squamous cell carcinoma |
| HGIN: High-grade intraepithelial neoplasias | ||
| LGIN: Low-grade intraepithelial neoplasias | ||
| Liver | 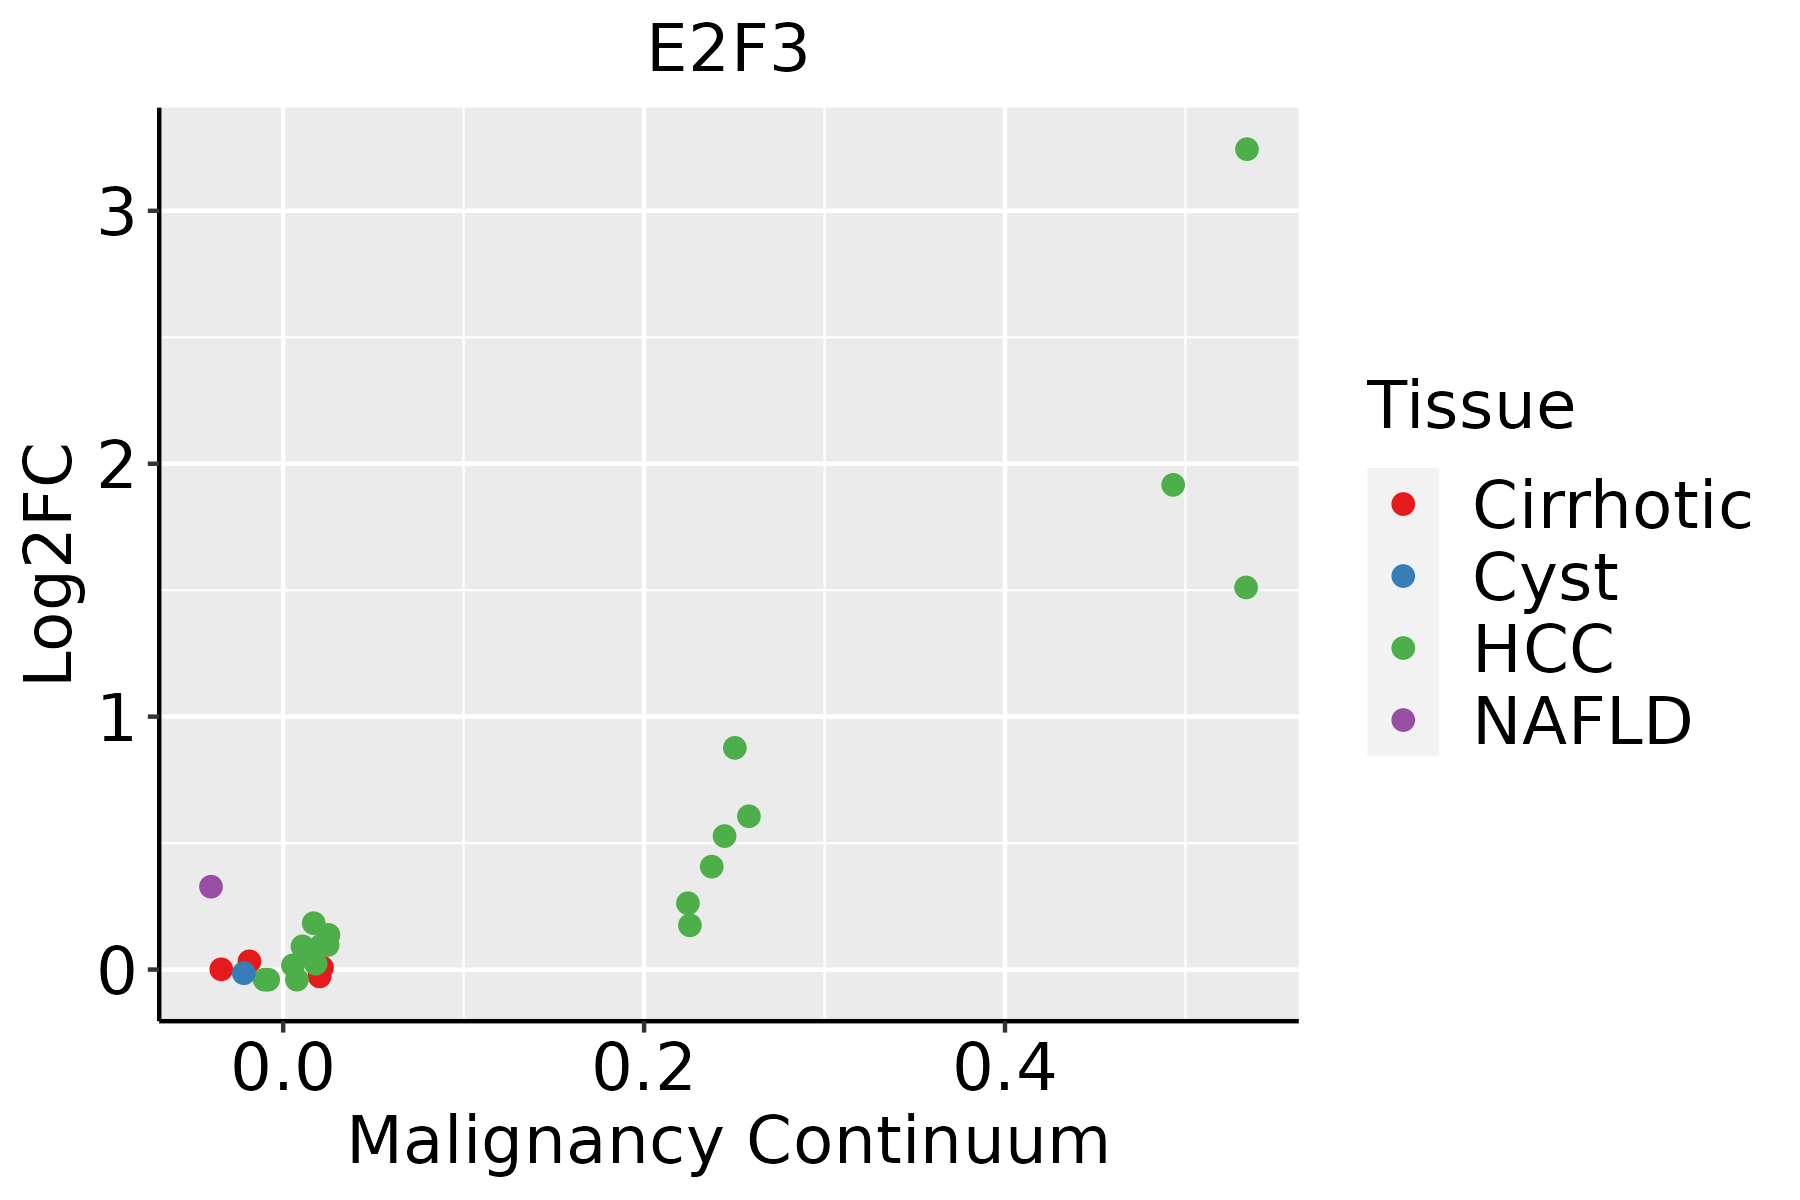 | HCC: Hepatocellular carcinoma |
| NAFLD: Non-alcoholic fatty liver disease | ||
| Thyroid | 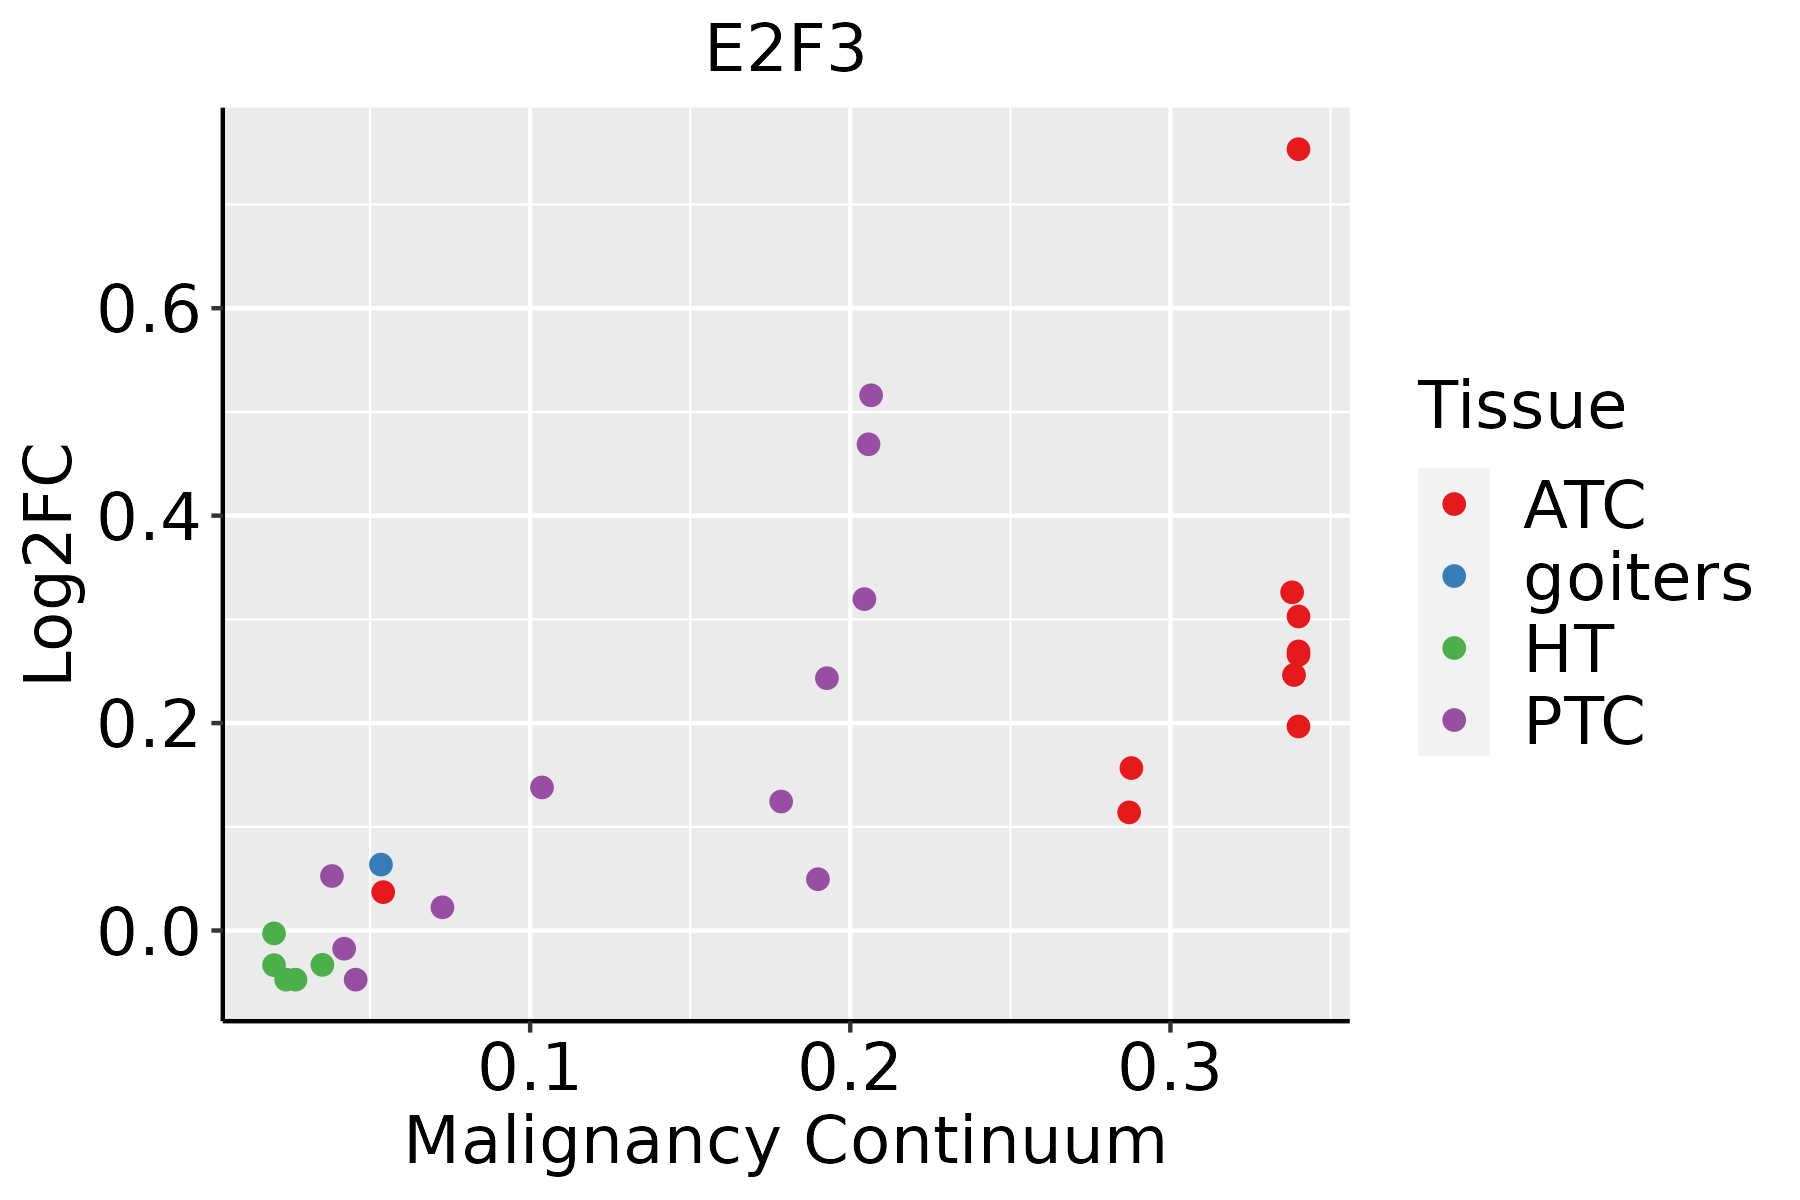 | ATC: Anaplastic thyroid cancer |
| HT: Hashimoto's thyroiditis | ||
| PTC: Papillary thyroid cancer |
| ∗log2FC in expression of this searched gene in stem-like cells from each diseased tissue sample relative to stem-like cells in normal samples in each tissue plotted against the malignancy continuum. Samples are colored based on if they are from different disease stage. |
Top |
Malignant transformation related pathway analysis |
| Find out the enriched GO biological processes and KEGG pathways involved in transition from healthy to precancer to cancer |
| Tissue | Disease Stage | Enriched GO biological Processes |
| Colorectum | AD |  |
| Colorectum | SER |  |
| Colorectum | MSS |  |
| Colorectum | MSI-H |  |
| Colorectum | FAP |  |
| ∗Top 15 enriched GO BP terms are showed in the bar plot of each disease state in each tissue. Each row represents a significant GO biological process which is colored according to the -log10(p.adjust). |
| Page: 1 2 3 4 5 6 7 8 9 |
| GO ID | Tissue | Disease Stage | Description | Gene Ratio | Bg Ratio | pvalue | p.adjust | Count |
| GO:00725949 | Cervix | CC | establishment of protein localization to organelle | 99/2311 | 422/18723 | 1.23e-10 | 2.11e-08 | 99 |
| GO:00069139 | Cervix | CC | nucleocytoplasmic transport | 71/2311 | 301/18723 | 4.04e-08 | 2.54e-06 | 71 |
| GO:00511699 | Cervix | CC | nuclear transport | 71/2311 | 301/18723 | 4.04e-08 | 2.54e-06 | 71 |
| GO:00345048 | Cervix | CC | protein localization to nucleus | 68/2311 | 290/18723 | 9.91e-08 | 5.25e-06 | 68 |
| GO:00447725 | Cervix | CC | mitotic cell cycle phase transition | 89/2311 | 424/18723 | 2.70e-07 | 1.12e-05 | 89 |
| GO:00170388 | Cervix | CC | protein import | 48/2311 | 206/18723 | 8.62e-06 | 1.98e-04 | 48 |
| GO:00000824 | Cervix | CC | G1/S transition of mitotic cell cycle | 49/2311 | 214/18723 | 1.16e-05 | 2.48e-04 | 49 |
| GO:00448434 | Cervix | CC | cell cycle G1/S phase transition | 53/2311 | 241/18723 | 1.76e-05 | 3.32e-04 | 53 |
| GO:00511707 | Cervix | CC | import into nucleus | 38/2311 | 159/18723 | 3.98e-05 | 6.18e-04 | 38 |
| GO:00066067 | Cervix | CC | protein import into nucleus | 37/2311 | 155/18723 | 5.13e-05 | 7.71e-04 | 37 |
| GO:0072594 | Colorectum | AD | establishment of protein localization to organelle | 148/3918 | 422/18723 | 7.95e-12 | 1.04e-09 | 148 |
| GO:0006913 | Colorectum | AD | nucleocytoplasmic transport | 102/3918 | 301/18723 | 1.00e-07 | 4.85e-06 | 102 |
| GO:0051169 | Colorectum | AD | nuclear transport | 102/3918 | 301/18723 | 1.00e-07 | 4.85e-06 | 102 |
| GO:0034504 | Colorectum | AD | protein localization to nucleus | 94/3918 | 290/18723 | 2.83e-06 | 8.09e-05 | 94 |
| GO:0017038 | Colorectum | AD | protein import | 67/3918 | 206/18723 | 6.34e-05 | 1.05e-03 | 67 |
| GO:0051170 | Colorectum | AD | import into nucleus | 53/3918 | 159/18723 | 1.76e-04 | 2.38e-03 | 53 |
| GO:0006606 | Colorectum | AD | protein import into nucleus | 51/3918 | 155/18723 | 3.29e-04 | 3.86e-03 | 51 |
| GO:00725942 | Colorectum | MSS | establishment of protein localization to organelle | 139/3467 | 422/18723 | 5.75e-13 | 1.12e-10 | 139 |
| GO:00069132 | Colorectum | MSS | nucleocytoplasmic transport | 99/3467 | 301/18723 | 1.35e-09 | 1.03e-07 | 99 |
| GO:00511692 | Colorectum | MSS | nuclear transport | 99/3467 | 301/18723 | 1.35e-09 | 1.03e-07 | 99 |
| Page: 1 2 3 4 5 |
| Pathway ID | Tissue | Disease Stage | Description | Gene Ratio | Bg Ratio | pvalue | p.adjust | qvalue | Count |
| hsa0516720 | Cervix | CC | Kaposi sarcoma-associated herpesvirus infection | 60/1267 | 194/8465 | 9.74e-09 | 1.58e-07 | 9.33e-08 | 60 |
| hsa0516318 | Cervix | CC | Human cytomegalovirus infection | 65/1267 | 225/8465 | 4.59e-08 | 6.47e-07 | 3.83e-07 | 65 |
| hsa0421810 | Cervix | CC | Cellular senescence | 49/1267 | 156/8465 | 1.30e-07 | 1.63e-06 | 9.61e-07 | 49 |
| hsa0516920 | Cervix | CC | Epstein-Barr virus infection | 57/1267 | 202/8465 | 7.30e-07 | 7.39e-06 | 4.37e-06 | 57 |
| hsa0516620 | Cervix | CC | Human T-cell leukemia virus 1 infection | 61/1267 | 222/8465 | 8.13e-07 | 7.98e-06 | 4.72e-06 | 61 |
| hsa052226 | Cervix | CC | Small cell lung cancer | 29/1267 | 92/8465 | 4.38e-05 | 3.09e-04 | 1.83e-04 | 29 |
| hsa052197 | Cervix | CC | Bladder cancer | 16/1267 | 41/8465 | 1.45e-04 | 9.05e-04 | 5.35e-04 | 16 |
| hsa052148 | Cervix | CC | Glioma | 24/1267 | 75/8465 | 1.51e-04 | 9.20e-04 | 5.44e-04 | 24 |
| hsa052128 | Cervix | CC | Pancreatic cancer | 24/1267 | 76/8465 | 1.89e-04 | 1.11e-03 | 6.55e-04 | 24 |
| hsa015223 | Cervix | CC | Endocrine resistance | 28/1267 | 98/8465 | 3.82e-04 | 1.87e-03 | 1.11e-03 | 28 |
| hsa052157 | Cervix | CC | Prostate cancer | 27/1267 | 97/8465 | 7.54e-04 | 3.39e-03 | 2.01e-03 | 27 |
| hsa052234 | Cervix | CC | Non-small cell lung cancer | 21/1267 | 72/8465 | 1.48e-03 | 6.32e-03 | 3.74e-03 | 21 |
| hsa0522510 | Cervix | CC | Hepatocellular carcinoma | 40/1267 | 168/8465 | 1.52e-03 | 6.39e-03 | 3.78e-03 | 40 |
| hsa0522014 | Cervix | CC | Chronic myeloid leukemia | 21/1267 | 76/8465 | 3.08e-03 | 1.19e-02 | 7.03e-03 | 21 |
| hsa041106 | Cervix | CC | Cell cycle | 36/1267 | 157/8465 | 4.94e-03 | 1.67e-02 | 9.86e-03 | 36 |
| hsa05224 | Cervix | CC | Breast cancer | 32/1267 | 147/8465 | 1.66e-02 | 4.88e-02 | 2.88e-02 | 32 |
| hsa05167110 | Cervix | CC | Kaposi sarcoma-associated herpesvirus infection | 60/1267 | 194/8465 | 9.74e-09 | 1.58e-07 | 9.33e-08 | 60 |
| hsa0516319 | Cervix | CC | Human cytomegalovirus infection | 65/1267 | 225/8465 | 4.59e-08 | 6.47e-07 | 3.83e-07 | 65 |
| hsa0421815 | Cervix | CC | Cellular senescence | 49/1267 | 156/8465 | 1.30e-07 | 1.63e-06 | 9.61e-07 | 49 |
| hsa05169110 | Cervix | CC | Epstein-Barr virus infection | 57/1267 | 202/8465 | 7.30e-07 | 7.39e-06 | 4.37e-06 | 57 |
| Page: 1 2 3 4 5 6 7 8 9 |
Top |
Cell-cell communication analysis |
| Identification of potential cell-cell interactions between two cell types and their ligand-receptor pairs for different disease states |
| Ligand | Receptor | LRpair | Pathway | Tissue | Disease Stage |
| Page: 1 |
Top |
Single-cell gene regulatory network inference analysis |
| Find out the significant the regulons (TFs) and the target genes of each regulon across cell types for different disease states |
| TF | Cell Type | Tissue | Disease Stage | Target Gene | RSS | Regulon Activity |
| E2F3 | NK | Esophagus | ADJ | PDIA4,ENC1,CALML5, etc. | 1.42e-01 |  |
| E2F3 | CD8TEXINT | Esophagus | ESCC | PDIA4,ENC1,CALML5, etc. | 1.43e-01 |  |
| E2F3 | STM | Lung | AAH | WDHD1,PPARD,SORBS2, etc. | 3.69e-02 |  |
| E2F3 | BAS | Lung | AAH | WDHD1,PPARD,SORBS2, etc. | 2.73e-02 | |
| E2F3 | ABP | Lung | ADJ | WDHD1,PPARD,SORBS2, etc. | 8.04e-06 |  |
| E2F3 | BAS | Lung | ADJ | WDHD1,PPARD,SORBS2, etc. | 2.93e-02 | |
| E2F3 | STM | Lung | ADJ | WDHD1,PPARD,SORBS2, etc. | 3.98e-03 | |
| E2F3 | ABP | Lung | IAC | WDHD1,PPARD,SORBS2, etc. | 2.14e-02 |  |
| E2F3 | CD8TEXP | Oral cavity | NEOLP | RP11-902B17.1,TECPR2,ODR4, etc. | 3.03e-01 |  |
| ∗The dot plots of a searched regulon are shown for all cell subpopulations in each disease state of each tissue based on the regulon specific score inferred using pySCENIC and by calculating the average expression. |
| Page: 1 |
Top |
Somatic mutation of malignant transformation related genes |
| Annotation of somatic variants for genes involved in malignant transformation |
| Hugo Symbol | Variant Class | Variant Classification | dbSNP RS | HGVSc | HGVSp | HGVSp Short | SWISSPROT | BIOTYPE | SIFT | PolyPhen | Tumor Sample Barcode | Tissue | Histology | Sex | Age | Stage | Therapy Types | Drugs | Outcome |
| E2F3 | SNV | Missense_Mutation | novel | c.1178C>A | p.Ser393Tyr | p.S393Y | O00716 | protein_coding | deleterious(0.02) | benign(0.374) | TCGA-AN-A046-01 | Breast | breast invasive carcinoma | Female | >=65 | I/II | Unknown | Unknown | SD |
| E2F3 | SNV | Missense_Mutation | c.1391N>A | p.Cys464Tyr | p.C464Y | O00716 | protein_coding | tolerated_low_confidence(0.26) | benign(0.003) | TCGA-BH-A0HF-01 | Breast | breast invasive carcinoma | Female | >=65 | I/II | Hormone Therapy | arimidex | SD | |
| E2F3 | insertion | In_Frame_Ins | novel | c.693_694insTCCTTTAGTTCATGCATTAGGCAATCCACAAATTGTGTGACACTA | p.Ile231_Lys232insSerPheSerSerCysIleArgGlnSerThrAsnCysValThrLeu | p.I231_K232insSFSSCIRQSTNCVTL | O00716 | protein_coding | TCGA-A2-A0EY-01 | Breast | breast invasive carcinoma | Female | <65 | I/II | Chemotherapy | adriamycin | SD | ||
| E2F3 | deletion | Frame_Shift_Del | novel | c.523_524delGA | p.Glu175LysfsTer5 | p.E175Kfs*5 | O00716 | protein_coding | TCGA-AR-A5QQ-01 | Breast | breast invasive carcinoma | Female | >=65 | III/IV | Chemotherapy | carboplatin | PD | ||
| E2F3 | SNV | Missense_Mutation | novel | c.470G>A | p.Gly157Glu | p.G157E | O00716 | protein_coding | deleterious(0.02) | benign(0.438) | TCGA-2W-A8YY-01 | Cervix | cervical & endocervical cancer | Female | <65 | I/II | Chemotherapy | cisplatin | CR |
| E2F3 | SNV | Missense_Mutation | c.180C>G | p.Ile60Met | p.I60M | O00716 | protein_coding | tolerated(0.14) | benign(0) | TCGA-C5-A1MJ-01 | Cervix | cervical & endocervical cancer | Female | <65 | I/II | Unknown | Unknown | SD | |
| E2F3 | SNV | Missense_Mutation | c.473G>A | p.Arg158Lys | p.R158K | O00716 | protein_coding | tolerated(0.35) | benign(0.066) | TCGA-IR-A3LK-01 | Cervix | cervical & endocervical cancer | Female | >=65 | I/II | Chemotherapy | cisplatin | PD | |
| E2F3 | SNV | Missense_Mutation | rs765868574 | c.485N>A | p.Arg162Gln | p.R162Q | O00716 | protein_coding | tolerated(0.44) | benign(0.119) | TCGA-JW-A5VL-01 | Cervix | cervical & endocervical cancer | Female | <65 | I/II | Unknown | Unknown | SD |
| E2F3 | SNV | Missense_Mutation | c.877N>T | p.Asn293Tyr | p.N293Y | O00716 | protein_coding | deleterious(0) | benign(0.253) | TCGA-A6-2686-01 | Colorectum | colon adenocarcinoma | Female | >=65 | I/II | Unknown | Unknown | SD | |
| E2F3 | SNV | Missense_Mutation | novel | c.1103A>T | p.His368Leu | p.H368L | O00716 | protein_coding | tolerated(0.76) | benign(0.027) | TCGA-A6-5665-01 | Colorectum | colon adenocarcinoma | Female | >=65 | I/II | Unknown | Unknown | PD |
| Page: 1 2 3 4 5 |
Top |
Related drugs of malignant transformation related genes |
| Identification of chemicals and drugs interact with genes involved in malignant transfromation |
| (DGIdb 4.0) |
| Entrez ID | Symbol | Category | Interaction Types | Drug Claim Name | Drug Name | PMIDs |
| Page: 1 |

Copyright 2023-Present -The University of Texas Health Science Center at Houston |