
|
|||||
|
 | |
| |
| |
| |
| |
| |
|
Gene: E2F1 |
Gene summary for E2F1 |
| Gene information | Species | Human | Gene symbol | E2F1 | Gene ID | 1869 |
| Gene name | E2F transcription factor 1 | |
| Gene Alias | E2F-1 | |
| Cytomap | 20q11.22 | |
| Gene Type | protein-coding | GO ID | GO:0000003 | UniProtAcc | Q01094 |
Top |
Malignant transformation analysis |
| Identification of the aberrant gene expression in precancerous and cancerous lesions by comparing the gene expression of stem-like cells in diseased tissues with normal stem cells |
| Entrez ID | Symbol | Replicates | Species | Organ | Tissue | Adj P-value | Log2FC | Malignancy |
| 1869 | E2F1 | C04 | Human | Oral cavity | OSCC | 1.51e-10 | 4.58e-01 | 0.2633 |
| 1869 | E2F1 | C21 | Human | Oral cavity | OSCC | 9.18e-16 | 5.96e-01 | 0.2678 |
| 1869 | E2F1 | C30 | Human | Oral cavity | OSCC | 3.74e-18 | 1.06e+00 | 0.3055 |
| 1869 | E2F1 | C38 | Human | Oral cavity | OSCC | 9.35e-07 | 8.64e-01 | 0.172 |
| 1869 | E2F1 | C43 | Human | Oral cavity | OSCC | 6.71e-11 | 2.65e-01 | 0.1704 |
| 1869 | E2F1 | C46 | Human | Oral cavity | OSCC | 1.52e-16 | 4.10e-01 | 0.1673 |
| 1869 | E2F1 | C51 | Human | Oral cavity | OSCC | 3.00e-03 | 2.16e-01 | 0.2674 |
| 1869 | E2F1 | C57 | Human | Oral cavity | OSCC | 8.90e-18 | 5.39e-01 | 0.1679 |
| 1869 | E2F1 | C06 | Human | Oral cavity | OSCC | 6.22e-04 | 7.82e-01 | 0.2699 |
| 1869 | E2F1 | C08 | Human | Oral cavity | OSCC | 4.17e-05 | 2.34e-01 | 0.1919 |
| 1869 | E2F1 | LN22 | Human | Oral cavity | OSCC | 1.09e-03 | 3.63e-01 | 0.1733 |
| 1869 | E2F1 | LN46 | Human | Oral cavity | OSCC | 1.35e-17 | 4.74e-01 | 0.1666 |
| 1869 | E2F1 | SYSMH2 | Human | Oral cavity | OSCC | 9.27e-05 | 2.36e-01 | 0.2326 |
| 1869 | E2F1 | SYSMH3 | Human | Oral cavity | OSCC | 5.52e-07 | 2.44e-01 | 0.2442 |
| Page: 1 |
| Tissue | Expression Dynamics | Abbreviation |
| Oral Cavity | 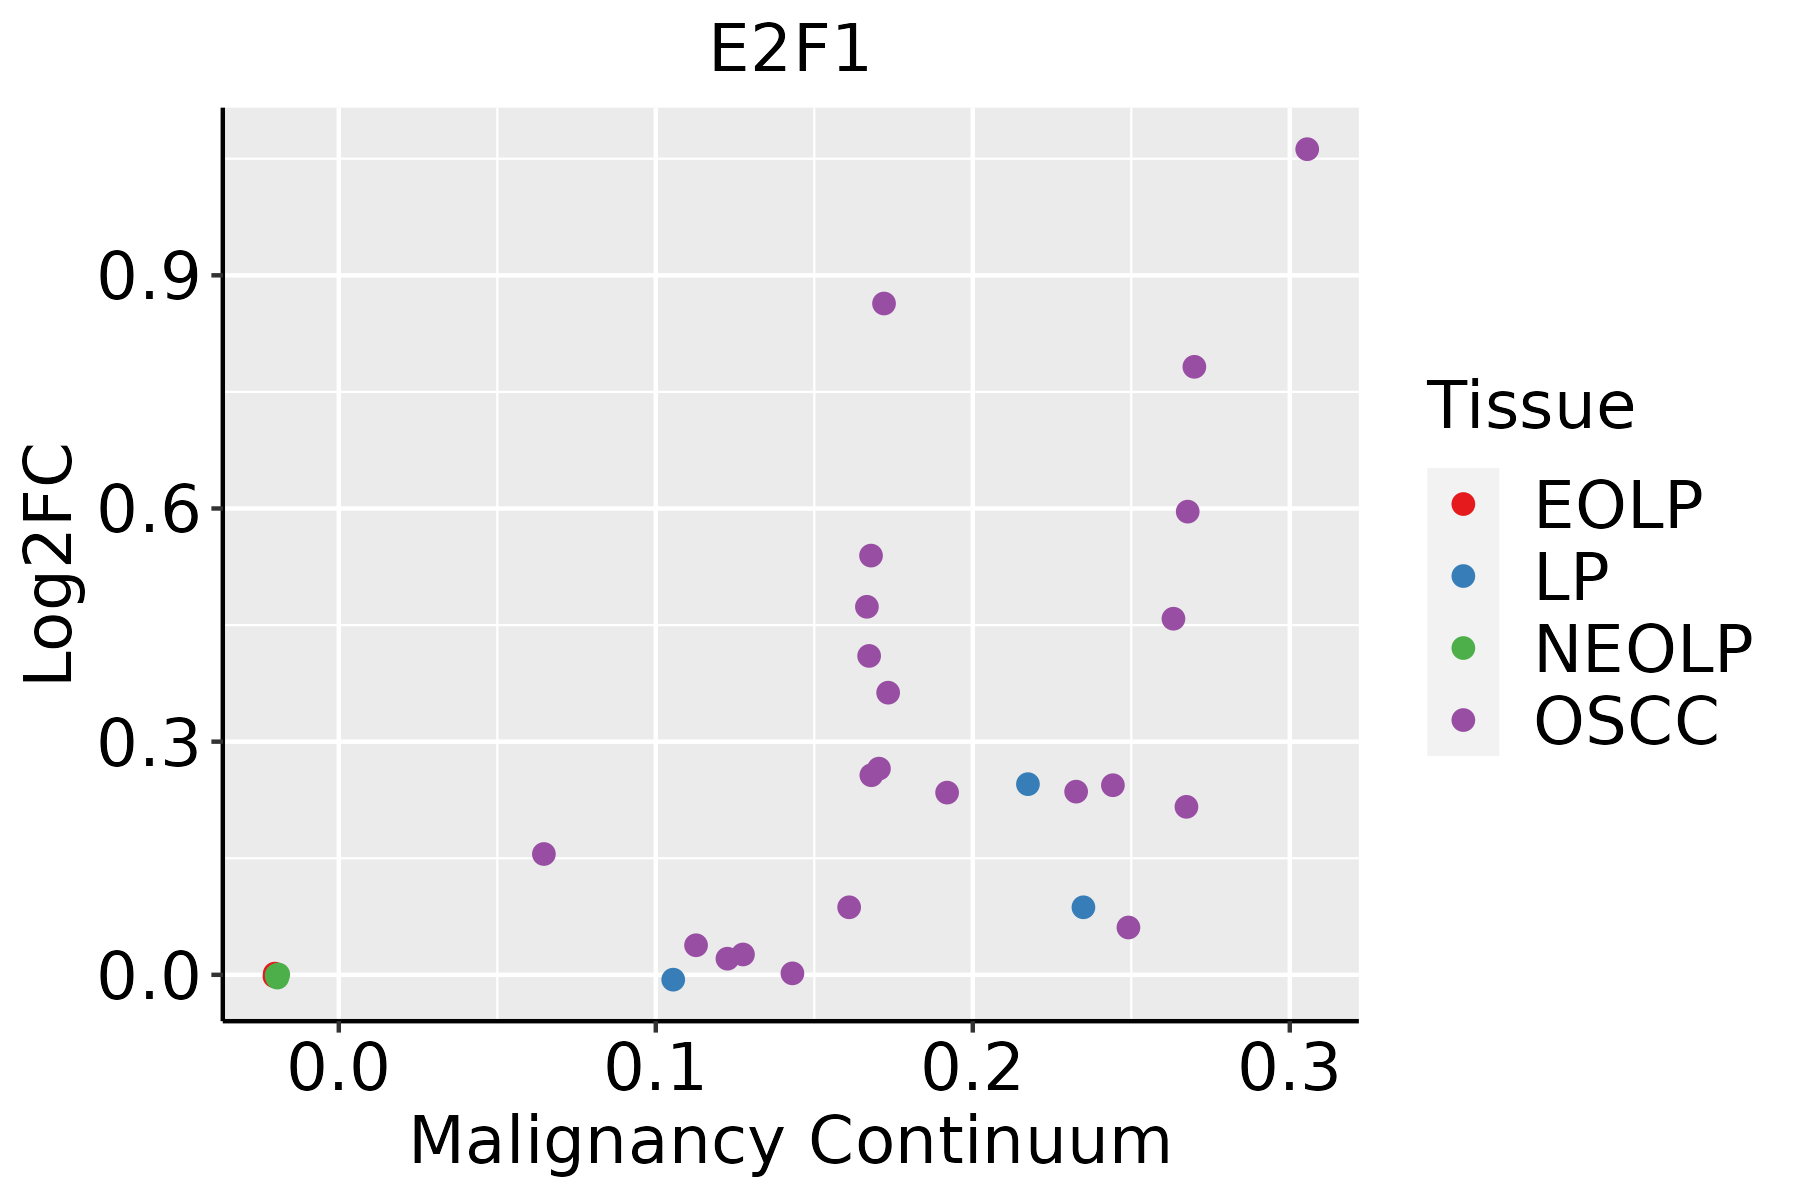 | EOLP: Erosive Oral lichen planus |
| LP: leukoplakia | ||
| NEOLP: Non-erosive oral lichen planus | ||
| OSCC: Oral squamous cell carcinoma |
| ∗log2FC in expression of this searched gene in stem-like cells from each diseased tissue sample relative to stem-like cells in normal samples in each tissue plotted against the malignancy continuum. Samples are colored based on if they are from different disease stage. |
Top |
Malignant transformation related pathway analysis |
| Find out the enriched GO biological processes and KEGG pathways involved in transition from healthy to precancer to cancer |
| Tissue | Disease Stage | Enriched GO biological Processes |
| Colorectum | AD |  |
| Colorectum | SER |  |
| Colorectum | MSS |  |
| Colorectum | MSI-H |  |
| Colorectum | FAP |  |
| ∗Top 15 enriched GO BP terms are showed in the bar plot of each disease state in each tissue. Each row represents a significant GO biological process which is colored according to the -log10(p.adjust). |
| Page: 1 2 3 4 5 6 7 8 9 |
| GO ID | Tissue | Disease Stage | Description | Gene Ratio | Bg Ratio | pvalue | p.adjust | Count |
| GO:009719320 | Oral cavity | OSCC | intrinsic apoptotic signaling pathway | 202/7305 | 288/18723 | 4.64e-27 | 1.73e-24 | 202 |
| GO:190331118 | Oral cavity | OSCC | regulation of mRNA metabolic process | 197/7305 | 288/18723 | 2.83e-24 | 7.16e-22 | 197 |
| GO:000640118 | Oral cavity | OSCC | RNA catabolic process | 184/7305 | 278/18723 | 2.71e-20 | 4.19e-18 | 184 |
| GO:00447728 | Oral cavity | OSCC | mitotic cell cycle phase transition | 255/7305 | 424/18723 | 5.29e-19 | 6.98e-17 | 255 |
| GO:000640218 | Oral cavity | OSCC | mRNA catabolic process | 156/7305 | 232/18723 | 2.13e-18 | 2.37e-16 | 156 |
| GO:003465517 | Oral cavity | OSCC | nucleobase-containing compound catabolic process | 244/7305 | 407/18723 | 5.38e-18 | 5.49e-16 | 244 |
| GO:00073469 | Oral cavity | OSCC | regulation of mitotic cell cycle | 266/7305 | 457/18723 | 3.87e-17 | 3.41e-15 | 266 |
| GO:004670015 | Oral cavity | OSCC | heterocycle catabolic process | 254/7305 | 445/18723 | 5.07e-15 | 3.31e-13 | 254 |
| GO:004427016 | Oral cavity | OSCC | cellular nitrogen compound catabolic process | 256/7305 | 451/18723 | 9.67e-15 | 5.88e-13 | 256 |
| GO:001943915 | Oral cavity | OSCC | aromatic compound catabolic process | 263/7305 | 467/18723 | 1.49e-14 | 8.84e-13 | 263 |
| GO:005109820 | Oral cavity | OSCC | regulation of binding | 212/7305 | 363/18723 | 3.88e-14 | 2.15e-12 | 212 |
| GO:190136115 | Oral cavity | OSCC | organic cyclic compound catabolic process | 272/7305 | 495/18723 | 2.73e-13 | 1.36e-11 | 272 |
| GO:007048219 | Oral cavity | OSCC | response to oxygen levels | 200/7305 | 347/18723 | 1.17e-12 | 5.13e-11 | 200 |
| GO:007233120 | Oral cavity | OSCC | signal transduction by p53 class mediator | 107/7305 | 163/18723 | 4.75e-12 | 1.83e-10 | 107 |
| GO:000863018 | Oral cavity | OSCC | intrinsic apoptotic signaling pathway in response to DNA damage | 72/7305 | 99/18723 | 9.50e-12 | 3.50e-10 | 72 |
| GO:000166619 | Oral cavity | OSCC | response to hypoxia | 177/7305 | 307/18723 | 2.21e-11 | 7.50e-10 | 177 |
| GO:19019905 | Oral cavity | OSCC | regulation of mitotic cell cycle phase transition | 173/7305 | 299/18723 | 2.49e-11 | 8.35e-10 | 173 |
| GO:003629319 | Oral cavity | OSCC | response to decreased oxygen levels | 182/7305 | 322/18723 | 1.14e-10 | 3.41e-09 | 182 |
| GO:006101316 | Oral cavity | OSCC | regulation of mRNA catabolic process | 105/7305 | 166/18723 | 2.04e-10 | 5.82e-09 | 105 |
| GO:000989519 | Oral cavity | OSCC | negative regulation of catabolic process | 180/7305 | 320/18723 | 2.44e-10 | 6.86e-09 | 180 |
| Page: 1 2 3 4 |
| Pathway ID | Tissue | Disease Stage | Description | Gene Ratio | Bg Ratio | pvalue | p.adjust | qvalue | Count |
| hsa041108 | Oral cavity | OSCC | Cell cycle | 118/3704 | 157/8465 | 7.15e-16 | 2.66e-14 | 1.35e-14 | 118 |
| hsa0516928 | Oral cavity | OSCC | Epstein-Barr virus infection | 144/3704 | 202/8465 | 1.08e-15 | 3.60e-14 | 1.83e-14 | 144 |
| hsa0516630 | Oral cavity | OSCC | Human T-cell leukemia virus 1 infection | 150/3704 | 222/8465 | 3.68e-13 | 7.26e-12 | 3.70e-12 | 150 |
| hsa0421820 | Oral cavity | OSCC | Cellular senescence | 112/3704 | 156/8465 | 8.04e-13 | 1.42e-11 | 7.21e-12 | 112 |
| hsa0413728 | Oral cavity | OSCC | Mitophagy - animal | 58/3704 | 72/8465 | 1.48e-10 | 2.07e-09 | 1.05e-09 | 58 |
| hsa0521210 | Oral cavity | OSCC | Pancreatic cancer | 60/3704 | 76/8465 | 3.32e-10 | 4.45e-09 | 2.26e-09 | 60 |
| hsa051659 | Oral cavity | OSCC | Human papillomavirus infection | 200/3704 | 331/8465 | 3.83e-10 | 4.93e-09 | 2.51e-09 | 200 |
| hsa0516729 | Oral cavity | OSCC | Kaposi sarcoma-associated herpesvirus infection | 125/3704 | 194/8465 | 3.67e-09 | 3.84e-08 | 1.96e-08 | 125 |
| hsa051608 | Oral cavity | OSCC | Hepatitis C | 103/3704 | 157/8465 | 2.17e-08 | 1.96e-07 | 9.99e-08 | 103 |
| hsa0516328 | Oral cavity | OSCC | Human cytomegalovirus infection | 139/3704 | 225/8465 | 2.77e-08 | 2.38e-07 | 1.21e-07 | 139 |
| hsa052228 | Oral cavity | OSCC | Small cell lung cancer | 66/3704 | 92/8465 | 4.43e-08 | 3.38e-07 | 1.72e-07 | 66 |
| hsa0522018 | Oral cavity | OSCC | Chronic myeloid leukemia | 56/3704 | 76/8465 | 1.04e-07 | 7.43e-07 | 3.78e-07 | 56 |
| hsa051618 | Oral cavity | OSCC | Hepatitis B | 103/3704 | 162/8465 | 2.34e-07 | 1.51e-06 | 7.69e-07 | 103 |
| hsa0521510 | Oral cavity | OSCC | Prostate cancer | 66/3704 | 97/8465 | 1.05e-06 | 5.89e-06 | 3.00e-06 | 66 |
| hsa052199 | Oral cavity | OSCC | Bladder cancer | 32/3704 | 41/8465 | 7.73e-06 | 3.59e-05 | 1.83e-05 | 32 |
| hsa015226 | Oral cavity | OSCC | Endocrine resistance | 63/3704 | 98/8465 | 3.09e-05 | 1.31e-04 | 6.67e-05 | 63 |
| hsa0521410 | Oral cavity | OSCC | Glioma | 49/3704 | 75/8465 | 1.27e-04 | 4.50e-04 | 2.29e-04 | 49 |
| hsa0522516 | Oral cavity | OSCC | Hepatocellular carcinoma | 97/3704 | 168/8465 | 1.63e-04 | 5.52e-04 | 2.81e-04 | 97 |
| hsa052236 | Oral cavity | OSCC | Non-small cell lung cancer | 46/3704 | 72/8465 | 4.37e-04 | 1.32e-03 | 6.72e-04 | 46 |
| hsa0411015 | Oral cavity | OSCC | Cell cycle | 118/3704 | 157/8465 | 7.15e-16 | 2.66e-14 | 1.35e-14 | 118 |
| Page: 1 2 |
Top |
Cell-cell communication analysis |
| Identification of potential cell-cell interactions between two cell types and their ligand-receptor pairs for different disease states |
| Ligand | Receptor | LRpair | Pathway | Tissue | Disease Stage |
| Page: 1 |
Top |
Single-cell gene regulatory network inference analysis |
| Find out the significant the regulons (TFs) and the target genes of each regulon across cell types for different disease states |
| TF | Cell Type | Tissue | Disease Stage | Target Gene | RSS | Regulon Activity |
| E2F1 | TAC | Colorectum | AD | MCM5,FANCA,MCM6, etc. | 1.46e-01 |  |
| E2F1 | ASC | Colorectum | ADJ | MYBL2,TONSL,VARS, etc. | 1.25e-01 |  |
| E2F1 | ASC | Colorectum | MSI-H | MCM5,FANCA,MCM6, etc. | 1.32e-01 |  |
| E2F1 | TAC | Colorectum | MSI-H | MCM5,FANCA,MCM6, etc. | 3.03e-01 | |
| E2F1 | TAC | Colorectum | MSS | MCM5,FANCA,MCM6, etc. | 3.82e-01 |  |
| E2F1 | CT | Colorectum | MSS | MCM5,FANCA,MCM6, etc. | 3.29e-05 | |
| E2F1 | TAC | Colorectum | SER | MCM5,FANCA,MCM6, etc. | 1.59e-01 |  |
| E2F1 | BAS | Oral cavity | Healthy | SHMT1,MFAP1,TSEN34, etc. | 2.26e-01 |  |
| E2F1 | CD8TEREX | Oral cavity | EOLP | GINS2,MCM5,PCNA, etc. | 1.20e-01 |  |
| E2F1 | CD8TEFF | Thyroid | Healthy | PCNA,MCM5,GINS2, etc. | 4.41e-02 |  |
| ∗The dot plots of a searched regulon are shown for all cell subpopulations in each disease state of each tissue based on the regulon specific score inferred using pySCENIC and by calculating the average expression. |
| Page: 1 |
Top |
Somatic mutation of malignant transformation related genes |
| Annotation of somatic variants for genes involved in malignant transformation |
| Hugo Symbol | Variant Class | Variant Classification | dbSNP RS | HGVSc | HGVSp | HGVSp Short | SWISSPROT | BIOTYPE | SIFT | PolyPhen | Tumor Sample Barcode | Tissue | Histology | Sex | Age | Stage | Therapy Types | Drugs | Outcome |
| E2F1 | SNV | Missense_Mutation | c.503N>G | p.Tyr168Cys | p.Y168C | Q01094 | protein_coding | deleterious(0) | probably_damaging(1) | TCGA-A2-A04R-01 | Breast | breast invasive carcinoma | Female | <65 | I/II | Chemotherapy | taxol | SD | |
| E2F1 | SNV | Missense_Mutation | c.596N>C | p.Val199Ala | p.V199A | Q01094 | protein_coding | tolerated(0.58) | benign(0) | TCGA-AN-A0AK-01 | Breast | breast invasive carcinoma | Female | >=65 | I/II | Unknown | Unknown | SD | |
| E2F1 | SNV | Missense_Mutation | c.754N>T | p.Arg252Cys | p.R252C | Q01094 | protein_coding | deleterious(0.01) | probably_damaging(0.991) | TCGA-D8-A1JS-01 | Breast | breast invasive carcinoma | Female | >=65 | I/II | Hormone Therapy | tamoxiphen | SD | |
| E2F1 | SNV | Missense_Mutation | c.493N>T | p.Arg165Trp | p.R165W | Q01094 | protein_coding | deleterious(0) | probably_damaging(1) | TCGA-E2-A154-01 | Breast | breast invasive carcinoma | Female | >=65 | I/II | Hormone Therapy | arimidex | SD | |
| E2F1 | insertion | Nonsense_Mutation | novel | c.1241_1242insTACCGGGGAATGAAGGT | p.Leu415ThrfsTer4 | p.L415Tfs*4 | Q01094 | protein_coding | TCGA-AN-A0AR-01 | Breast | breast invasive carcinoma | Female | <65 | I/II | Unknown | Unknown | SD | ||
| E2F1 | SNV | Missense_Mutation | novel | c.748N>A | p.Asp250Asn | p.D250N | Q01094 | protein_coding | deleterious(0) | probably_damaging(0.92) | TCGA-2W-A8YY-01 | Cervix | cervical & endocervical cancer | Female | <65 | I/II | Chemotherapy | cisplatin | CR |
| E2F1 | SNV | Missense_Mutation | c.754N>T | p.Arg252Cys | p.R252C | Q01094 | protein_coding | deleterious(0.01) | probably_damaging(0.991) | TCGA-Q1-A5R2-01 | Cervix | cervical & endocervical cancer | Female | <65 | I/II | Chemotherapy | cisplatin | PR | |
| E2F1 | SNV | Missense_Mutation | c.380N>A | p.Arg127His | p.R127H | Q01094 | protein_coding | deleterious(0) | probably_damaging(1) | TCGA-A5-A0G2-01 | Endometrium | uterine corpus endometrioid carcinoma | Female | <65 | III/IV | Unknown | Unknown | SD | |
| E2F1 | SNV | Missense_Mutation | novel | c.268N>T | p.Arg90Trp | p.R90W | Q01094 | protein_coding | deleterious(0) | probably_damaging(1) | TCGA-A5-A0G2-01 | Endometrium | uterine corpus endometrioid carcinoma | Female | <65 | III/IV | Unknown | Unknown | SD |
| E2F1 | SNV | Missense_Mutation | novel | c.942N>T | p.Gln314His | p.Q314H | Q01094 | protein_coding | deleterious(0.02) | possibly_damaging(0.525) | TCGA-A5-A1OF-01 | Endometrium | uterine corpus endometrioid carcinoma | Female | <65 | I/II | Unknown | Unknown | SD |
| Page: 1 2 3 4 5 |
Top |
Related drugs of malignant transformation related genes |
| Identification of chemicals and drugs interact with genes involved in malignant transfromation |
| (DGIdb 4.0) |
| Entrez ID | Symbol | Category | Interaction Types | Drug Claim Name | Drug Name | PMIDs |
| 1869 | E2F1 | TRANSCRIPTION FACTOR | GP-120 | 12775414 | ||
| 1869 | E2F1 | TRANSCRIPTION FACTOR | NERVE GROWTH FACTOR | 10454552 | ||
| 1869 | E2F1 | TRANSCRIPTION FACTOR | DES | DIETHYLSTILBESTROL | 15545218 | |
| 1869 | E2F1 | TRANSCRIPTION FACTOR | BCNU | CARMUSTINE | 11445852 | |
| 1869 | E2F1 | TRANSCRIPTION FACTOR | QUERCETIN | QUERCETIN | 16274926 | |
| 1869 | E2F1 | TRANSCRIPTION FACTOR | LARGAZOLE | LARGAZOLE | ||
| 1869 | E2F1 | TRANSCRIPTION FACTOR | VASOPRESSIN | VASOPRESSIN | 12063292 | |
| 1869 | E2F1 | TRANSCRIPTION FACTOR | URSODEOXYCHOLIC ACID | 15222754 | ||
| 1869 | E2F1 | TRANSCRIPTION FACTOR | ANTISENSE OLIGONUCLEOTIDES | 10207094 | ||
| 1869 | E2F1 | TRANSCRIPTION FACTOR | ADRIAMYCIN | ADRIAMYCIN | 9863003 |
| Page: 1 2 3 |

Copyright 2023-Present -The University of Texas Health Science Center at Houston |