
|
|||||
|
 | |
| |
| |
| |
| |
| |
|
Gene: DZANK1 |
Gene summary for DZANK1 |
| Gene information | Species | Human | Gene symbol | DZANK1 | Gene ID | 55184 |
| Gene name | double zinc ribbon and ankyrin repeat domains 1 | |
| Gene Alias | ANKRD64 | |
| Cytomap | 20p11.23 | |
| Gene Type | protein-coding | GO ID | GO:0001654 | UniProtAcc | A1L3Z8 |
Top |
Malignant transformation analysis |
| Identification of the aberrant gene expression in precancerous and cancerous lesions by comparing the gene expression of stem-like cells in diseased tissues with normal stem cells |
| Entrez ID | Symbol | Replicates | Species | Organ | Tissue | Adj P-value | Log2FC | Malignancy |
| 55184 | DZANK1 | P2T-E | Human | Esophagus | ESCC | 4.44e-08 | 1.65e-01 | 0.1177 |
| 55184 | DZANK1 | P10T-E | Human | Esophagus | ESCC | 1.96e-05 | 1.25e-01 | 0.116 |
| 55184 | DZANK1 | P16T-E | Human | Esophagus | ESCC | 5.57e-40 | 7.06e-01 | 0.1153 |
| 55184 | DZANK1 | P26T-E | Human | Esophagus | ESCC | 1.66e-02 | 7.06e-02 | 0.1276 |
| 55184 | DZANK1 | P56T-E | Human | Esophagus | ESCC | 2.09e-15 | 1.33e+00 | 0.1613 |
| 55184 | DZANK1 | P74T-E | Human | Esophagus | ESCC | 7.24e-03 | 1.27e-01 | 0.1479 |
| 55184 | DZANK1 | P79T-E | Human | Esophagus | ESCC | 8.84e-05 | 1.21e-01 | 0.1154 |
| 55184 | DZANK1 | P128T-E | Human | Esophagus | ESCC | 7.29e-13 | 3.40e-01 | 0.1241 |
| 55184 | DZANK1 | HCC2 | Human | Liver | HCC | 2.47e-12 | 1.92e+00 | 0.5341 |
| 55184 | DZANK1 | HCC5 | Human | Liver | HCC | 6.12e-04 | 1.05e+00 | 0.4932 |
| Page: 1 |
| Tissue | Expression Dynamics | Abbreviation |
| Esophagus | 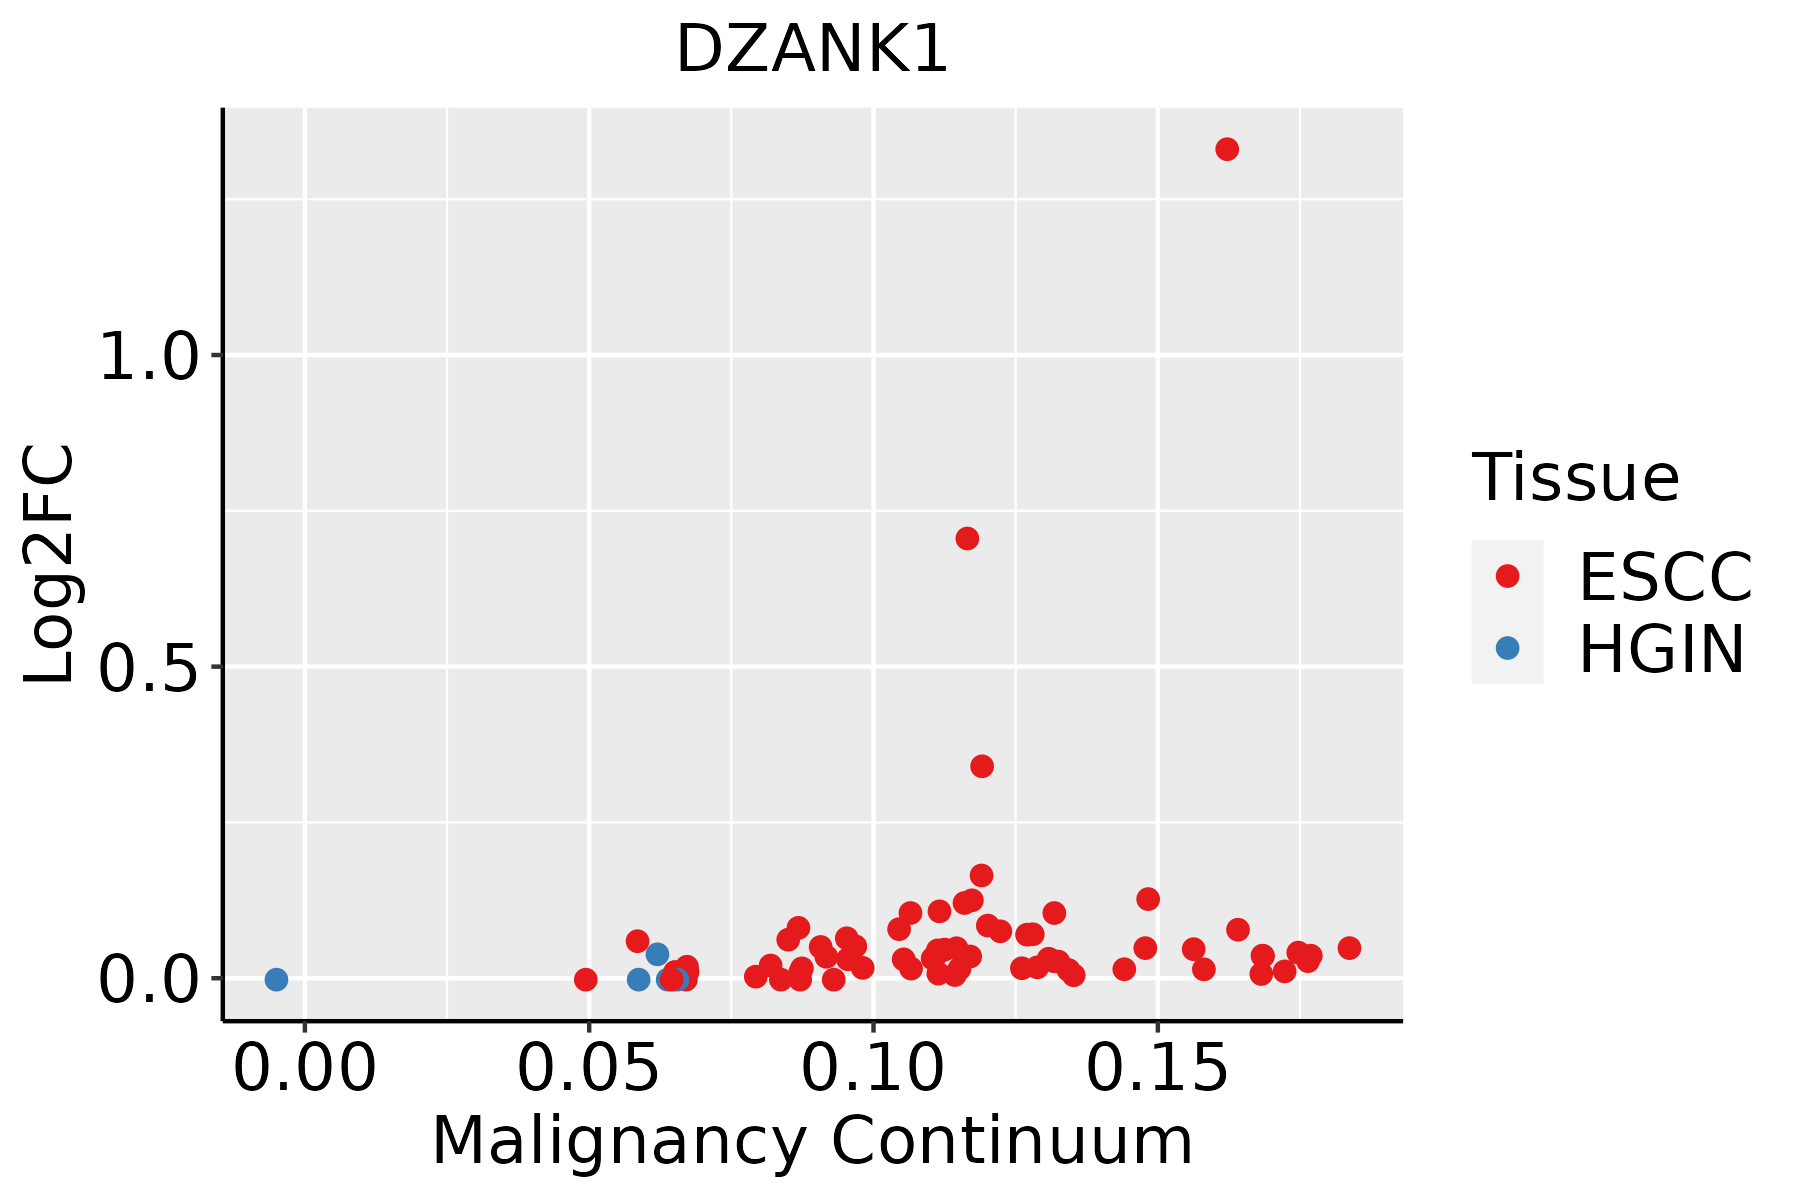 | ESCC: Esophageal squamous cell carcinoma |
| HGIN: High-grade intraepithelial neoplasias | ||
| LGIN: Low-grade intraepithelial neoplasias | ||
| Liver | 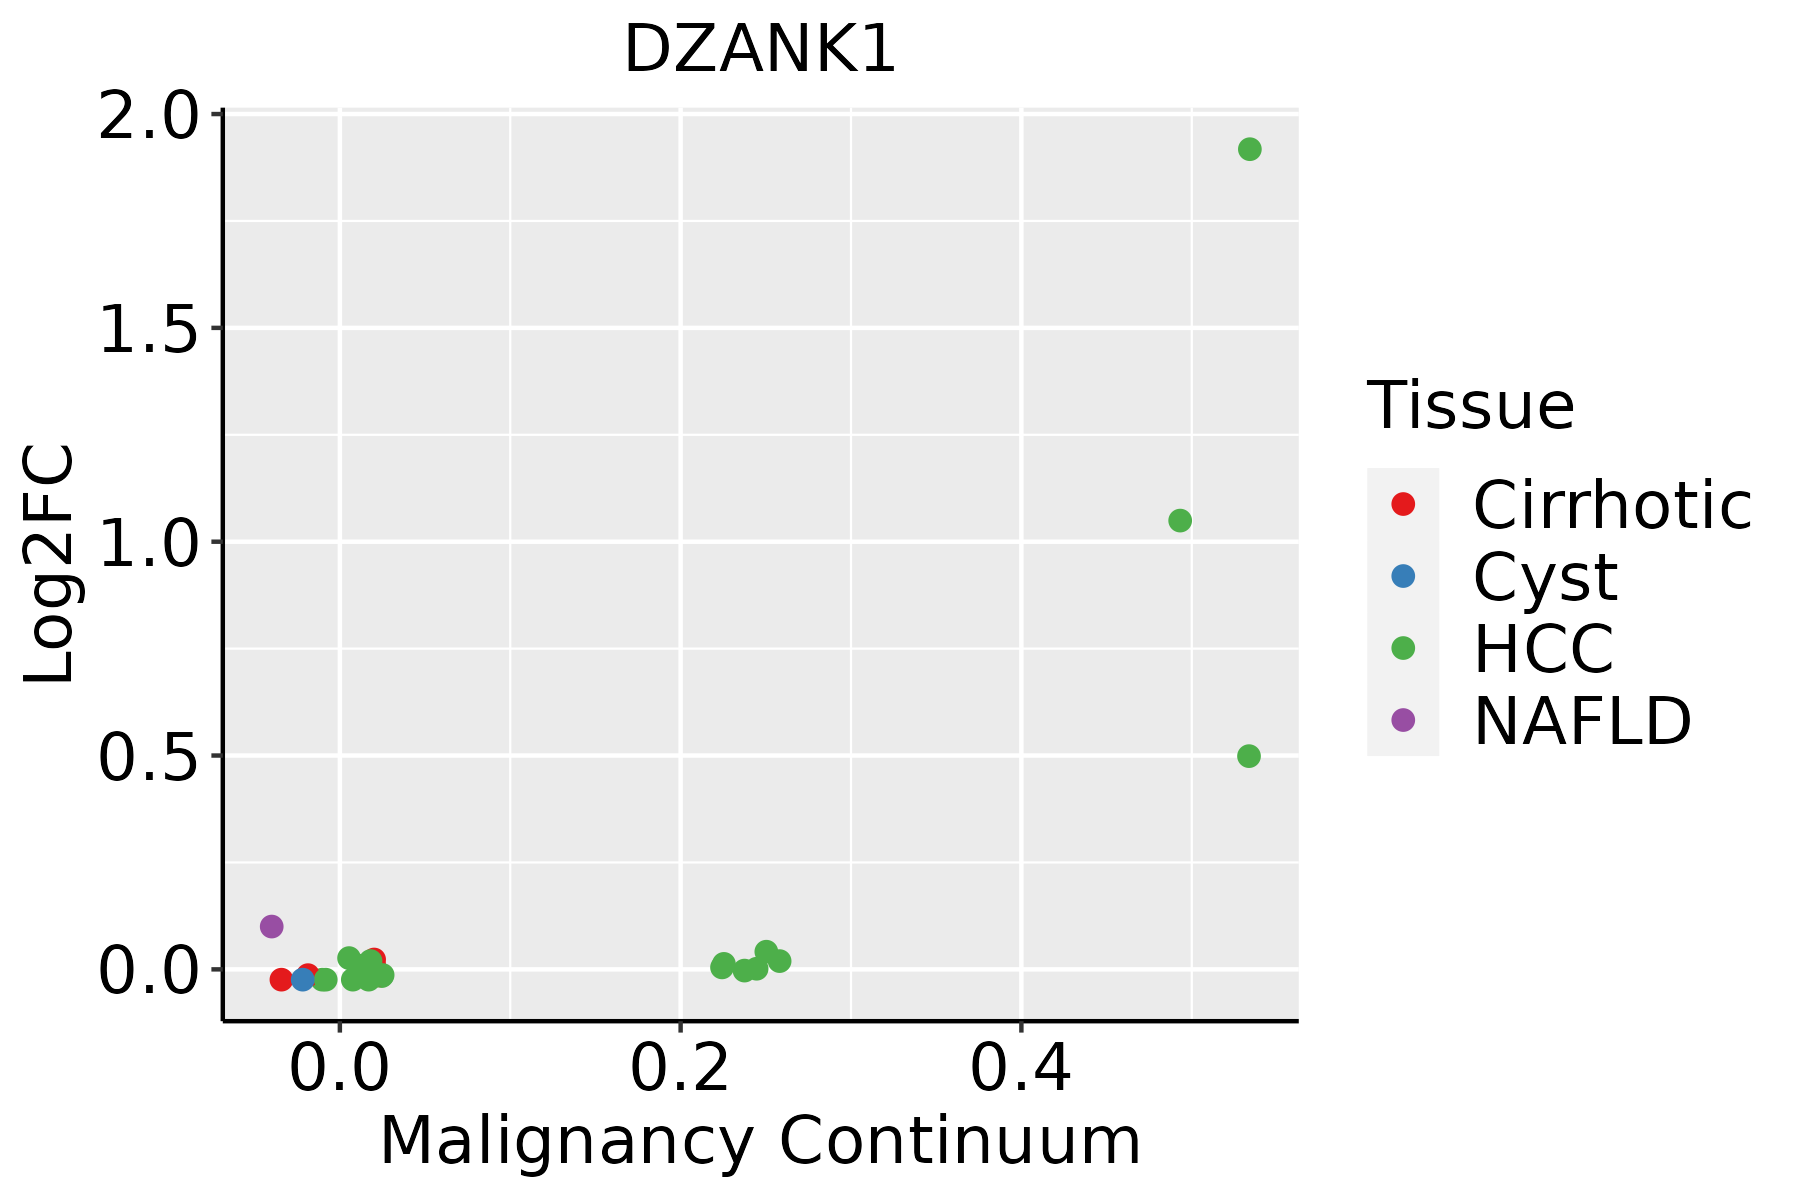 | HCC: Hepatocellular carcinoma |
| NAFLD: Non-alcoholic fatty liver disease |
| ∗log2FC in expression of this searched gene in stem-like cells from each diseased tissue sample relative to stem-like cells in normal samples in each tissue plotted against the malignancy continuum. Samples are colored based on if they are from different disease stage. |
Top |
Malignant transformation related pathway analysis |
| Find out the enriched GO biological processes and KEGG pathways involved in transition from healthy to precancer to cancer |
| Tissue | Disease Stage | Enriched GO biological Processes |
| Colorectum | AD |  |
| Colorectum | SER |  |
| Colorectum | MSS |  |
| Colorectum | MSI-H |  |
| Colorectum | FAP |  |
| ∗Top 15 enriched GO BP terms are showed in the bar plot of each disease state in each tissue. Each row represents a significant GO biological process which is colored according to the -log10(p.adjust). |
| Page: 1 2 3 4 5 6 7 8 9 |
| GO ID | Tissue | Disease Stage | Description | Gene Ratio | Bg Ratio | pvalue | p.adjust | Count |
| Page: 1 |
| Pathway ID | Tissue | Disease Stage | Description | Gene Ratio | Bg Ratio | pvalue | p.adjust | qvalue | Count |
| Page: 1 |
Top |
Cell-cell communication analysis |
| Identification of potential cell-cell interactions between two cell types and their ligand-receptor pairs for different disease states |
| Ligand | Receptor | LRpair | Pathway | Tissue | Disease Stage |
| Page: 1 |
Top |
Single-cell gene regulatory network inference analysis |
| Find out the significant the regulons (TFs) and the target genes of each regulon across cell types for different disease states |
| TF | Cell Type | Tissue | Disease Stage | Target Gene | RSS | Regulon Activity |
| ∗The dot plots of a searched regulon are shown for all cell subpopulations in each disease state of each tissue based on the regulon specific score inferred using pySCENIC and by calculating the average expression. |
| Page: 1 |
Top |
Somatic mutation of malignant transformation related genes |
| Annotation of somatic variants for genes involved in malignant transformation |
| Hugo Symbol | Variant Class | Variant Classification | dbSNP RS | HGVSc | HGVSp | HGVSp Short | SWISSPROT | BIOTYPE | SIFT | PolyPhen | Tumor Sample Barcode | Tissue | Histology | Sex | Age | Stage | Therapy Types | Drugs | Outcome |
| DZANK1 | SNV | Missense_Mutation | c.2114N>C | p.Lys705Thr | p.K705T | Q9NVP4 | protein_coding | deleterious(0.02) | benign(0.22) | TCGA-A1-A0SN-01 | Breast | breast invasive carcinoma | Female | <65 | I/II | Chemotherapy | ac | SD | |
| DZANK1 | SNV | Missense_Mutation | c.587N>A | p.Ser196Asn | p.S196N | Q9NVP4 | protein_coding | tolerated(0.08) | benign(0.175) | TCGA-AN-A0AK-01 | Breast | breast invasive carcinoma | Female | >=65 | I/II | Unknown | Unknown | SD | |
| DZANK1 | SNV | Missense_Mutation | novel | c.563T>C | p.Val188Ala | p.V188A | Q9NVP4 | protein_coding | tolerated(0.11) | benign(0.09) | TCGA-AO-A128-01 | Breast | breast invasive carcinoma | Female | <65 | I/II | Chemotherapy | doxorubicin | SD |
| DZANK1 | SNV | Missense_Mutation | rs777440151 | c.1669N>A | p.Glu557Lys | p.E557K | Q9NVP4 | protein_coding | deleterious(0.01) | probably_damaging(0.964) | TCGA-BH-A0HK-01 | Breast | breast invasive carcinoma | Female | >=65 | I/II | Hormone Therapy | arimidex | SD |
| DZANK1 | SNV | Missense_Mutation | c.600N>A | p.Met200Ile | p.M200I | Q9NVP4 | protein_coding | tolerated(0.08) | benign(0.173) | TCGA-D8-A1JN-01 | Breast | breast invasive carcinoma | Female | >=65 | III/IV | Hormone Therapy | anastrozolum | SD | |
| DZANK1 | SNV | Missense_Mutation | rs578058743 | c.802G>A | p.Val268Met | p.V268M | Q9NVP4 | protein_coding | deleterious(0) | possibly_damaging(0.871) | TCGA-E2-A1LK-01 | Breast | breast invasive carcinoma | Female | >=65 | III/IV | Unknown | Unknown | PD |
| DZANK1 | insertion | Frame_Shift_Ins | novel | c.1325_1326insAAATTTCATTTTGAAATTTAATCTCTATTGTGGTGGTATTAAG | p.Gly443AsnfsTer37 | p.G443Nfs*37 | Q9NVP4 | protein_coding | TCGA-A8-A09E-01 | Breast | breast invasive carcinoma | Female | >=65 | III/IV | Hormone Therapy | anastrozole | SD | ||
| DZANK1 | insertion | In_Frame_Ins | novel | c.1360_1361insTGCACAGTGCTATTGCTATCTGCCATTATC | p.Ala454delinsValHisSerAlaIleAlaIleCysHisTyrPro | p.A454delinsVHSAIAICHYP | Q9NVP4 | protein_coding | TCGA-BH-A0BR-01 | Breast | breast invasive carcinoma | Female | <65 | I/II | Unknown | Unknown | SD | ||
| DZANK1 | insertion | Nonsense_Mutation | novel | c.340_341insGAGAAGCACAATGAACCAAGGGTTT | p.Asp114GlyfsTer5 | p.D114Gfs*5 | Q9NVP4 | protein_coding | TCGA-BH-A0DG-01 | Breast | breast invasive carcinoma | Female | <65 | I/II | Chemotherapy | taxotere | CR | ||
| DZANK1 | SNV | Missense_Mutation | novel | c.1319A>T | p.Tyr440Phe | p.Y440F | Q9NVP4 | protein_coding | tolerated(0.07) | possibly_damaging(0.669) | TCGA-C5-A8YR-01 | Cervix | cervical & endocervical cancer | Female | <65 | I/II | Unknown | Unknown | PD |
| Page: 1 2 3 4 5 6 7 8 9 10 |
Top |
Related drugs of malignant transformation related genes |
| Identification of chemicals and drugs interact with genes involved in malignant transfromation |
| (DGIdb 4.0) |
| Entrez ID | Symbol | Category | Interaction Types | Drug Claim Name | Drug Name | PMIDs |
| Page: 1 |

Copyright 2023-Present -The University of Texas Health Science Center at Houston |