Schematic overview of the cellular and molecular mechanisms involved in the cancer progression, including the proposed cellular and molecular mechanisms in cancer cells trajectory. AT1: alveolar type 1 cells; AT2: alveolar type 2 cells; AAH: atypical adenomatous hyperplasia; AIS: adenocarcinoma in situ; MIA: minimally invasive adenocarcinoma; IA: invasive adenocarcinoma; EMT: epithelial-mesenchymal transition

Home

Download

Statistics

Help

Contact

Center for Computational Systems Medicine
leaf

Gene summary

leaf

Malignant transformation analysis

leaf

Malignant transformation related pathway analysis

leaf

Cell-cell communication analysis

leaf

Single-cell gene regulatory network inference analysis

leaf

Somatic mutation of malignant transformation related genes

leaf

Related drugs of malignant transformation related genes

Gene: DYRK4

Gene summary for DYRK4

check button Gene summary.

Gene informationSpeciesHuman
Gene symbol

DYRK4

Gene ID

8798

Gene namedual specificity tyrosine phosphorylation regulated kinase 4
Gene AliasDYRK4
Cytomap12p13.32
Gene Typeprotein-coding
GO ID

GO:0006464

UniProtAcc

D3JEN2


Top

Malignant transformation analysis

check button Identification of the aberrant gene expression in precancerous and cancerous lesions by comparing the gene expression of stem-like cells in diseased tissues with normal stem cells
check button Malignant transformation involving gene list.
Entrez IDSymbolReplicatesSpeciesOrganTissueAdj P-valueLog2FCMalignancy
8798DYRK4HTA11_3410_2000001011HumanColorectumAD3.66e-021.24e-010.0155
8798DYRK4HTA11_1938_2000001011HumanColorectumAD2.30e-021.94e-01-0.0811
8798DYRK4HTA11_347_2000001011HumanColorectumAD5.50e-031.47e-01-0.1954
8798DYRK4HTA11_696_2000001011HumanColorectumAD3.85e-041.55e-01-0.1464
8798DYRK4HTA11_866_2000001011HumanColorectumAD2.05e-061.97e-01-0.1001
8798DYRK4HTA11_1391_2000001011HumanColorectumAD2.63e-072.58e-01-0.059
8798DYRK4HTA11_7696_3000711011HumanColorectumAD2.07e-081.77e-010.0674
8798DYRK4HTA11_99999965062_69753HumanColorectumMSI-H9.21e-045.32e-010.3487
8798DYRK4HTA11_99999974143_84620HumanColorectumMSS9.04e-051.29e-010.3005
8798DYRK4LZE7THumanEsophagusESCC5.37e-052.78e-010.0667
8798DYRK4LZE24THumanEsophagusESCC1.61e-103.29e-010.0596
8798DYRK4P2T-EHumanEsophagusESCC3.15e-559.69e-010.1177
8798DYRK4P4T-EHumanEsophagusESCC3.05e-449.47e-010.1323
8798DYRK4P5T-EHumanEsophagusESCC6.53e-182.43e-010.1327
8798DYRK4P8T-EHumanEsophagusESCC1.76e-131.76e-010.0889
8798DYRK4P9T-EHumanEsophagusESCC3.18e-122.52e-010.1131
8798DYRK4P10T-EHumanEsophagusESCC1.47e-213.59e-010.116
8798DYRK4P11T-EHumanEsophagusESCC5.68e-114.70e-010.1426
8798DYRK4P12T-EHumanEsophagusESCC3.96e-538.84e-010.1122
8798DYRK4P16T-EHumanEsophagusESCC1.75e-203.84e-010.1153
Page: 1 2 3 4 5 

check button Transcriptomic changes along malignancy continuum.
TissueExpression DynamicsAbbreviation
Colorectum (GSE201348)The image shows the transcriptomic changes along malignancy continuum.log2FC in expression of this searched gene in stem-like cells from each diseased tissue sample relative to stem-like cells in normal samples in each tissue plotted against the malignancy continuum. Samples are colored based on if they are from different disease stage.FAP: Familial adenomatous polyposis
CRC: Colorectal cancer
Colorectum (HTA11)The image shows the transcriptomic changes along malignancy continuum.log2FC in expression of this searched gene in stem-like cells from each diseased tissue sample relative to stem-like cells in normal samples in each tissue plotted against the malignancy continuum. Samples are colored based on if they are from different disease stage.AD: Adenomas
SER: Sessile serrated lesions
MSI-H: Microsatellite-high colorectal cancer
MSS: Microsatellite stable colorectal cancer
EsophagusThe image shows the transcriptomic changes along malignancy continuum.log2FC in expression of this searched gene in stem-like cells from each diseased tissue sample relative to stem-like cells in normal samples in each tissue plotted against the malignancy continuum. Samples are colored based on if they are from different disease stage.
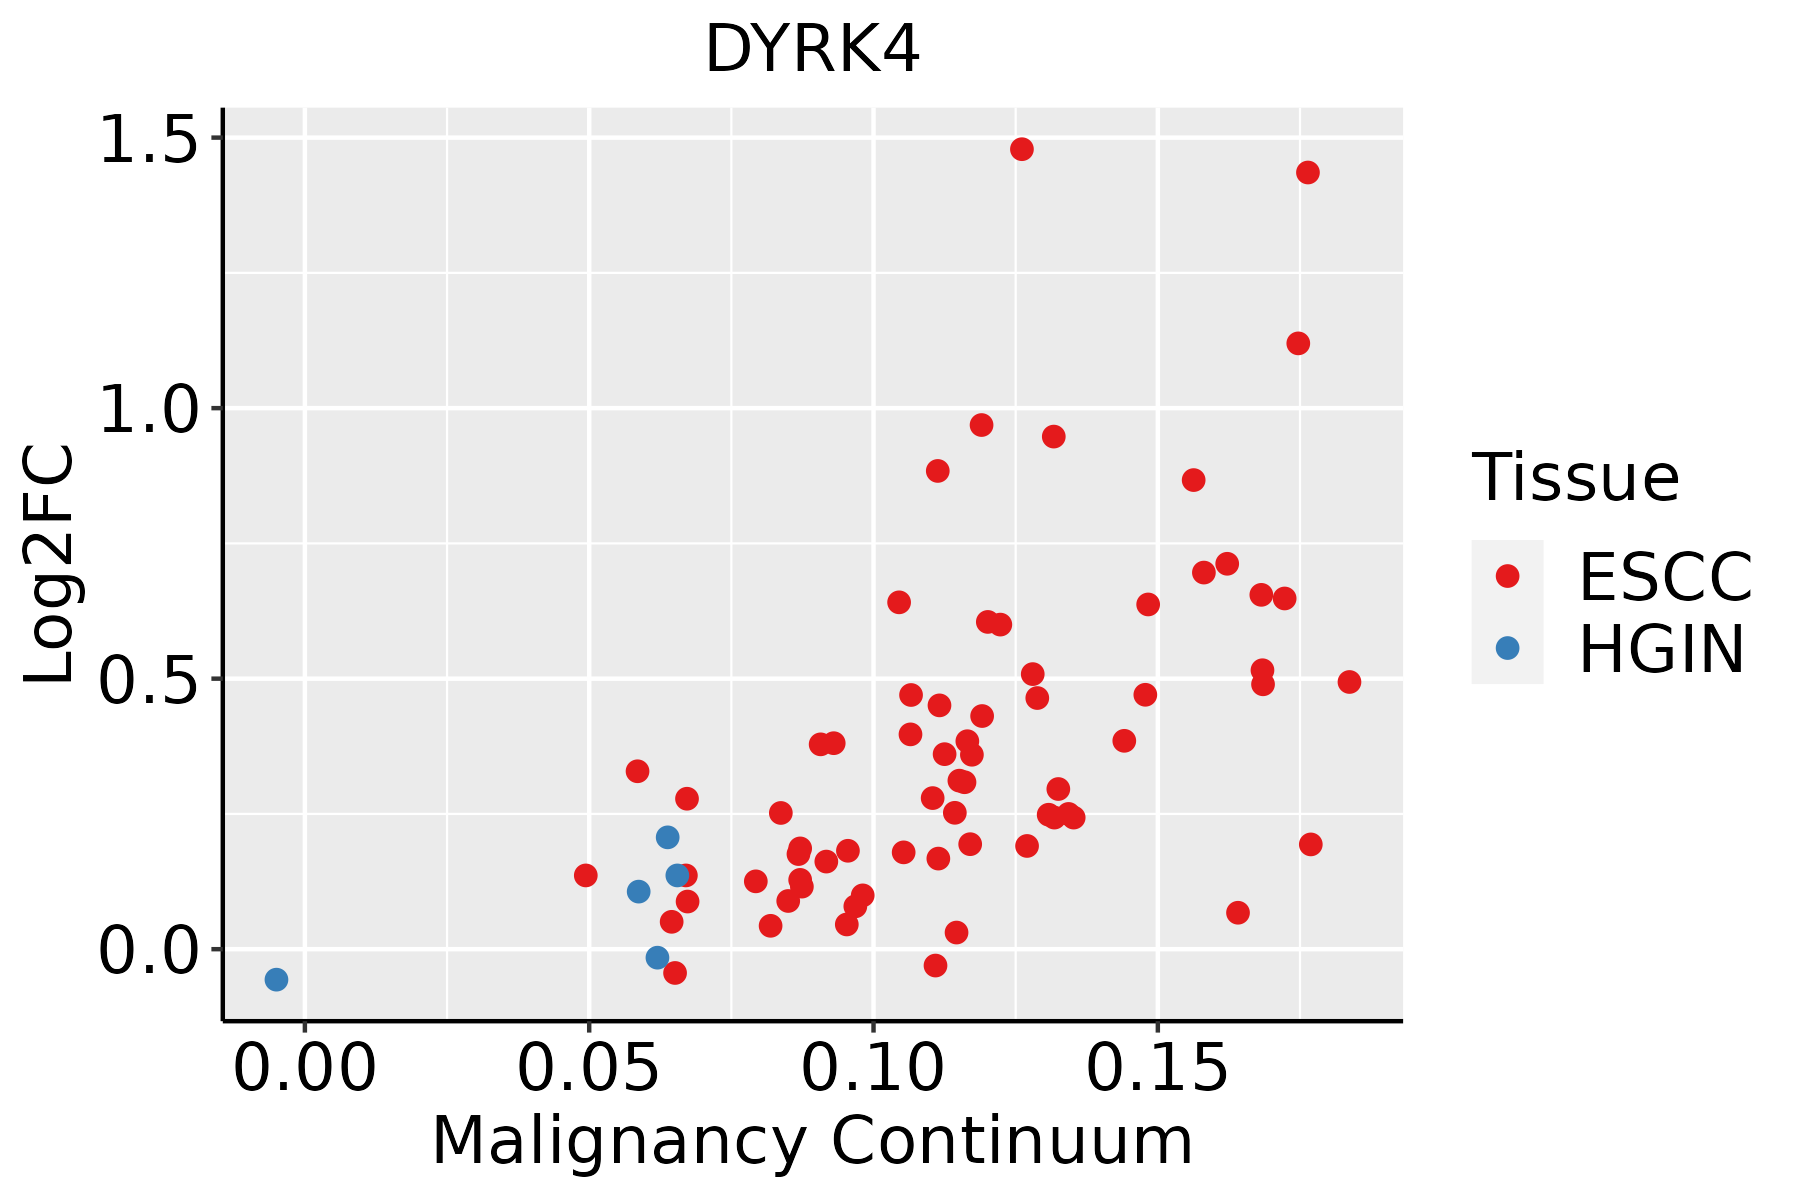
ESCC: Esophageal squamous cell carcinoma
HGIN: High-grade intraepithelial neoplasias
LGIN: Low-grade intraepithelial neoplasias
Oral CavityThe image shows the transcriptomic changes along malignancy continuum.log2FC in expression of this searched gene in stem-like cells from each diseased tissue sample relative to stem-like cells in normal samples in each tissue plotted against the malignancy continuum. Samples are colored based on if they are from different disease stage.
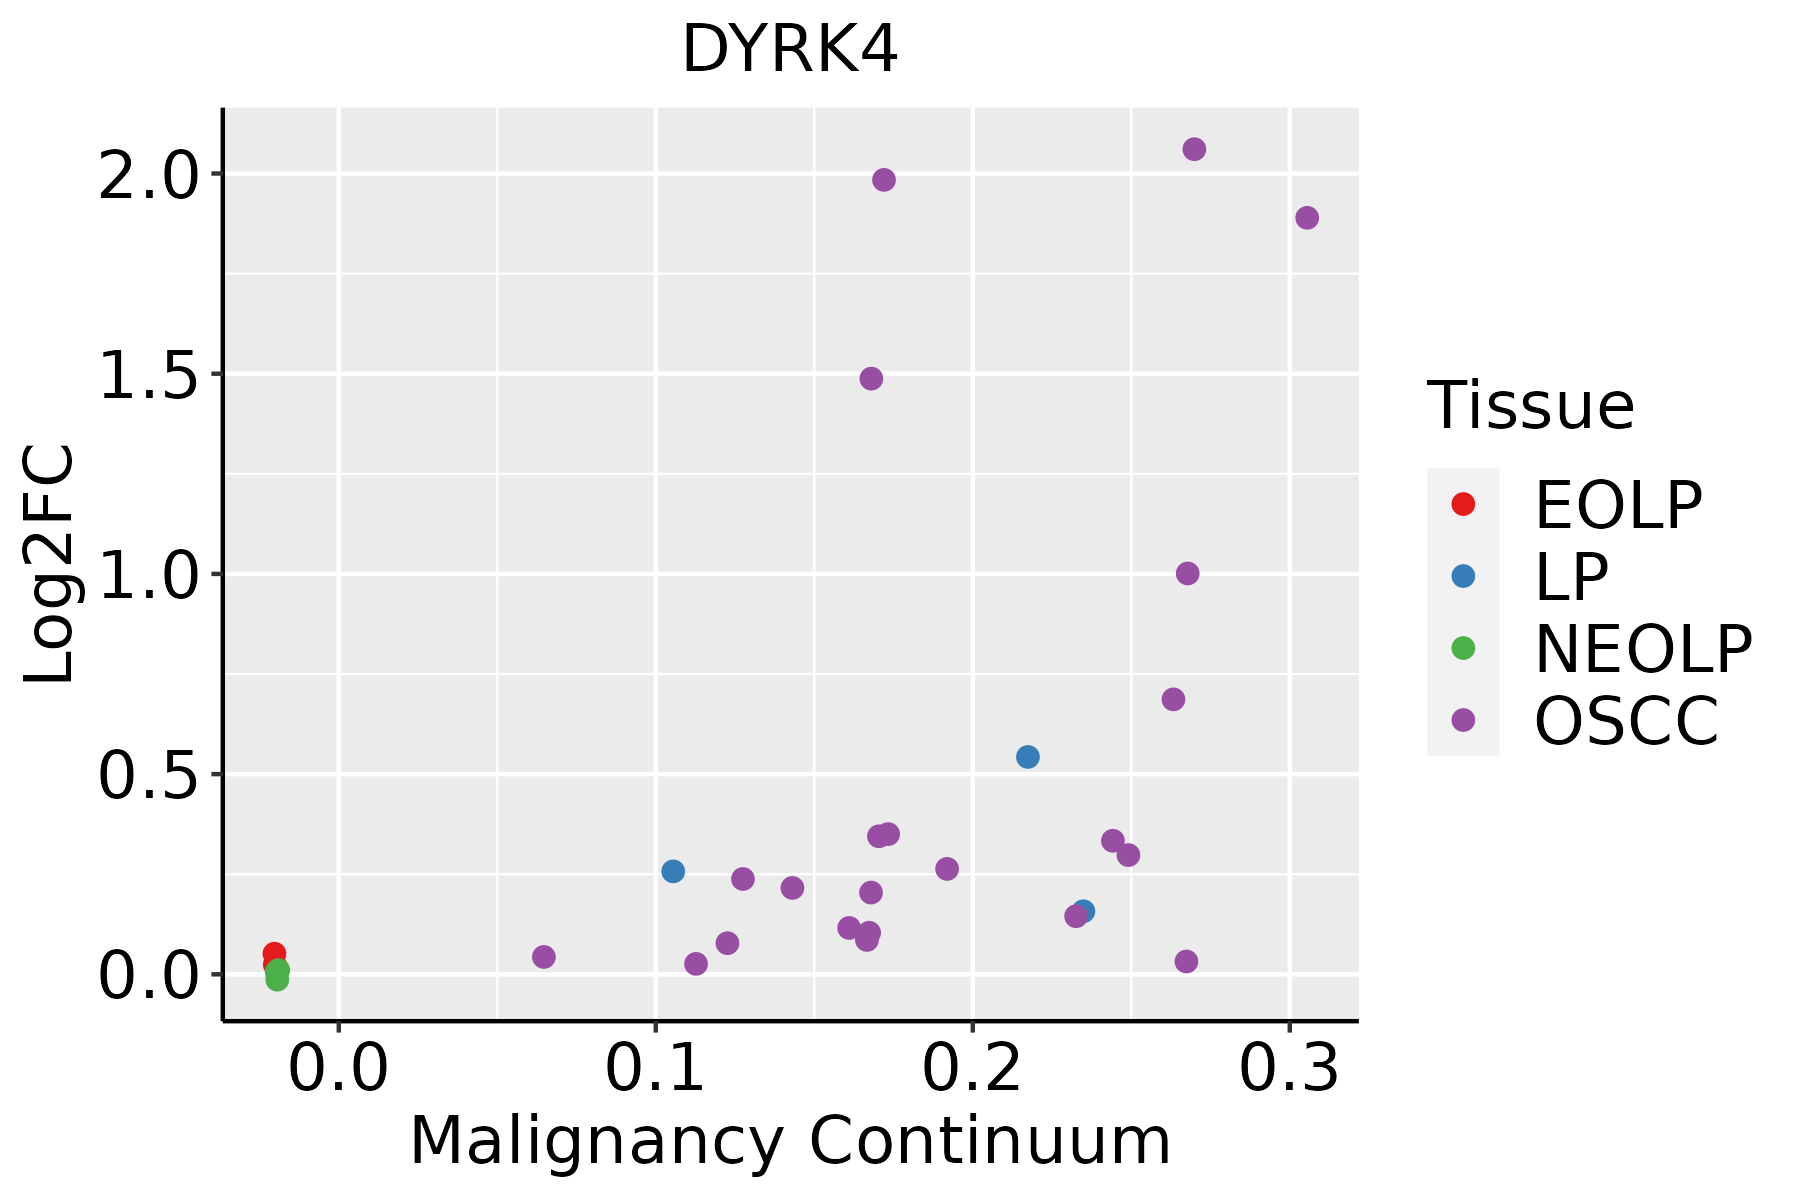
EOLP: Erosive Oral lichen planus
LP: leukoplakia
NEOLP: Non-erosive oral lichen planus
OSCC: Oral squamous cell carcinoma
ThyroidThe image shows the transcriptomic changes along malignancy continuum.log2FC in expression of this searched gene in stem-like cells from each diseased tissue sample relative to stem-like cells in normal samples in each tissue plotted against the malignancy continuum. Samples are colored based on if they are from different disease stage.
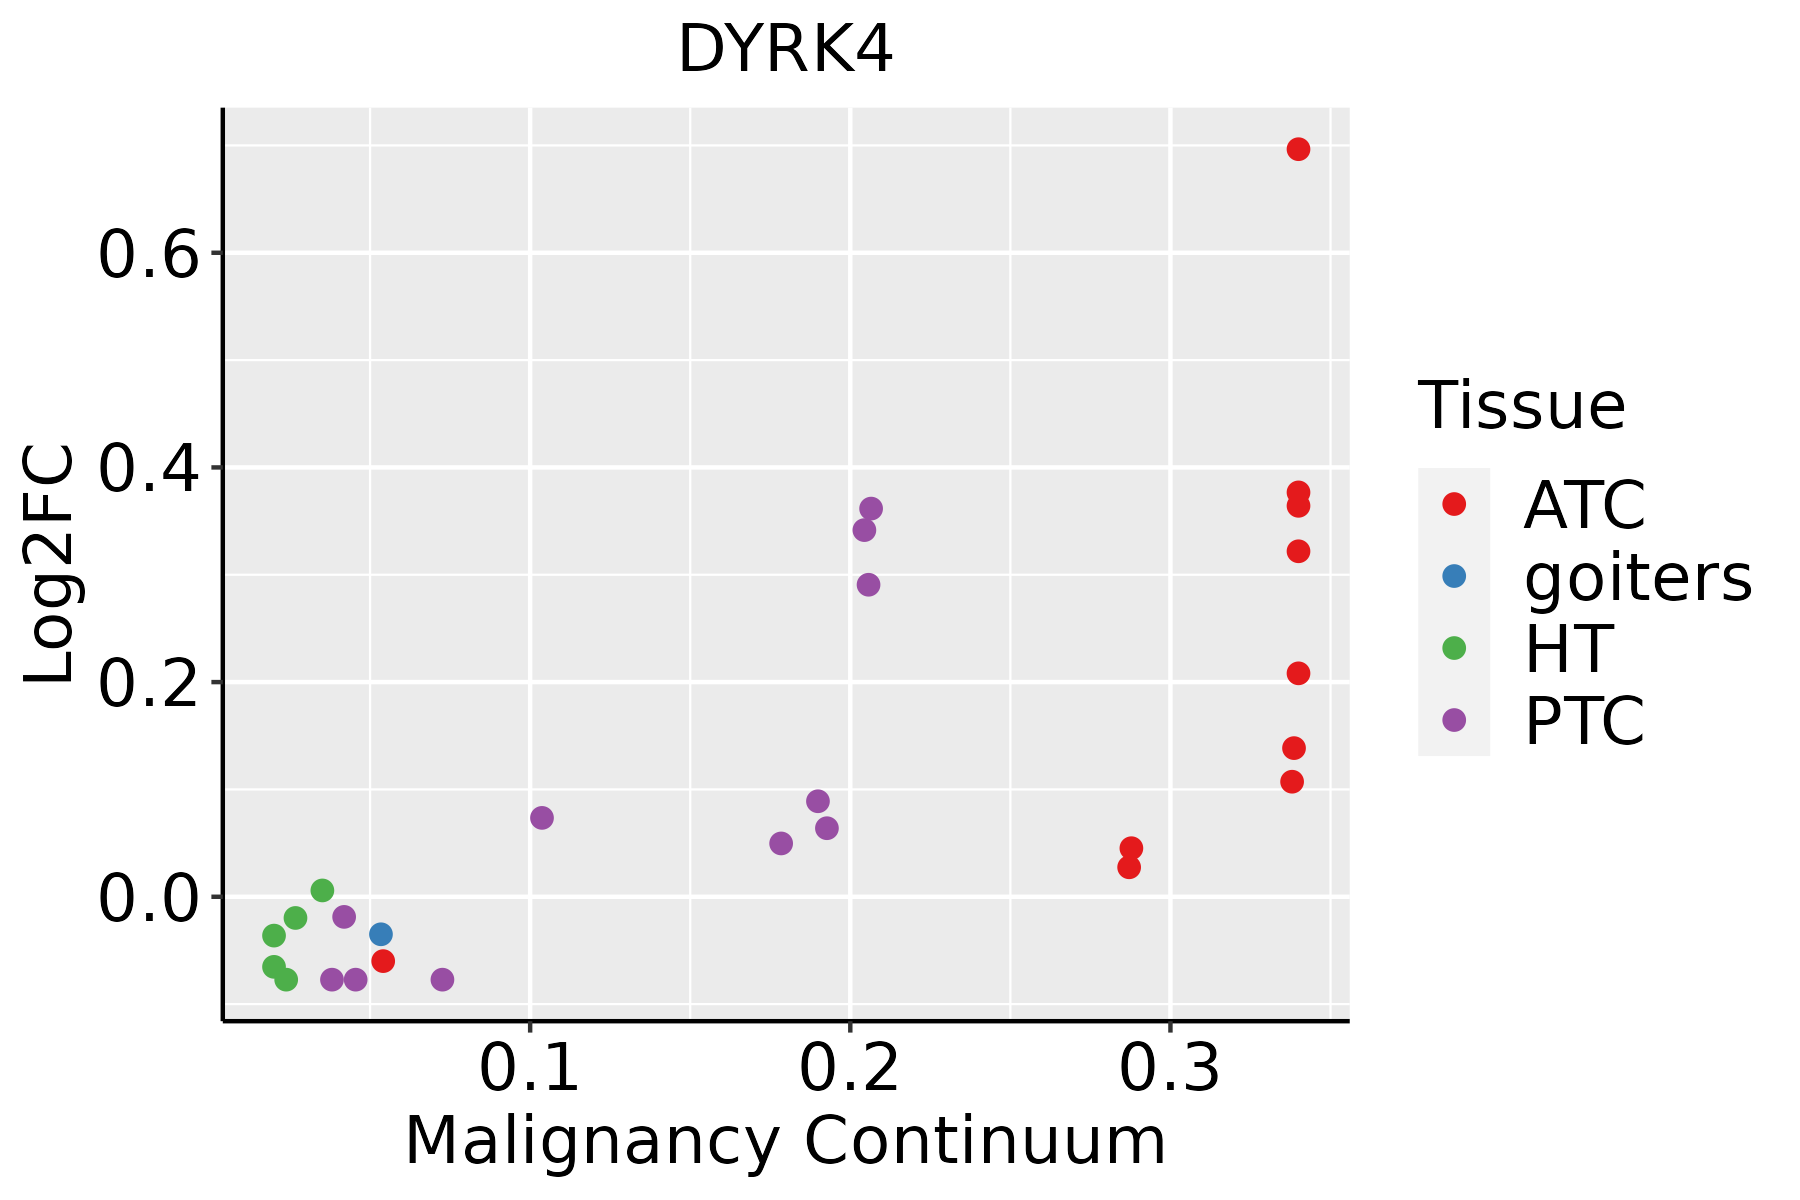
ATC: Anaplastic thyroid cancer
HT: Hashimoto's thyroiditis
PTC: Papillary thyroid cancer
∗log2FC in expression of this searched gene in stem-like cells from each diseased tissue sample relative to stem-like cells in normal samples in each tissue plotted against the malignancy continuum. Samples are colored based on if they are from different disease stage.

Top

Malignant transformation related pathway analysis

check buttonFind out the enriched GO biological processes and KEGG pathways involved in transition from healthy to precancer to cancer
check button Figure of enriched GO biological processes.
TissueDisease StageEnriched GO biological Processes
ColorectumADGO analysis - Figure of enriched GO biological processes: Top 15 enriched GO BP terms are showed in the bar plot of each disease state in each tissue. Each row represents a significant GO biological process which is colored according to the -log10(p.adjust).
ColorectumSERGO analysis - Figure of enriched GO biological processes: Top 15 enriched GO BP terms are showed in the bar plot of each disease state in each tissue. Each row represents a significant GO biological process which is colored according to the -log10(p.adjust).
ColorectumMSSGO analysis - Figure of enriched GO biological processes: Top 15 enriched GO BP terms are showed in the bar plot of each disease state in each tissue. Each row represents a significant GO biological process which is colored according to the -log10(p.adjust).
ColorectumMSI-HGO analysis - Figure of enriched GO biological processes: Top 15 enriched GO BP terms are showed in the bar plot of each disease state in each tissue. Each row represents a significant GO biological process which is colored according to the -log10(p.adjust).
ColorectumFAPGO analysis - Figure of enriched GO biological processes: Top 15 enriched GO BP terms are showed in the bar plot of each disease state in each tissue. Each row represents a significant GO biological process which is colored according to the -log10(p.adjust).
∗Top 15 enriched GO BP terms are showed in the bar plot of each disease state in each tissue. Each row represents a significant GO biological process which is colored according to the -log10(p.adjust).
Page: 1 2 3 4 5 6 7 8 9 

check button Enriched GO biological processes.
GO IDTissueDisease StageDescriptionGene RatioBg Ratiopvaluep.adjustCount
GO:0018105ColorectumADpeptidyl-serine phosphorylation88/3918315/187231.73e-031.43e-0288
GO:0018210ColorectumADpeptidyl-threonine modification40/3918125/187232.44e-031.88e-0240
GO:0018209ColorectumADpeptidyl-serine modification92/3918338/187233.19e-032.36e-0292
GO:0018107ColorectumADpeptidyl-threonine phosphorylation37/3918116/187233.68e-032.61e-0237
GO:00181052ColorectumMSSpeptidyl-serine phosphorylation81/3467315/187238.92e-049.12e-0381
GO:00182091ColorectumMSSpeptidyl-serine modification84/3467338/187232.12e-031.79e-0284
GO:00181071ColorectumMSSpeptidyl-threonine phosphorylation34/3467116/187233.08e-032.34e-0234
GO:00182101ColorectumMSSpeptidyl-threonine modification36/3467125/187233.28e-032.49e-0236
GO:00182099EsophagusESCCpeptidyl-serine modification196/8552338/187233.07e-063.47e-05196
GO:001810515EsophagusESCCpeptidyl-serine phosphorylation184/8552315/187233.22e-063.61e-05184
GO:00182124EsophagusESCCpeptidyl-tyrosine modification202/8552378/187231.34e-036.39e-03202
GO:00181084EsophagusESCCpeptidyl-tyrosine phosphorylation200/8552375/187231.60e-037.45e-03200
GO:001810710EsophagusESCCpeptidyl-threonine phosphorylation66/8552116/187239.76e-033.37e-0266
GO:001821010EsophagusESCCpeptidyl-threonine modification70/8552125/187231.29e-024.25e-0270
GO:00182098Oral cavityOSCCpeptidyl-serine modification175/7305338/187231.09e-061.46e-05175
GO:001810510Oral cavityOSCCpeptidyl-serine phosphorylation164/7305315/187231.51e-061.99e-05164
GO:00182123Oral cavityOSCCpeptidyl-tyrosine modification180/7305378/187233.63e-042.22e-03180
GO:00181083Oral cavityOSCCpeptidyl-tyrosine phosphorylation177/7305375/187236.86e-043.83e-03177
GO:00181079Oral cavityOSCCpeptidyl-threonine phosphorylation60/7305116/187233.59e-031.50e-0260
GO:00182109Oral cavityOSCCpeptidyl-threonine modification64/7305125/187233.68e-031.52e-0264
Page: 1 2 

check button Enriched KEGG pathways.
Pathway IDTissueDisease StageDescriptionGene RatioBg Ratiopvaluep.adjustqvalueCount
Page: 1 

Top

Cell-cell communication analysis

check buttonIdentification of potential cell-cell interactions between two cell types and their ligand-receptor pairs for different disease states
LigandReceptorLRpairPathwayTissueDisease Stage
Page: 1 

Top

Single-cell gene regulatory network inference analysis

check buttonFind out the significant the regulons (TFs) and the target genes of each regulon across cell types for different disease states
TFCell TypeTissueDisease StageTarget GeneRSSRegulon Activity
∗The dot plots of a searched regulon are shown for all cell subpopulations in each disease state of each tissue based on the regulon specific score inferred using pySCENIC and by calculating the average expression.
Page: 1 

Top

Somatic mutation of malignant transformation related genes

check buttonAnnotation of somatic variants for genes involved in malignant transformation
Hugo SymbolVariant ClassVariant ClassificationdbSNP RSHGVScHGVSpHGVSp ShortSWISSPROTBIOTYPESIFTPolyPhenTumor Sample BarcodeTissueHistologySexAgeStageTherapy TypesDrugsOutcome
DYRK4SNVMissense_Mutationc.1176C>Ap.Asp392Glup.D392EQ9NR20protein_codingtolerated(0.31)benign(0.006)TCGA-D8-A1JL-01Breastbreast invasive carcinomaFemale>=65I/IIUnknownUnknownSD
DYRK4SNVMissense_Mutationc.606C>Ap.Phe202Leup.F202LQ9NR20protein_codingdeleterious(0.02)benign(0.107)TCGA-E9-A1QZ-01Breastbreast invasive carcinomaFemale<65I/IIUnknownUnknownSD
DYRK4insertionNonsense_Mutationnovelc.1303_1304insCATTAGCATTATTATTTTATCTTGGTTGGTGTTAAGCCATTTAp.His435ProfsTer12p.H435Pfs*12Q9NR20protein_codingTCGA-A8-A085-01Breastbreast invasive carcinomaMale<65I/IIHormone TherapytamoxiphenSD
DYRK4insertionIn_Frame_Insnovelc.380_381insAACAGAAGTCTTGTTCCCTATAAGTCTTTTTCTp.Asn127delinsLysThrGluValLeuPheProIleSerLeuPheLeup.N127delinsKTEVLFPISLFLQ9NR20protein_codingTCGA-A8-A09Z-01Breastbreast invasive carcinomaFemale>=65I/IIUnknownUnknownSD
DYRK4deletionFrame_Shift_Delnovelc.498delNp.Val167CysfsTer3p.V167Cfs*3Q9NR20protein_codingTCGA-EW-A2FV-01Breastbreast invasive carcinomaFemale<65III/IVChemotherapydocetaxelSD
DYRK4SNVMissense_Mutationrs149277354c.697N>Tp.Pro233Serp.P233SQ9NR20protein_codingdeleterious(0)probably_damaging(0.993)TCGA-2W-A8YY-01Cervixcervical & endocervical cancerFemale<65I/IIChemotherapycisplatinCR
DYRK4SNVMissense_Mutationnovelc.734N>Tp.Ser245Phep.S245FQ9NR20protein_codingdeleterious(0)possibly_damaging(0.657)TCGA-2W-A8YY-01Cervixcervical & endocervical cancerFemale<65I/IIChemotherapycisplatinCR
DYRK4SNVMissense_Mutationrs766865898c.220N>Ap.Asp74Asnp.D74NQ9NR20protein_codingtolerated(0.71)benign(0)TCGA-AA-3811-01Colorectumcolon adenocarcinomaFemale>=65III/IVUnknownUnknownPD
DYRK4SNVMissense_Mutationc.377N>Tp.Asn126Ilep.N126IQ9NR20protein_codingdeleterious(0.03)benign(0.091)TCGA-AA-3818-01Colorectumcolon adenocarcinomaFemale>=65I/IIUnknownUnknownPD
DYRK4SNVMissense_Mutationnovelc.1486N>Cp.Glu496Glnp.E496QQ9NR20protein_codingtolerated_low_confidence(0.07)benign(0.01)TCGA-AA-3979-01Colorectumcolon adenocarcinomaMale>=65I/IIUnknownUnknownSD
Page: 1 2 3 4 5 6 7 8 9 

Top

Related drugs of malignant transformation related genes

check buttonIdentification of chemicals and drugs interact with genes involved in malignant transfromation
(DGIdb 4.0)
Entrez IDSymbolCategoryInteraction TypesDrug Claim NameDrug NamePMIDs
8798DYRK4ENZYME, KINASE, DRUGGABLE GENOME, TYROSINE KINASE, SERINE THREONINE KINASEinhibitor249565847
8798DYRK4ENZYME, KINASE, DRUGGABLE GENOME, TYROSINE KINASE, SERINE THREONINE KINASETAMATINIBR-406
8798DYRK4ENZYME, KINASE, DRUGGABLE GENOME, TYROSINE KINASE, SERINE THREONINE KINASEPHA-767491CHEMBL225519
Page: 1