
|
|||||
|
 | |
| |
| |
| |
| |
| |
|
Gene: DYRK1B |
Gene summary for DYRK1B |
| Gene information | Species | Human | Gene symbol | DYRK1B | Gene ID | 9149 |
| Gene name | dual specificity tyrosine phosphorylation regulated kinase 1B | |
| Gene Alias | AOMS3 | |
| Cytomap | 19q13.2 | |
| Gene Type | protein-coding | GO ID | GO:0000768 | UniProtAcc | A0A024R0I0 |
Top |
Malignant transformation analysis |
| Identification of the aberrant gene expression in precancerous and cancerous lesions by comparing the gene expression of stem-like cells in diseased tissues with normal stem cells |
| Entrez ID | Symbol | Replicates | Species | Organ | Tissue | Adj P-value | Log2FC | Malignancy |
| 9149 | DYRK1B | HCC1_Meng | Human | Liver | HCC | 7.68e-21 | 2.43e-02 | 0.0246 |
| 9149 | DYRK1B | HCC2_Meng | Human | Liver | HCC | 1.62e-08 | 7.64e-02 | 0.0107 |
| 9149 | DYRK1B | S014 | Human | Liver | HCC | 7.43e-19 | 7.33e-01 | 0.2254 |
| 9149 | DYRK1B | S015 | Human | Liver | HCC | 1.45e-16 | 7.42e-01 | 0.2375 |
| 9149 | DYRK1B | S016 | Human | Liver | HCC | 2.01e-28 | 8.56e-01 | 0.2243 |
| 9149 | DYRK1B | S028 | Human | Liver | HCC | 1.59e-04 | 2.99e-01 | 0.2503 |
| 9149 | DYRK1B | S029 | Human | Liver | HCC | 4.84e-05 | 2.83e-01 | 0.2581 |
| 9149 | DYRK1B | C38 | Human | Oral cavity | OSCC | 2.21e-02 | 5.29e-01 | 0.172 |
| 9149 | DYRK1B | C46 | Human | Oral cavity | OSCC | 2.00e-02 | 1.51e-01 | 0.1673 |
| 9149 | DYRK1B | LN22 | Human | Oral cavity | OSCC | 9.15e-14 | 1.16e+00 | 0.1733 |
| 9149 | DYRK1B | SYSMH1 | Human | Oral cavity | OSCC | 2.88e-02 | 1.24e-01 | 0.1127 |
| 9149 | DYRK1B | male-WTA | Human | Thyroid | PTC | 6.14e-08 | 1.12e-01 | 0.1037 |
| 9149 | DYRK1B | PTC01 | Human | Thyroid | PTC | 1.91e-07 | 1.34e-01 | 0.1899 |
| 9149 | DYRK1B | PTC04 | Human | Thyroid | PTC | 1.44e-11 | 9.98e-02 | 0.1927 |
| 9149 | DYRK1B | PTC05 | Human | Thyroid | PTC | 3.28e-09 | 2.68e-01 | 0.2065 |
| 9149 | DYRK1B | PTC06 | Human | Thyroid | PTC | 1.83e-13 | 2.76e-01 | 0.2057 |
| 9149 | DYRK1B | PTC07 | Human | Thyroid | PTC | 8.60e-20 | 1.83e-01 | 0.2044 |
| 9149 | DYRK1B | ATC13 | Human | Thyroid | ATC | 1.70e-62 | 1.18e+00 | 0.34 |
| 9149 | DYRK1B | ATC1 | Human | Thyroid | ATC | 9.05e-03 | 1.80e-01 | 0.2878 |
| 9149 | DYRK1B | ATC5 | Human | Thyroid | ATC | 1.78e-63 | 1.27e+00 | 0.34 |
| Page: 1 |
| Tissue | Expression Dynamics | Abbreviation |
| Liver | 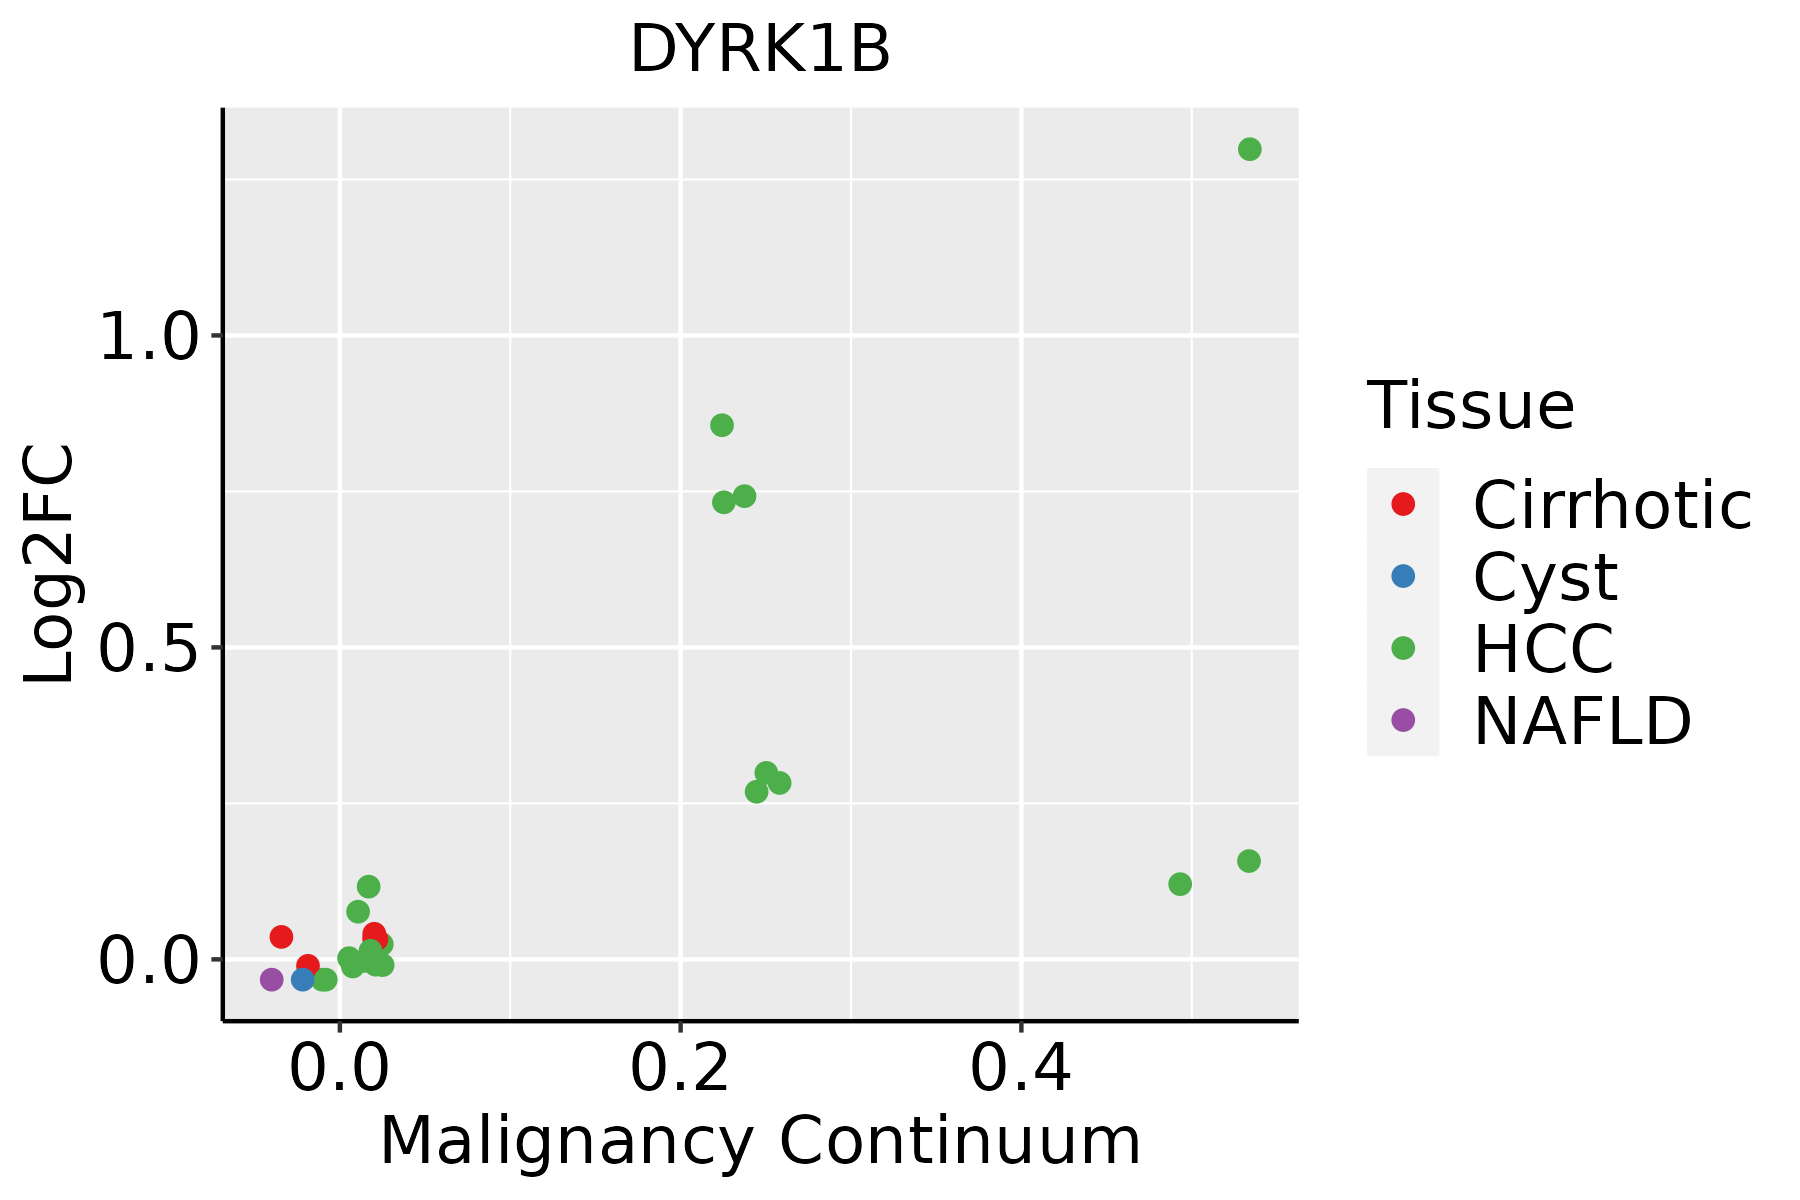 | HCC: Hepatocellular carcinoma |
| NAFLD: Non-alcoholic fatty liver disease | ||
| Oral Cavity | 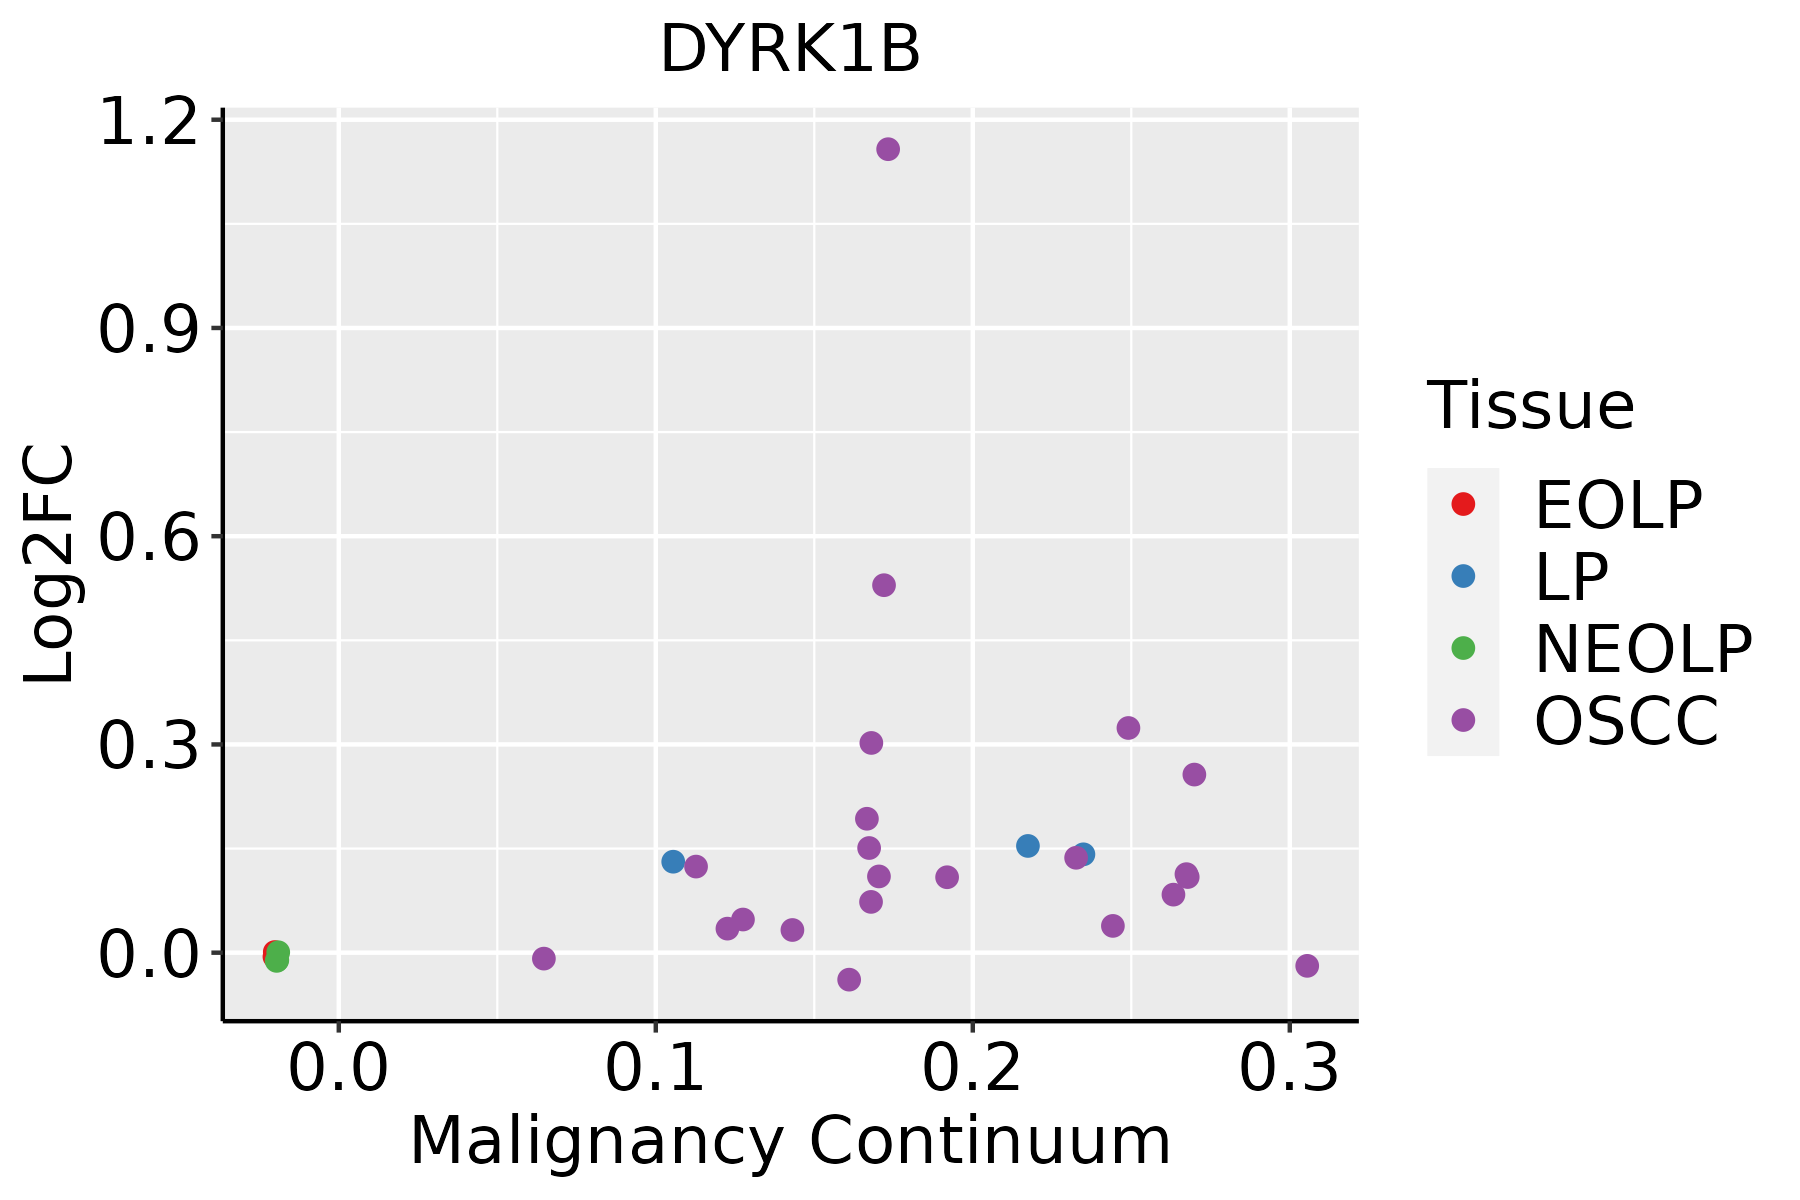 | EOLP: Erosive Oral lichen planus |
| LP: leukoplakia | ||
| NEOLP: Non-erosive oral lichen planus | ||
| OSCC: Oral squamous cell carcinoma | ||
| Thyroid | 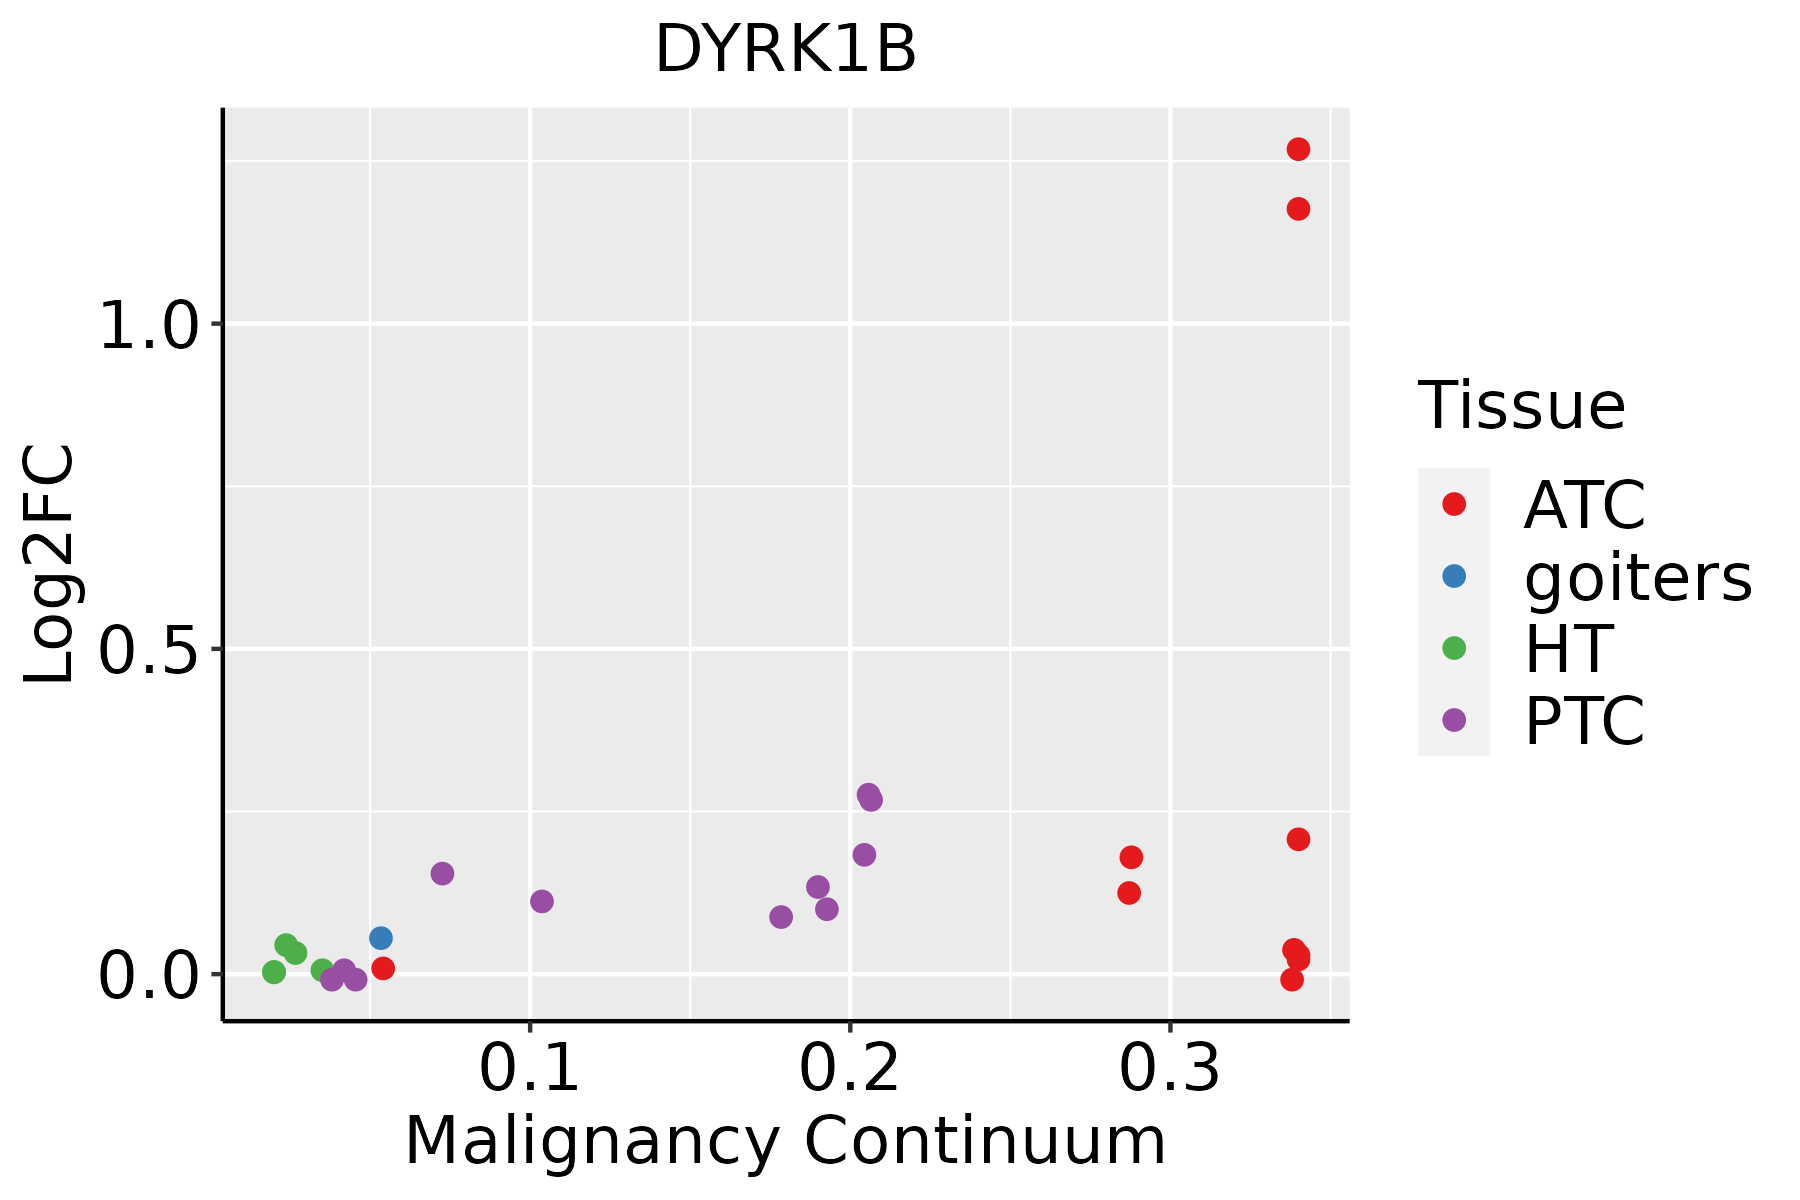 | ATC: Anaplastic thyroid cancer |
| HT: Hashimoto's thyroiditis | ||
| PTC: Papillary thyroid cancer |
| ∗log2FC in expression of this searched gene in stem-like cells from each diseased tissue sample relative to stem-like cells in normal samples in each tissue plotted against the malignancy continuum. Samples are colored based on if they are from different disease stage. |
Top |
Malignant transformation related pathway analysis |
| Find out the enriched GO biological processes and KEGG pathways involved in transition from healthy to precancer to cancer |
| Tissue | Disease Stage | Enriched GO biological Processes |
| Colorectum | AD |  |
| Colorectum | SER |  |
| Colorectum | MSS |  |
| Colorectum | MSI-H |  |
| Colorectum | FAP |  |
| ∗Top 15 enriched GO BP terms are showed in the bar plot of each disease state in each tissue. Each row represents a significant GO biological process which is colored according to the -log10(p.adjust). |
| Page: 1 2 3 4 5 6 7 8 9 |
| GO ID | Tissue | Disease Stage | Description | Gene Ratio | Bg Ratio | pvalue | p.adjust | Count |
| GO:001810511 | Liver | HCC | peptidyl-serine phosphorylation | 169/7958 | 315/18723 | 3.86e-05 | 3.81e-04 | 169 |
| GO:001820911 | Liver | HCC | peptidyl-serine modification | 177/7958 | 338/18723 | 1.45e-04 | 1.17e-03 | 177 |
| GO:00467775 | Liver | HCC | protein autophosphorylation | 123/7958 | 227/18723 | 2.40e-04 | 1.80e-03 | 123 |
| GO:001810711 | Liver | HCC | peptidyl-threonine phosphorylation | 68/7958 | 116/18723 | 3.31e-04 | 2.33e-03 | 68 |
| GO:001821011 | Liver | HCC | peptidyl-threonine modification | 71/7958 | 125/18723 | 8.68e-04 | 5.14e-03 | 71 |
| GO:00182098 | Oral cavity | OSCC | peptidyl-serine modification | 175/7305 | 338/18723 | 1.09e-06 | 1.46e-05 | 175 |
| GO:001810510 | Oral cavity | OSCC | peptidyl-serine phosphorylation | 164/7305 | 315/18723 | 1.51e-06 | 1.99e-05 | 164 |
| GO:00467779 | Oral cavity | OSCC | protein autophosphorylation | 123/7305 | 227/18723 | 2.31e-06 | 2.93e-05 | 123 |
| GO:00182123 | Oral cavity | OSCC | peptidyl-tyrosine modification | 180/7305 | 378/18723 | 3.63e-04 | 2.22e-03 | 180 |
| GO:00181083 | Oral cavity | OSCC | peptidyl-tyrosine phosphorylation | 177/7305 | 375/18723 | 6.86e-04 | 3.83e-03 | 177 |
| GO:00181079 | Oral cavity | OSCC | peptidyl-threonine phosphorylation | 60/7305 | 116/18723 | 3.59e-03 | 1.50e-02 | 60 |
| GO:00182109 | Oral cavity | OSCC | peptidyl-threonine modification | 64/7305 | 125/18723 | 3.68e-03 | 1.52e-02 | 64 |
| GO:00426927 | Oral cavity | OSCC | muscle cell differentiation | 175/7305 | 384/18723 | 4.79e-03 | 1.92e-02 | 175 |
| GO:004677716 | Thyroid | PTC | protein autophosphorylation | 110/5968 | 227/18723 | 1.25e-07 | 2.44e-06 | 110 |
| GO:001810518 | Thyroid | PTC | peptidyl-serine phosphorylation | 143/5968 | 315/18723 | 2.94e-07 | 5.04e-06 | 143 |
| GO:001820916 | Thyroid | PTC | peptidyl-serine modification | 151/5968 | 338/18723 | 4.61e-07 | 7.51e-06 | 151 |
| GO:001821017 | Thyroid | PTC | peptidyl-threonine modification | 66/5968 | 125/18723 | 9.50e-07 | 1.43e-05 | 66 |
| GO:001810717 | Thyroid | PTC | peptidyl-threonine phosphorylation | 62/5968 | 116/18723 | 1.16e-06 | 1.69e-05 | 62 |
| GO:00182126 | Thyroid | PTC | peptidyl-tyrosine modification | 142/5968 | 378/18723 | 1.02e-02 | 4.14e-02 | 142 |
| GO:001810519 | Thyroid | ATC | peptidyl-serine phosphorylation | 153/6293 | 315/18723 | 2.28e-08 | 4.42e-07 | 153 |
| Page: 1 2 |
| Pathway ID | Tissue | Disease Stage | Description | Gene Ratio | Bg Ratio | pvalue | p.adjust | qvalue | Count |
| Page: 1 |
Top |
Cell-cell communication analysis |
| Identification of potential cell-cell interactions between two cell types and their ligand-receptor pairs for different disease states |
| Ligand | Receptor | LRpair | Pathway | Tissue | Disease Stage |
| Page: 1 |
Top |
Single-cell gene regulatory network inference analysis |
| Find out the significant the regulons (TFs) and the target genes of each regulon across cell types for different disease states |
| TF | Cell Type | Tissue | Disease Stage | Target Gene | RSS | Regulon Activity |
| ∗The dot plots of a searched regulon are shown for all cell subpopulations in each disease state of each tissue based on the regulon specific score inferred using pySCENIC and by calculating the average expression. |
| Page: 1 |
Top |
Somatic mutation of malignant transformation related genes |
| Annotation of somatic variants for genes involved in malignant transformation |
| Hugo Symbol | Variant Class | Variant Classification | dbSNP RS | HGVSc | HGVSp | HGVSp Short | SWISSPROT | BIOTYPE | SIFT | PolyPhen | Tumor Sample Barcode | Tissue | Histology | Sex | Age | Stage | Therapy Types | Drugs | Outcome |
| DYRK1B | SNV | Missense_Mutation | c.615N>G | p.His205Gln | p.H205Q | Q9Y463 | protein_coding | tolerated(0.25) | benign(0.05) | TCGA-AO-A0J2-01 | Breast | breast invasive carcinoma | Female | <65 | I/II | Chemotherapy | cyclophosphamide | SD | |
| DYRK1B | SNV | Missense_Mutation | c.1579N>G | p.Gln527Glu | p.Q527E | Q9Y463 | protein_coding | tolerated_low_confidence(0.28) | benign(0.006) | TCGA-BH-A0W5-01 | Breast | breast invasive carcinoma | Female | >=65 | I/II | Hormone Therapy | arimidex | CR | |
| DYRK1B | SNV | Missense_Mutation | novel | c.344N>T | p.Ser115Leu | p.S115L | Q9Y463 | protein_coding | deleterious(0.02) | possibly_damaging(0.523) | TCGA-C8-A8HQ-01 | Breast | breast invasive carcinoma | Female | <65 | I/II | Unknown | Unknown | SD |
| DYRK1B | deletion | Frame_Shift_Del | novel | c.339delN | p.Ile113MetfsTer14 | p.I113Mfs*14 | Q9Y463 | protein_coding | TCGA-D8-A27V-01 | Breast | breast invasive carcinoma | Female | <65 | I/II | Hormone Therapy | tamoxiphen | SD | ||
| DYRK1B | SNV | Missense_Mutation | rs753581092 | c.1079C>T | p.Thr360Met | p.T360M | Q9Y463 | protein_coding | tolerated(0.22) | possibly_damaging(0.722) | TCGA-AA-3506-01 | Colorectum | colon adenocarcinoma | Male | >=65 | I/II | Unknown | Unknown | SD |
| DYRK1B | SNV | Missense_Mutation | c.334N>A | p.Glu112Lys | p.E112K | Q9Y463 | protein_coding | tolerated(0.11) | benign(0.157) | TCGA-AA-3510-01 | Colorectum | colon adenocarcinoma | Male | >=65 | I/II | Unknown | Unknown | SD | |
| DYRK1B | SNV | Missense_Mutation | rs773857931 | c.1811C>T | p.Pro604Leu | p.P604L | Q9Y463 | protein_coding | deleterious_low_confidence(0.03) | benign(0.001) | TCGA-AA-3663-01 | Colorectum | colon adenocarcinoma | Male | <65 | I/II | Unknown | Unknown | SD |
| DYRK1B | SNV | Missense_Mutation | c.727G>A | p.Glu243Lys | p.E243K | Q9Y463 | protein_coding | deleterious(0) | probably_damaging(1) | TCGA-AA-3977-01 | Colorectum | colon adenocarcinoma | Male | >=65 | I/II | Unknown | Unknown | SD | |
| DYRK1B | SNV | Missense_Mutation | novel | c.830G>A | p.Arg277His | p.R277H | Q9Y463 | protein_coding | deleterious(0) | probably_damaging(1) | TCGA-CA-6717-01 | Colorectum | colon adenocarcinoma | Male | <65 | I/II | Chemotherapy | oxaliplatin | CR |
| DYRK1B | SNV | Missense_Mutation | rs753581092 | c.1079N>T | p.Thr360Met | p.T360M | Q9Y463 | protein_coding | tolerated(0.22) | possibly_damaging(0.722) | TCGA-G4-6320-01 | Colorectum | colon adenocarcinoma | Male | >=65 | III/IV | Chemotherapy | oxaliplatin | SD |
| Page: 1 2 3 4 5 6 7 8 |
Top |
Related drugs of malignant transformation related genes |
| Identification of chemicals and drugs interact with genes involved in malignant transfromation |
| (DGIdb 4.0) |
| Entrez ID | Symbol | Category | Interaction Types | Drug Claim Name | Drug Name | PMIDs |
| 9149 | DYRK1B | KINASE, DRUGGABLE GENOME, SERINE THREONINE KINASE, TYROSINE KINASE, ENZYME | RG-1530 | RG-1530 | ||
| 9149 | DYRK1B | KINASE, DRUGGABLE GENOME, SERINE THREONINE KINASE, TYROSINE KINASE, ENZYME | PMID28766366-Compound-Scheme9EHT1610 | |||
| 9149 | DYRK1B | KINASE, DRUGGABLE GENOME, SERINE THREONINE KINASE, TYROSINE KINASE, ENZYME | inhibitor | 315661343 | ||
| 9149 | DYRK1B | KINASE, DRUGGABLE GENOME, SERINE THREONINE KINASE, TYROSINE KINASE, ENZYME | CENISERTIB | CENISERTIB | ||
| 9149 | DYRK1B | KINASE, DRUGGABLE GENOME, SERINE THREONINE KINASE, TYROSINE KINASE, ENZYME | PMID28766366-Compound-Scheme25-4 | |||
| 9149 | DYRK1B | KINASE, DRUGGABLE GENOME, SERINE THREONINE KINASE, TYROSINE KINASE, ENZYME | PMID28766366-Compound-Scheme21Left | |||
| 9149 | DYRK1B | KINASE, DRUGGABLE GENOME, SERINE THREONINE KINASE, TYROSINE KINASE, ENZYME | BMS-387032 | BMS-387032 | ||
| 9149 | DYRK1B | KINASE, DRUGGABLE GENOME, SERINE THREONINE KINASE, TYROSINE KINASE, ENZYME | inhibitor | 249565807 | ||
| 9149 | DYRK1B | KINASE, DRUGGABLE GENOME, SERINE THREONINE KINASE, TYROSINE KINASE, ENZYME | PMID28766366-Compound-Scheme4Upper | |||
| 9149 | DYRK1B | KINASE, DRUGGABLE GENOME, SERINE THREONINE KINASE, TYROSINE KINASE, ENZYME | AZD-1080 | AZD-1080 |
| Page: 1 2 3 4 |

Copyright 2023-Present -The University of Texas Health Science Center at Houston |