
|
|||||
|
 | |
| |
| |
| |
| |
| |
|
Gene: DYNLT3 |
Gene summary for DYNLT3 |
| Gene information | Species | Human | Gene symbol | DYNLT3 | Gene ID | 6990 |
| Gene name | dynein light chain Tctex-type 3 | |
| Gene Alias | RP3 | |
| Cytomap | Xp11.4 | |
| Gene Type | protein-coding | GO ID | GO:0000278 | UniProtAcc | P51808 |
Top |
Malignant transformation analysis |
| Identification of the aberrant gene expression in precancerous and cancerous lesions by comparing the gene expression of stem-like cells in diseased tissues with normal stem cells |
| Entrez ID | Symbol | Replicates | Species | Organ | Tissue | Adj P-value | Log2FC | Malignancy |
| 6990 | DYNLT3 | LZE4T | Human | Esophagus | ESCC | 1.03e-43 | 1.30e+00 | 0.0811 |
| 6990 | DYNLT3 | LZE7T | Human | Esophagus | ESCC | 3.62e-10 | 9.61e-01 | 0.0667 |
| 6990 | DYNLT3 | LZE8T | Human | Esophagus | ESCC | 2.66e-15 | 5.16e-01 | 0.067 |
| 6990 | DYNLT3 | LZE22T | Human | Esophagus | ESCC | 6.32e-03 | 1.41e-01 | 0.068 |
| 6990 | DYNLT3 | LZE24T | Human | Esophagus | ESCC | 2.35e-27 | 8.77e-01 | 0.0596 |
| 6990 | DYNLT3 | LZE21T | Human | Esophagus | ESCC | 8.27e-12 | 1.50e+00 | 0.0655 |
| 6990 | DYNLT3 | LZE6T | Human | Esophagus | ESCC | 1.10e-05 | 2.29e-01 | 0.0845 |
| 6990 | DYNLT3 | P2T-E | Human | Esophagus | ESCC | 3.29e-07 | 2.56e-01 | 0.1177 |
| 6990 | DYNLT3 | P4T-E | Human | Esophagus | ESCC | 1.47e-32 | 8.43e-01 | 0.1323 |
| 6990 | DYNLT3 | P5T-E | Human | Esophagus | ESCC | 1.59e-45 | 9.47e-01 | 0.1327 |
| 6990 | DYNLT3 | P8T-E | Human | Esophagus | ESCC | 5.02e-29 | 7.34e-01 | 0.0889 |
| 6990 | DYNLT3 | P9T-E | Human | Esophagus | ESCC | 2.38e-08 | 3.02e-01 | 0.1131 |
| 6990 | DYNLT3 | P10T-E | Human | Esophagus | ESCC | 1.36e-20 | 5.40e-01 | 0.116 |
| 6990 | DYNLT3 | P11T-E | Human | Esophagus | ESCC | 3.02e-16 | 6.16e-01 | 0.1426 |
| 6990 | DYNLT3 | P12T-E | Human | Esophagus | ESCC | 4.40e-40 | 7.74e-01 | 0.1122 |
| 6990 | DYNLT3 | P15T-E | Human | Esophagus | ESCC | 6.10e-29 | 7.51e-01 | 0.1149 |
| 6990 | DYNLT3 | P16T-E | Human | Esophagus | ESCC | 1.31e-15 | 3.08e-01 | 0.1153 |
| 6990 | DYNLT3 | P17T-E | Human | Esophagus | ESCC | 4.04e-10 | 4.74e-01 | 0.1278 |
| 6990 | DYNLT3 | P19T-E | Human | Esophagus | ESCC | 7.28e-18 | 1.29e+00 | 0.1662 |
| 6990 | DYNLT3 | P20T-E | Human | Esophagus | ESCC | 1.44e-08 | 2.25e-01 | 0.1124 |
| Page: 1 2 3 4 5 6 |
| Tissue | Expression Dynamics | Abbreviation |
| Esophagus | 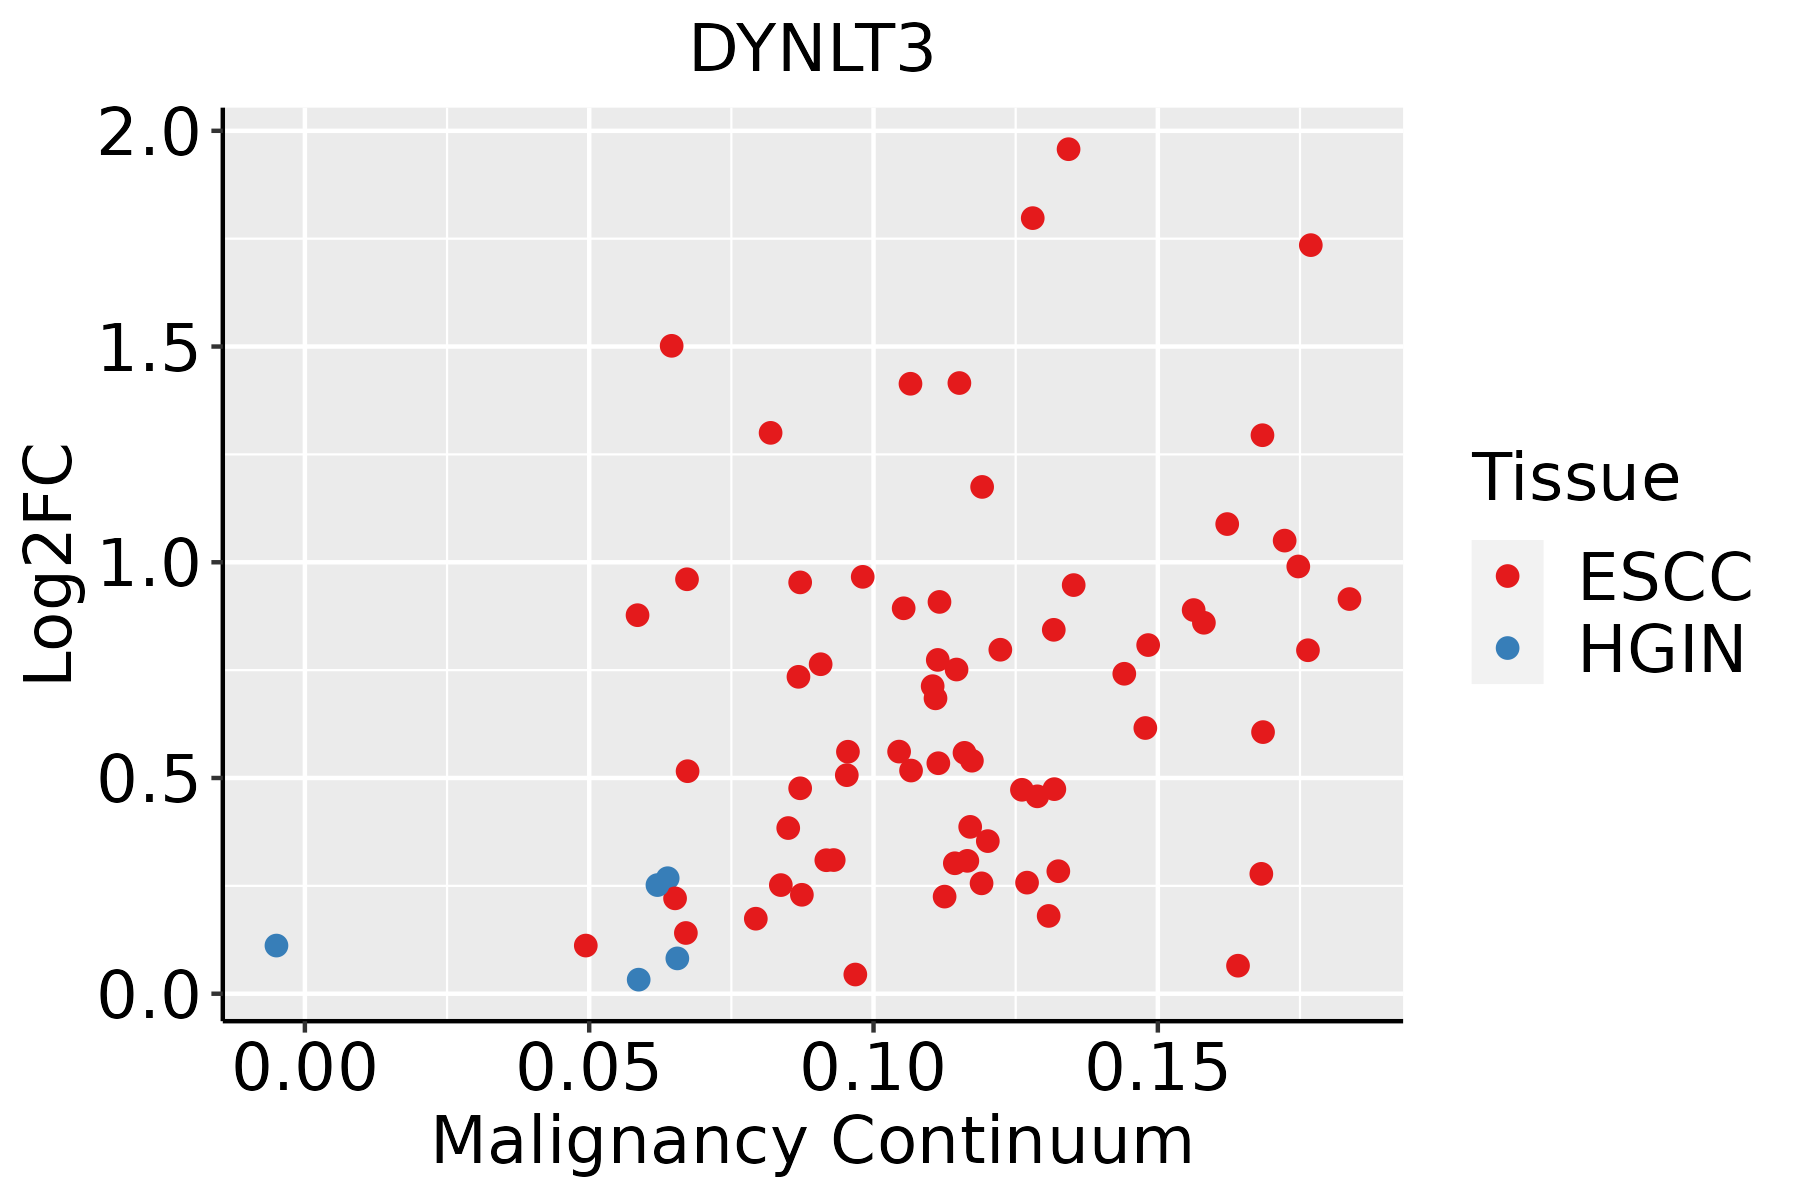 | ESCC: Esophageal squamous cell carcinoma |
| HGIN: High-grade intraepithelial neoplasias | ||
| LGIN: Low-grade intraepithelial neoplasias | ||
| Liver | 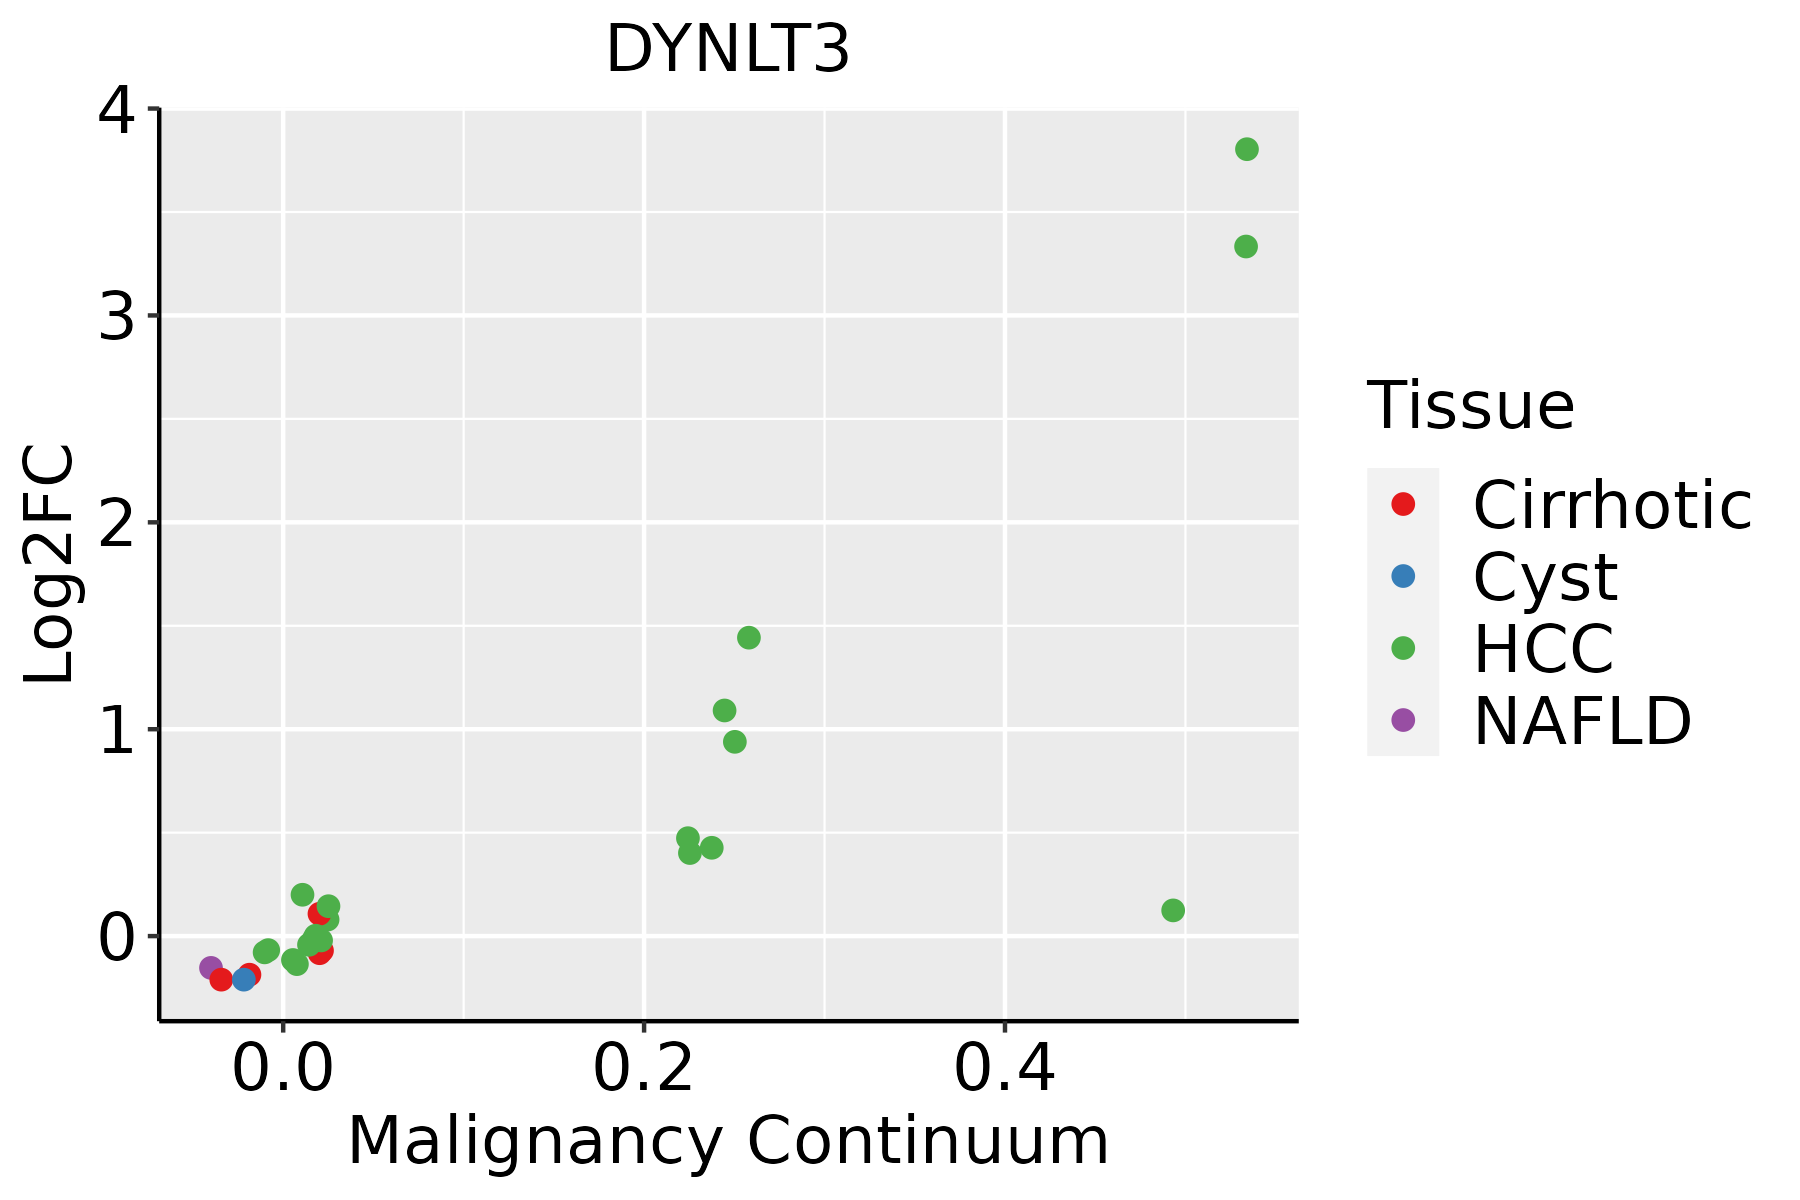 | HCC: Hepatocellular carcinoma |
| NAFLD: Non-alcoholic fatty liver disease | ||
| Oral Cavity |  | EOLP: Erosive Oral lichen planus |
| LP: leukoplakia | ||
| NEOLP: Non-erosive oral lichen planus | ||
| OSCC: Oral squamous cell carcinoma | ||
| Skin | 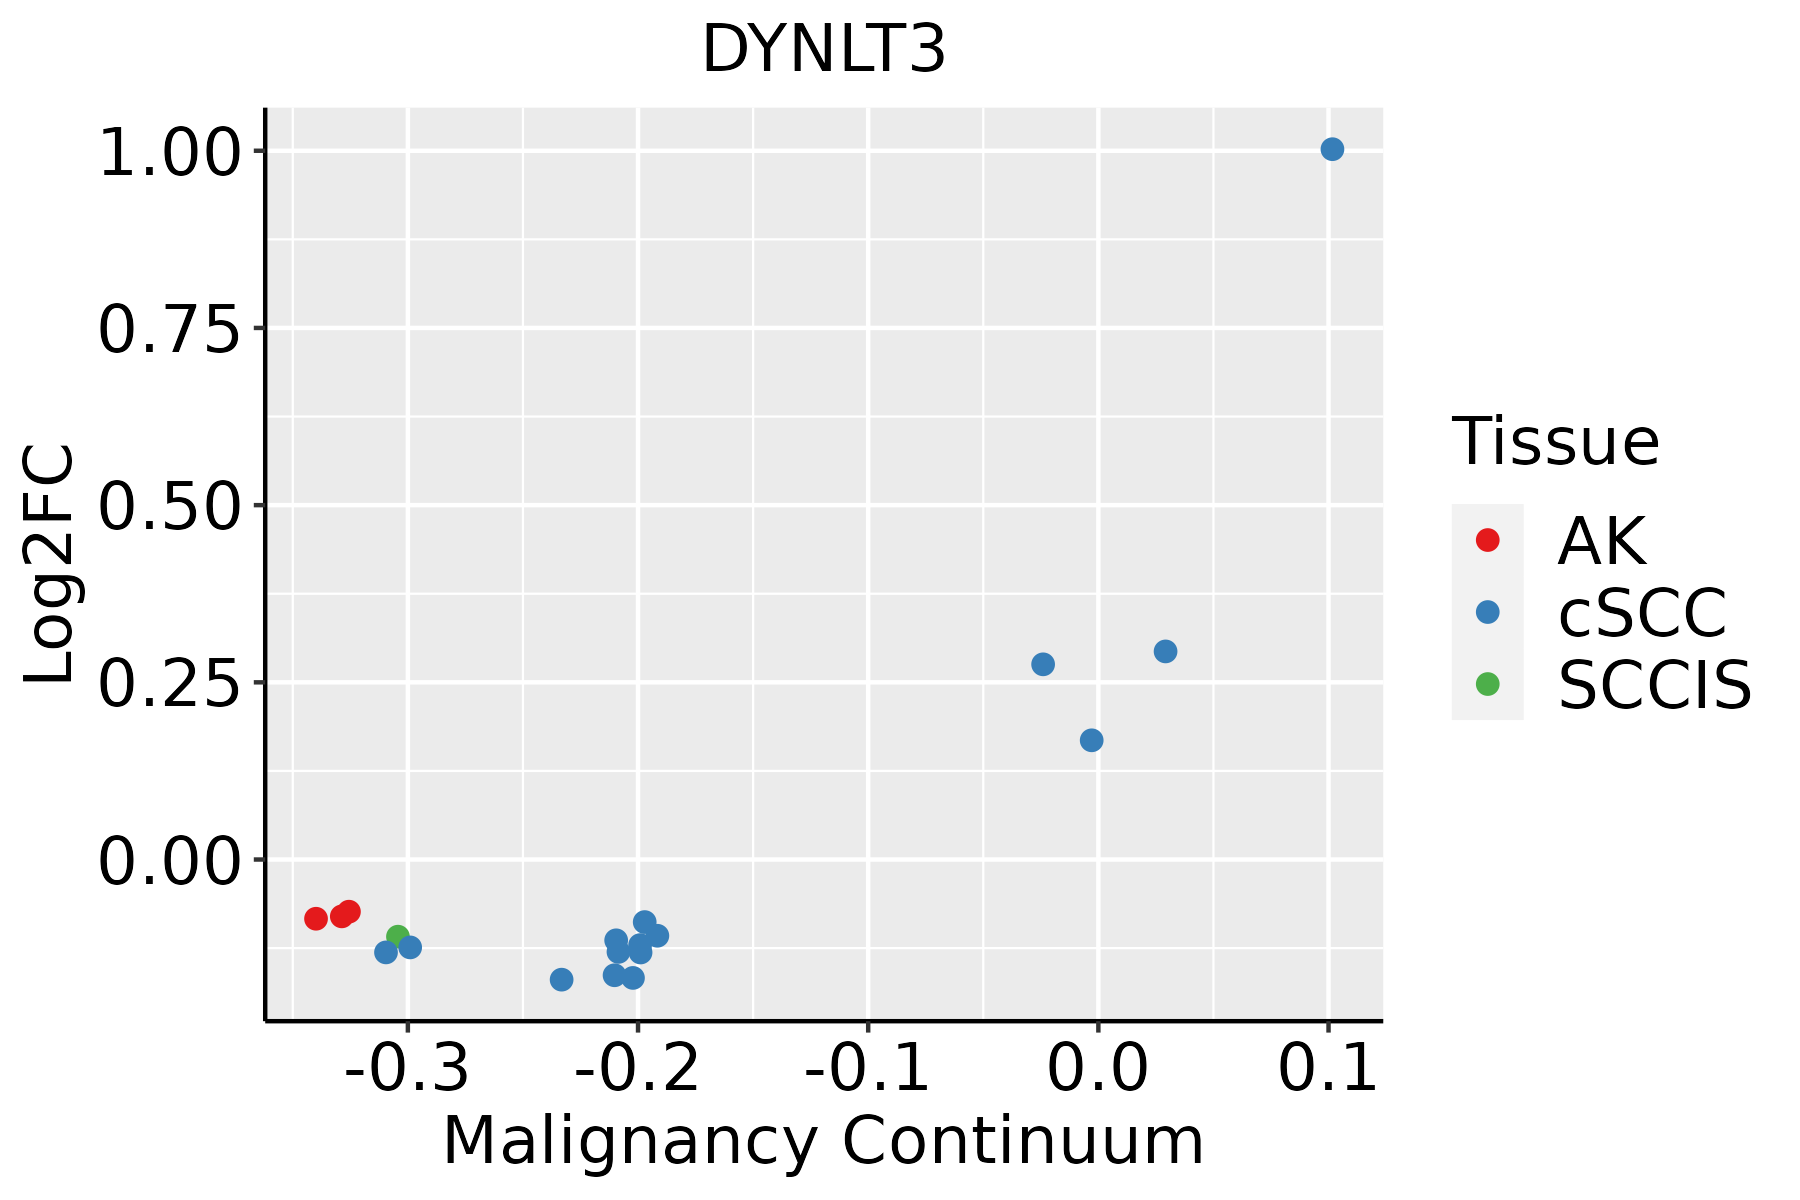 | AK: Actinic keratosis |
| cSCC: Cutaneous squamous cell carcinoma | ||
| SCCIS:squamous cell carcinoma in situ | ||
| Thyroid |  | ATC: Anaplastic thyroid cancer |
| HT: Hashimoto's thyroiditis | ||
| PTC: Papillary thyroid cancer |
| ∗log2FC in expression of this searched gene in stem-like cells from each diseased tissue sample relative to stem-like cells in normal samples in each tissue plotted against the malignancy continuum. Samples are colored based on if they are from different disease stage. |
Top |
Malignant transformation related pathway analysis |
| Find out the enriched GO biological processes and KEGG pathways involved in transition from healthy to precancer to cancer |
| Tissue | Disease Stage | Enriched GO biological Processes |
| Colorectum | AD |  |
| Colorectum | SER |  |
| Colorectum | MSS |  |
| Colorectum | MSI-H |  |
| Colorectum | FAP |  |
| ∗Top 15 enriched GO BP terms are showed in the bar plot of each disease state in each tissue. Each row represents a significant GO biological process which is colored according to the -log10(p.adjust). |
| Page: 1 2 3 4 5 6 7 8 9 |
| GO ID | Tissue | Disease Stage | Description | Gene Ratio | Bg Ratio | pvalue | p.adjust | Count |
| GO:000734615 | Esophagus | ESCC | regulation of mitotic cell cycle | 293/8552 | 457/18723 | 8.00e-16 | 5.64e-14 | 293 |
| GO:004578710 | Esophagus | ESCC | positive regulation of cell cycle | 196/8552 | 313/18723 | 9.27e-10 | 2.24e-08 | 196 |
| GO:004593116 | Esophagus | ESCC | positive regulation of mitotic cell cycle | 83/8552 | 121/18723 | 2.78e-07 | 4.08e-06 | 83 |
| GO:00073463 | Liver | Cirrhotic | regulation of mitotic cell cycle | 154/4634 | 457/18723 | 8.73e-06 | 1.29e-04 | 154 |
| GO:00459313 | Liver | Cirrhotic | positive regulation of mitotic cell cycle | 49/4634 | 121/18723 | 9.47e-05 | 1.01e-03 | 49 |
| GO:00457874 | Liver | Cirrhotic | positive regulation of cell cycle | 97/4634 | 313/18723 | 6.88e-03 | 3.38e-02 | 97 |
| GO:000734611 | Liver | HCC | regulation of mitotic cell cycle | 255/7958 | 457/18723 | 4.96e-09 | 1.30e-07 | 255 |
| GO:004578711 | Liver | HCC | positive regulation of cell cycle | 172/7958 | 313/18723 | 5.29e-06 | 6.58e-05 | 172 |
| GO:004593111 | Liver | HCC | positive regulation of mitotic cell cycle | 69/7958 | 121/18723 | 8.79e-04 | 5.20e-03 | 69 |
| GO:00073469 | Oral cavity | OSCC | regulation of mitotic cell cycle | 266/7305 | 457/18723 | 3.87e-17 | 3.41e-15 | 266 |
| GO:00457879 | Oral cavity | OSCC | positive regulation of cell cycle | 173/7305 | 313/18723 | 3.28e-09 | 7.44e-08 | 173 |
| GO:00459319 | Oral cavity | OSCC | positive regulation of mitotic cell cycle | 77/7305 | 121/18723 | 3.49e-08 | 6.64e-07 | 77 |
| GO:000734614 | Oral cavity | LP | regulation of mitotic cell cycle | 163/4623 | 457/18723 | 7.64e-08 | 2.56e-06 | 163 |
| GO:004593115 | Oral cavity | LP | positive regulation of mitotic cell cycle | 46/4623 | 121/18723 | 7.65e-04 | 6.80e-03 | 46 |
| GO:004578715 | Oral cavity | LP | positive regulation of cell cycle | 96/4623 | 313/18723 | 9.08e-03 | 4.85e-02 | 96 |
| GO:000734617 | Skin | cSCC | regulation of mitotic cell cycle | 192/4864 | 457/18723 | 3.47e-14 | 2.31e-12 | 192 |
| GO:004578717 | Skin | cSCC | positive regulation of cell cycle | 120/4864 | 313/18723 | 8.95e-07 | 1.64e-05 | 120 |
| GO:004593118 | Skin | cSCC | positive regulation of mitotic cell cycle | 56/4864 | 121/18723 | 1.11e-06 | 1.96e-05 | 56 |
| GO:000734619 | Thyroid | PTC | regulation of mitotic cell cycle | 212/5968 | 457/18723 | 4.03e-11 | 1.44e-09 | 212 |
| GO:004578718 | Thyroid | PTC | positive regulation of cell cycle | 144/5968 | 313/18723 | 9.93e-08 | 1.99e-06 | 144 |
| Page: 1 2 |
| Pathway ID | Tissue | Disease Stage | Description | Gene Ratio | Bg Ratio | pvalue | p.adjust | qvalue | Count |
| hsa05132211 | Esophagus | ESCC | Salmonella infection | 191/4205 | 249/8465 | 6.51e-19 | 5.45e-17 | 2.79e-17 | 191 |
| hsa05132310 | Esophagus | ESCC | Salmonella infection | 191/4205 | 249/8465 | 6.51e-19 | 5.45e-17 | 2.79e-17 | 191 |
| hsa0513222 | Liver | Cirrhotic | Salmonella infection | 121/2530 | 249/8465 | 2.47e-10 | 5.13e-09 | 3.16e-09 | 121 |
| hsa0513232 | Liver | Cirrhotic | Salmonella infection | 121/2530 | 249/8465 | 2.47e-10 | 5.13e-09 | 3.16e-09 | 121 |
| hsa0513242 | Liver | HCC | Salmonella infection | 178/4020 | 249/8465 | 5.90e-15 | 1.98e-13 | 1.10e-13 | 178 |
| hsa0513252 | Liver | HCC | Salmonella infection | 178/4020 | 249/8465 | 5.90e-15 | 1.98e-13 | 1.10e-13 | 178 |
| hsa0513230 | Oral cavity | OSCC | Salmonella infection | 174/3704 | 249/8465 | 2.67e-17 | 1.49e-15 | 7.58e-16 | 174 |
| hsa05132114 | Oral cavity | OSCC | Salmonella infection | 174/3704 | 249/8465 | 2.67e-17 | 1.49e-15 | 7.58e-16 | 174 |
| hsa05132210 | Oral cavity | LP | Salmonella infection | 128/2418 | 249/8465 | 1.17e-14 | 2.79e-13 | 1.80e-13 | 128 |
| hsa0513238 | Oral cavity | LP | Salmonella infection | 128/2418 | 249/8465 | 1.17e-14 | 2.79e-13 | 1.80e-13 | 128 |
| Page: 1 |
Top |
Cell-cell communication analysis |
| Identification of potential cell-cell interactions between two cell types and their ligand-receptor pairs for different disease states |
| Ligand | Receptor | LRpair | Pathway | Tissue | Disease Stage |
| Page: 1 |
Top |
Single-cell gene regulatory network inference analysis |
| Find out the significant the regulons (TFs) and the target genes of each regulon across cell types for different disease states |
| TF | Cell Type | Tissue | Disease Stage | Target Gene | RSS | Regulon Activity |
| ∗The dot plots of a searched regulon are shown for all cell subpopulations in each disease state of each tissue based on the regulon specific score inferred using pySCENIC and by calculating the average expression. |
| Page: 1 |
Top |
Somatic mutation of malignant transformation related genes |
| Annotation of somatic variants for genes involved in malignant transformation |
| Hugo Symbol | Variant Class | Variant Classification | dbSNP RS | HGVSc | HGVSp | HGVSp Short | SWISSPROT | BIOTYPE | SIFT | PolyPhen | Tumor Sample Barcode | Tissue | Histology | Sex | Age | Stage | Therapy Types | Drugs | Outcome |
| DYNLT3 | SNV | Missense_Mutation | c.251N>C | p.Cys84Ser | p.C84S | P51808 | protein_coding | deleterious(0.03) | benign(0.355) | TCGA-AN-A0FJ-01 | Breast | breast invasive carcinoma | Female | <65 | III/IV | Unknown | Unknown | SD | |
| DYNLT3 | SNV | Missense_Mutation | rs200218120 | c.325N>A | p.Val109Ile | p.V109I | P51808 | protein_coding | tolerated(0.07) | possibly_damaging(0.739) | TCGA-AD-6895-01 | Colorectum | colon adenocarcinoma | Male | >=65 | III/IV | Unknown | Unknown | SD |
| DYNLT3 | SNV | Missense_Mutation | novel | c.332N>T | p.Ala111Val | p.A111V | P51808 | protein_coding | deleterious(0) | possibly_damaging(0.749) | TCGA-AJ-A3BH-01 | Endometrium | uterine corpus endometrioid carcinoma | Female | Unknown | I/II | Unknown | Unknown | SD |
| DYNLT3 | SNV | Missense_Mutation | novel | c.56N>G | p.His19Arg | p.H19R | P51808 | protein_coding | tolerated(0.14) | benign(0.139) | TCGA-AJ-A3EL-01 | Endometrium | uterine corpus endometrioid carcinoma | Female | <65 | I/II | Unknown | Unknown | SD |
| DYNLT3 | SNV | Missense_Mutation | c.244A>T | p.Ser82Cys | p.S82C | P51808 | protein_coding | deleterious(0.04) | probably_damaging(0.946) | TCGA-78-7149-01 | Lung | lung adenocarcinoma | Male | >=65 | III/IV | Unknown | Unknown | SD | |
| DYNLT3 | SNV | Missense_Mutation | c.176N>C | p.Gly59Ala | p.G59A | P51808 | protein_coding | tolerated(0.08) | benign(0.109) | TCGA-BR-6566-01 | Stomach | stomach adenocarcinoma | Female | <65 | I/II | Unknown | Unknown | SD | |
| DYNLT3 | insertion | Frame_Shift_Ins | novel | c.103_104insCAGAG | p.Tyr35SerfsTer15 | p.Y35Sfs*15 | P51808 | protein_coding | TCGA-EL-A3ZN-01 | Thyroid | thyroid carcinoma | Female | <65 | I/II | Unknown | Unknown | SD |
| Page: 1 |
Top |
Related drugs of malignant transformation related genes |
| Identification of chemicals and drugs interact with genes involved in malignant transfromation |
| (DGIdb 4.0) |
| Entrez ID | Symbol | Category | Interaction Types | Drug Claim Name | Drug Name | PMIDs |
| Page: 1 |

Copyright 2023-Present -The University of Texas Health Science Center at Houston |