
|
|||||
|
 | |
| |
| |
| |
| |
| |
|
Gene: DYNLRB1 |
Gene summary for DYNLRB1 |
| Gene information | Species | Human | Gene symbol | DYNLRB1 | Gene ID | 83658 |
| Gene name | dynein light chain roadblock-type 1 | |
| Gene Alias | BITH | |
| Cytomap | 20q11.22 | |
| Gene Type | protein-coding | GO ID | GO:0006928 | UniProtAcc | B4DFR2 |
Top |
Malignant transformation analysis |
| Identification of the aberrant gene expression in precancerous and cancerous lesions by comparing the gene expression of stem-like cells in diseased tissues with normal stem cells |
| Entrez ID | Symbol | Replicates | Species | Organ | Tissue | Adj P-value | Log2FC | Malignancy |
| 83658 | DYNLRB1 | GSM4909294 | Human | Breast | IDC | 1.13e-09 | 1.47e-01 | 0.2022 |
| 83658 | DYNLRB1 | GSM4909296 | Human | Breast | IDC | 1.16e-13 | -2.37e-01 | 0.1524 |
| 83658 | DYNLRB1 | GSM4909297 | Human | Breast | IDC | 1.09e-22 | -1.12e-04 | 0.1517 |
| 83658 | DYNLRB1 | GSM4909298 | Human | Breast | IDC | 7.93e-05 | 2.84e-01 | 0.1551 |
| 83658 | DYNLRB1 | GSM4909301 | Human | Breast | IDC | 2.12e-31 | 5.30e-01 | 0.1577 |
| 83658 | DYNLRB1 | GSM4909304 | Human | Breast | IDC | 9.55e-13 | 4.02e-01 | 0.1636 |
| 83658 | DYNLRB1 | GSM4909308 | Human | Breast | IDC | 2.80e-02 | 2.54e-01 | 0.158 |
| 83658 | DYNLRB1 | GSM4909309 | Human | Breast | IDC | 2.88e-02 | -1.64e-02 | 0.0483 |
| 83658 | DYNLRB1 | GSM4909311 | Human | Breast | IDC | 1.72e-41 | -2.60e-01 | 0.1534 |
| 83658 | DYNLRB1 | GSM4909312 | Human | Breast | IDC | 1.33e-14 | -7.02e-02 | 0.1552 |
| 83658 | DYNLRB1 | GSM4909315 | Human | Breast | IDC | 1.54e-08 | 3.57e-01 | 0.21 |
| 83658 | DYNLRB1 | GSM4909316 | Human | Breast | IDC | 5.86e-07 | 3.53e-01 | 0.21 |
| 83658 | DYNLRB1 | GSM4909319 | Human | Breast | IDC | 3.24e-50 | -2.23e-01 | 0.1563 |
| 83658 | DYNLRB1 | GSM4909320 | Human | Breast | IDC | 5.00e-13 | 2.91e-01 | 0.1575 |
| 83658 | DYNLRB1 | GSM4909321 | Human | Breast | IDC | 1.00e-21 | 7.81e-02 | 0.1559 |
| 83658 | DYNLRB1 | brca1 | Human | Breast | Precancer | 4.59e-02 | 2.93e-01 | -0.0338 |
| 83658 | DYNLRB1 | M2 | Human | Breast | IDC | 3.77e-07 | -2.15e-01 | 0.21 |
| 83658 | DYNLRB1 | NCCBC14 | Human | Breast | DCIS | 9.23e-17 | 2.48e-01 | 0.2021 |
| 83658 | DYNLRB1 | NCCBC2 | Human | Breast | DCIS | 1.90e-07 | 7.53e-02 | 0.1554 |
| 83658 | DYNLRB1 | NCCBC3 | Human | Breast | DCIS | 1.38e-02 | -4.76e-03 | 0.1198 |
| Page: 1 2 3 4 5 6 7 8 9 10 11 |
| Tissue | Expression Dynamics | Abbreviation |
| Breast |  | IDC: Invasive ductal carcinoma |
| DCIS: Ductal carcinoma in situ | ||
| Precancer(BRCA1-mut): Precancerous lesion from BRCA1 mutation carriers | ||
| Cervix | 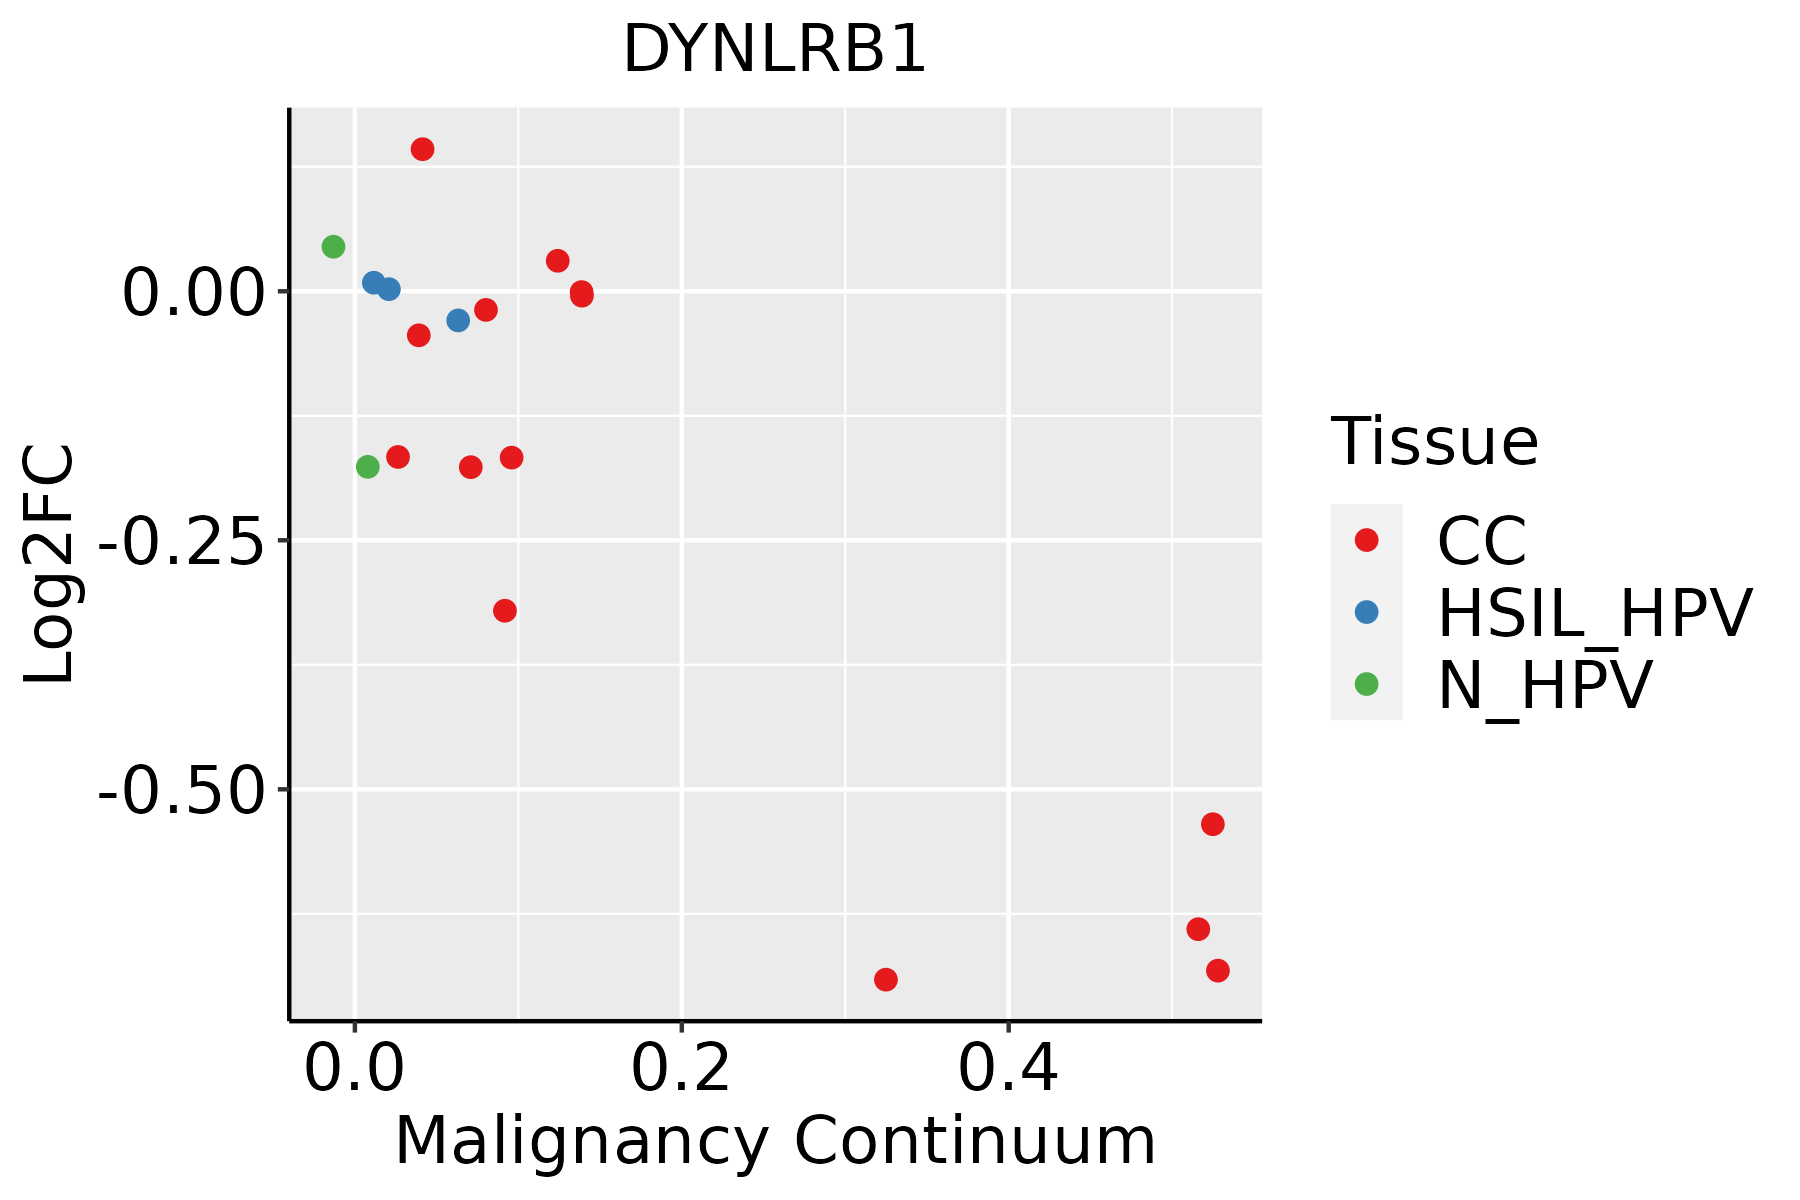 | CC: Cervix cancer |
| HSIL_HPV: HPV-infected high-grade squamous intraepithelial lesions | ||
| N_HPV: HPV-infected normal cervix | ||
| Colorectum (GSE201348) |  | FAP: Familial adenomatous polyposis |
| CRC: Colorectal cancer | ||
| Colorectum (HTA11) |  | AD: Adenomas |
| SER: Sessile serrated lesions | ||
| MSI-H: Microsatellite-high colorectal cancer | ||
| MSS: Microsatellite stable colorectal cancer | ||
| Endometrium | 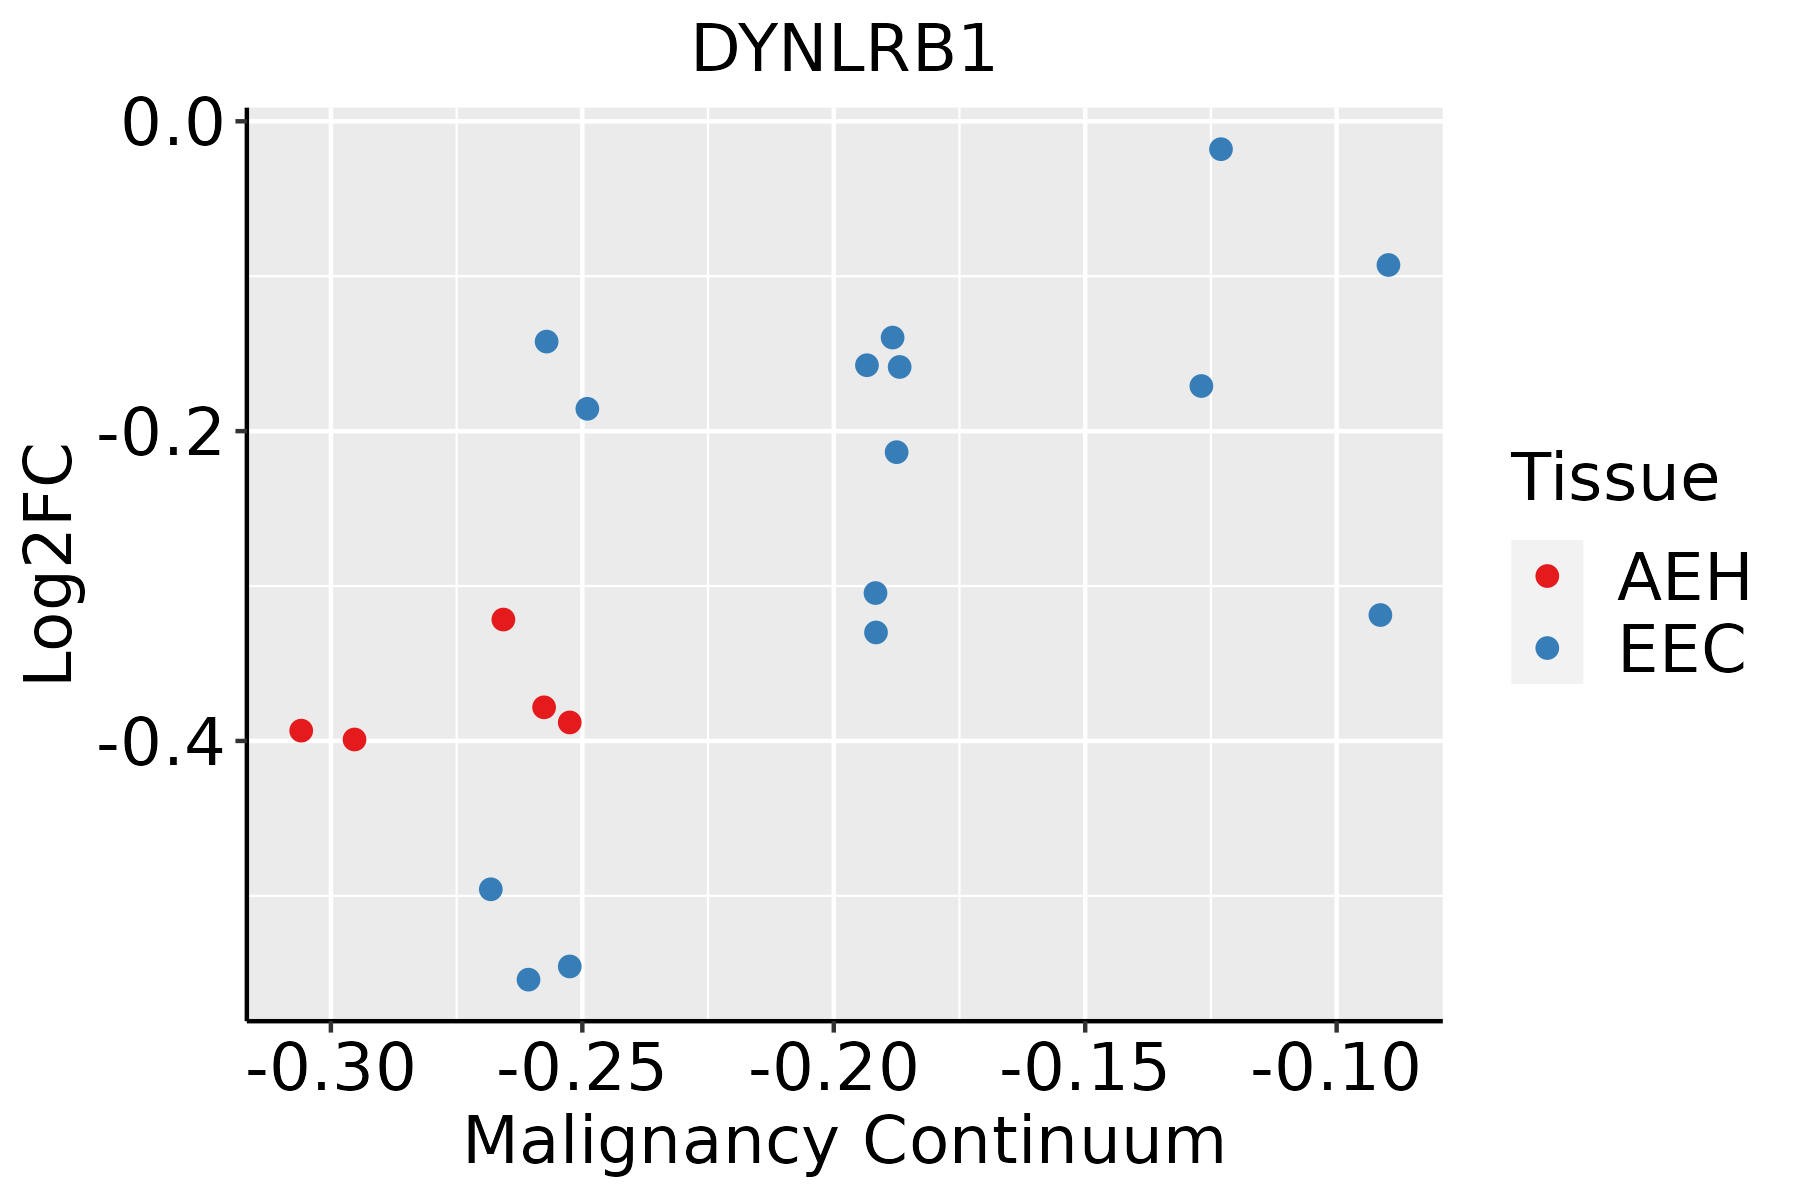 | AEH: Atypical endometrial hyperplasia |
| EEC: Endometrioid Cancer | ||
| Esophagus | 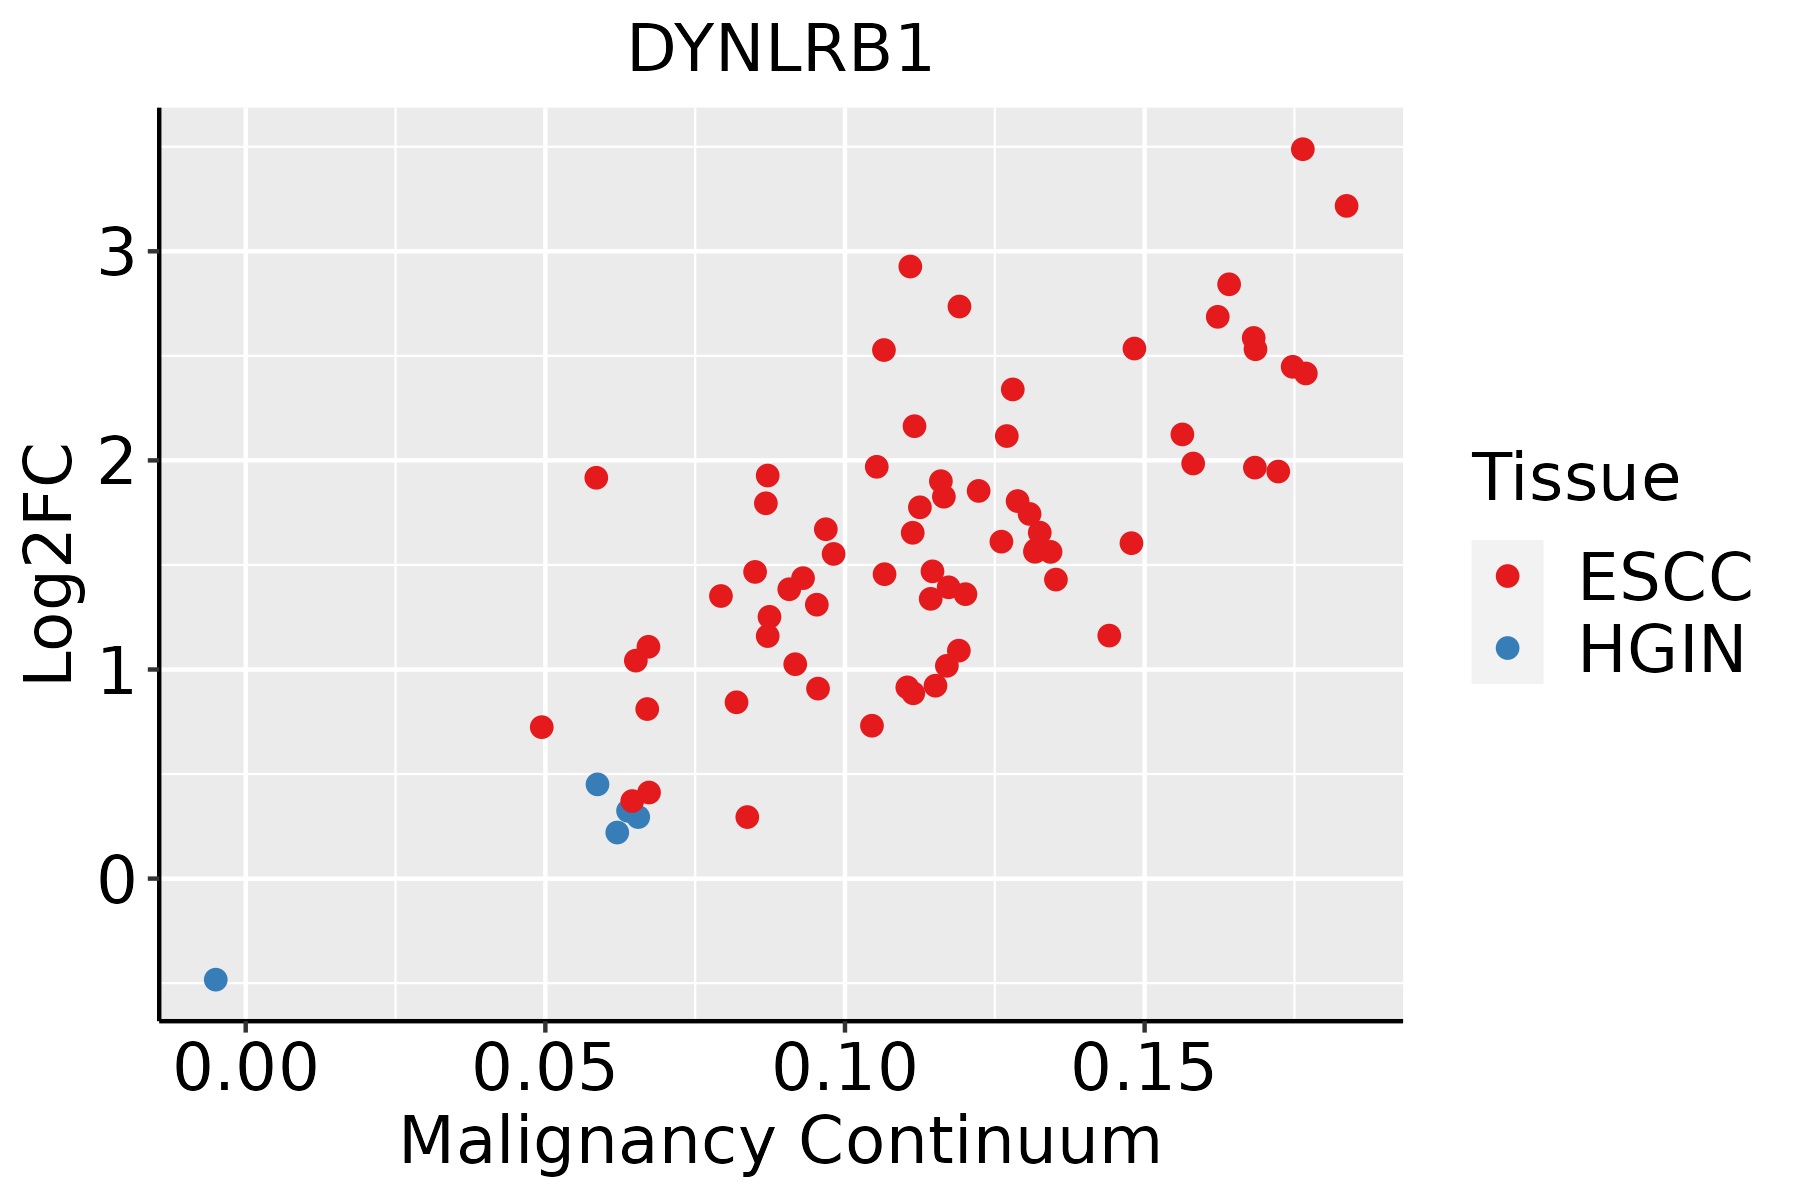 | ESCC: Esophageal squamous cell carcinoma |
| HGIN: High-grade intraepithelial neoplasias | ||
| LGIN: Low-grade intraepithelial neoplasias | ||
| Liver | 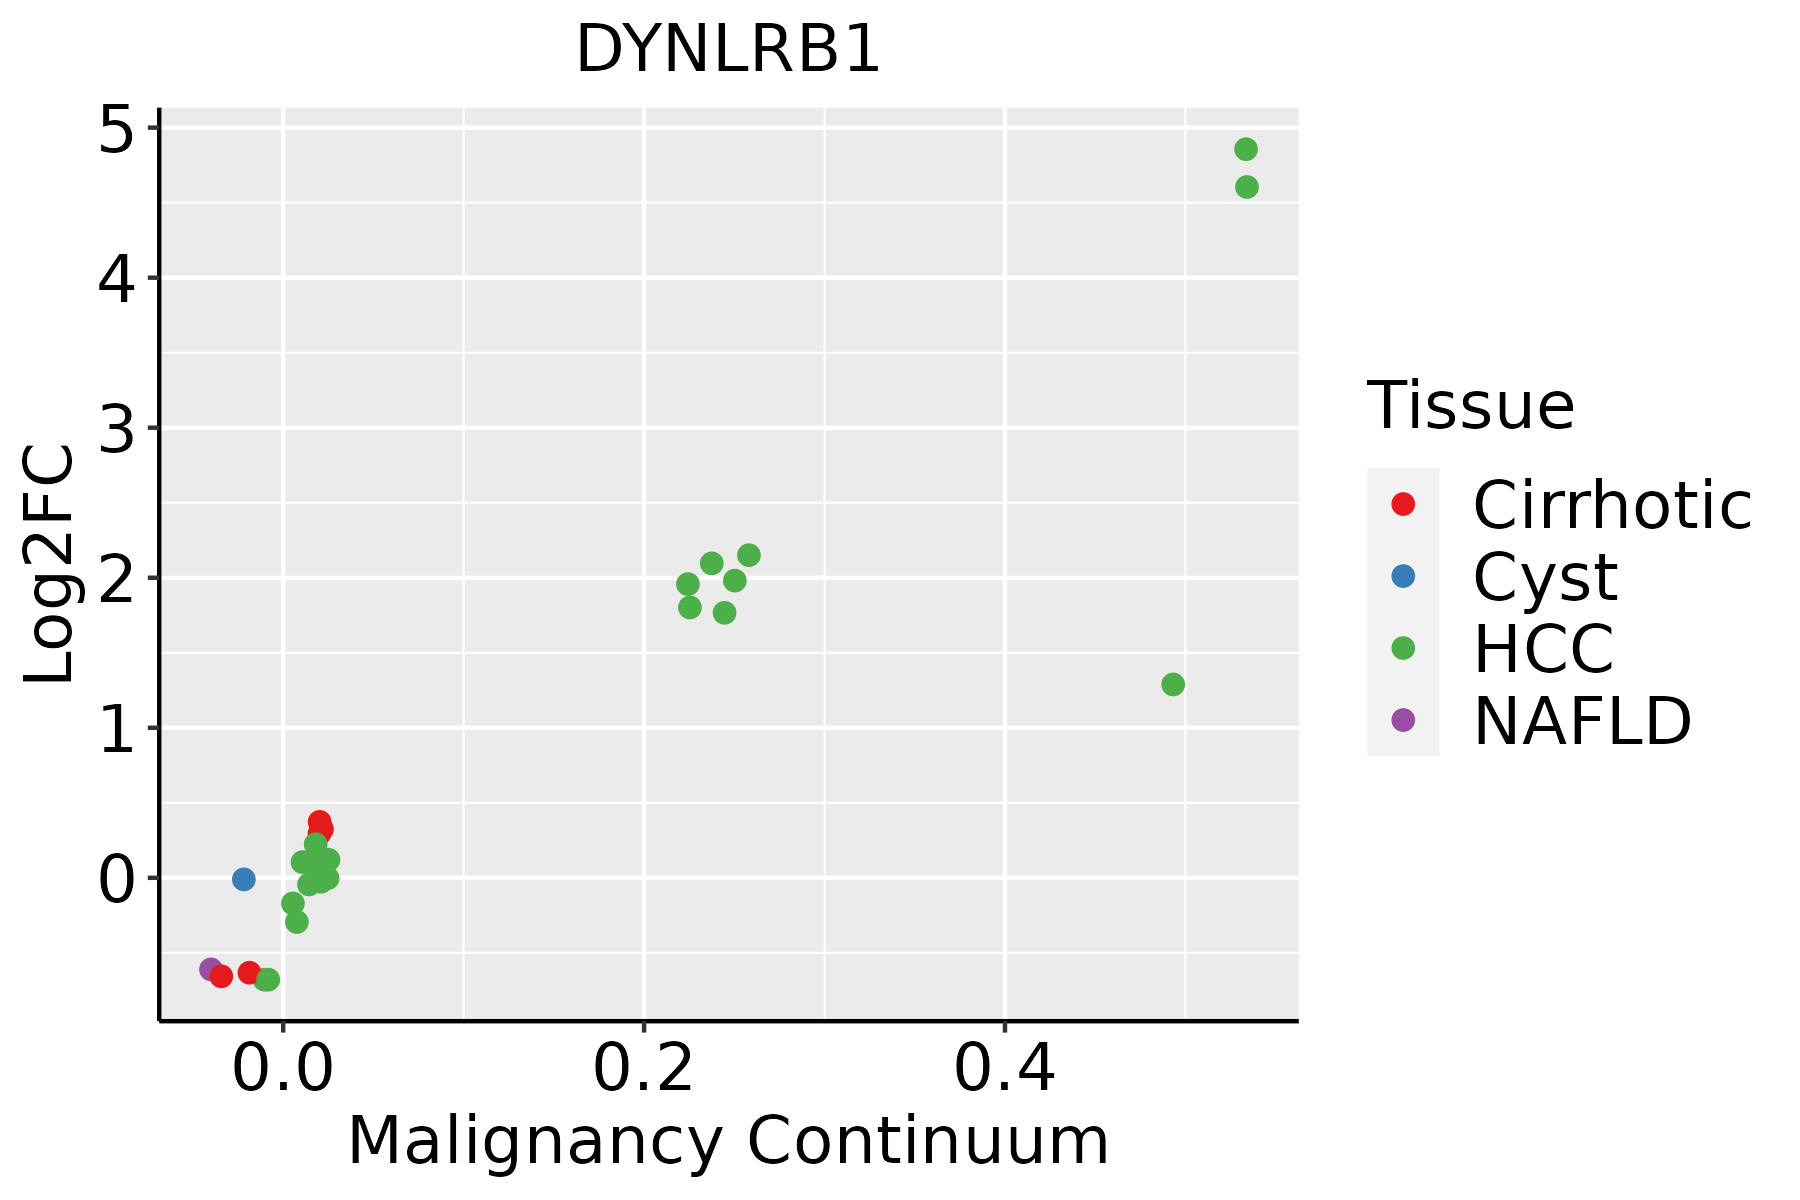 | HCC: Hepatocellular carcinoma |
| NAFLD: Non-alcoholic fatty liver disease | ||
| Oral Cavity | 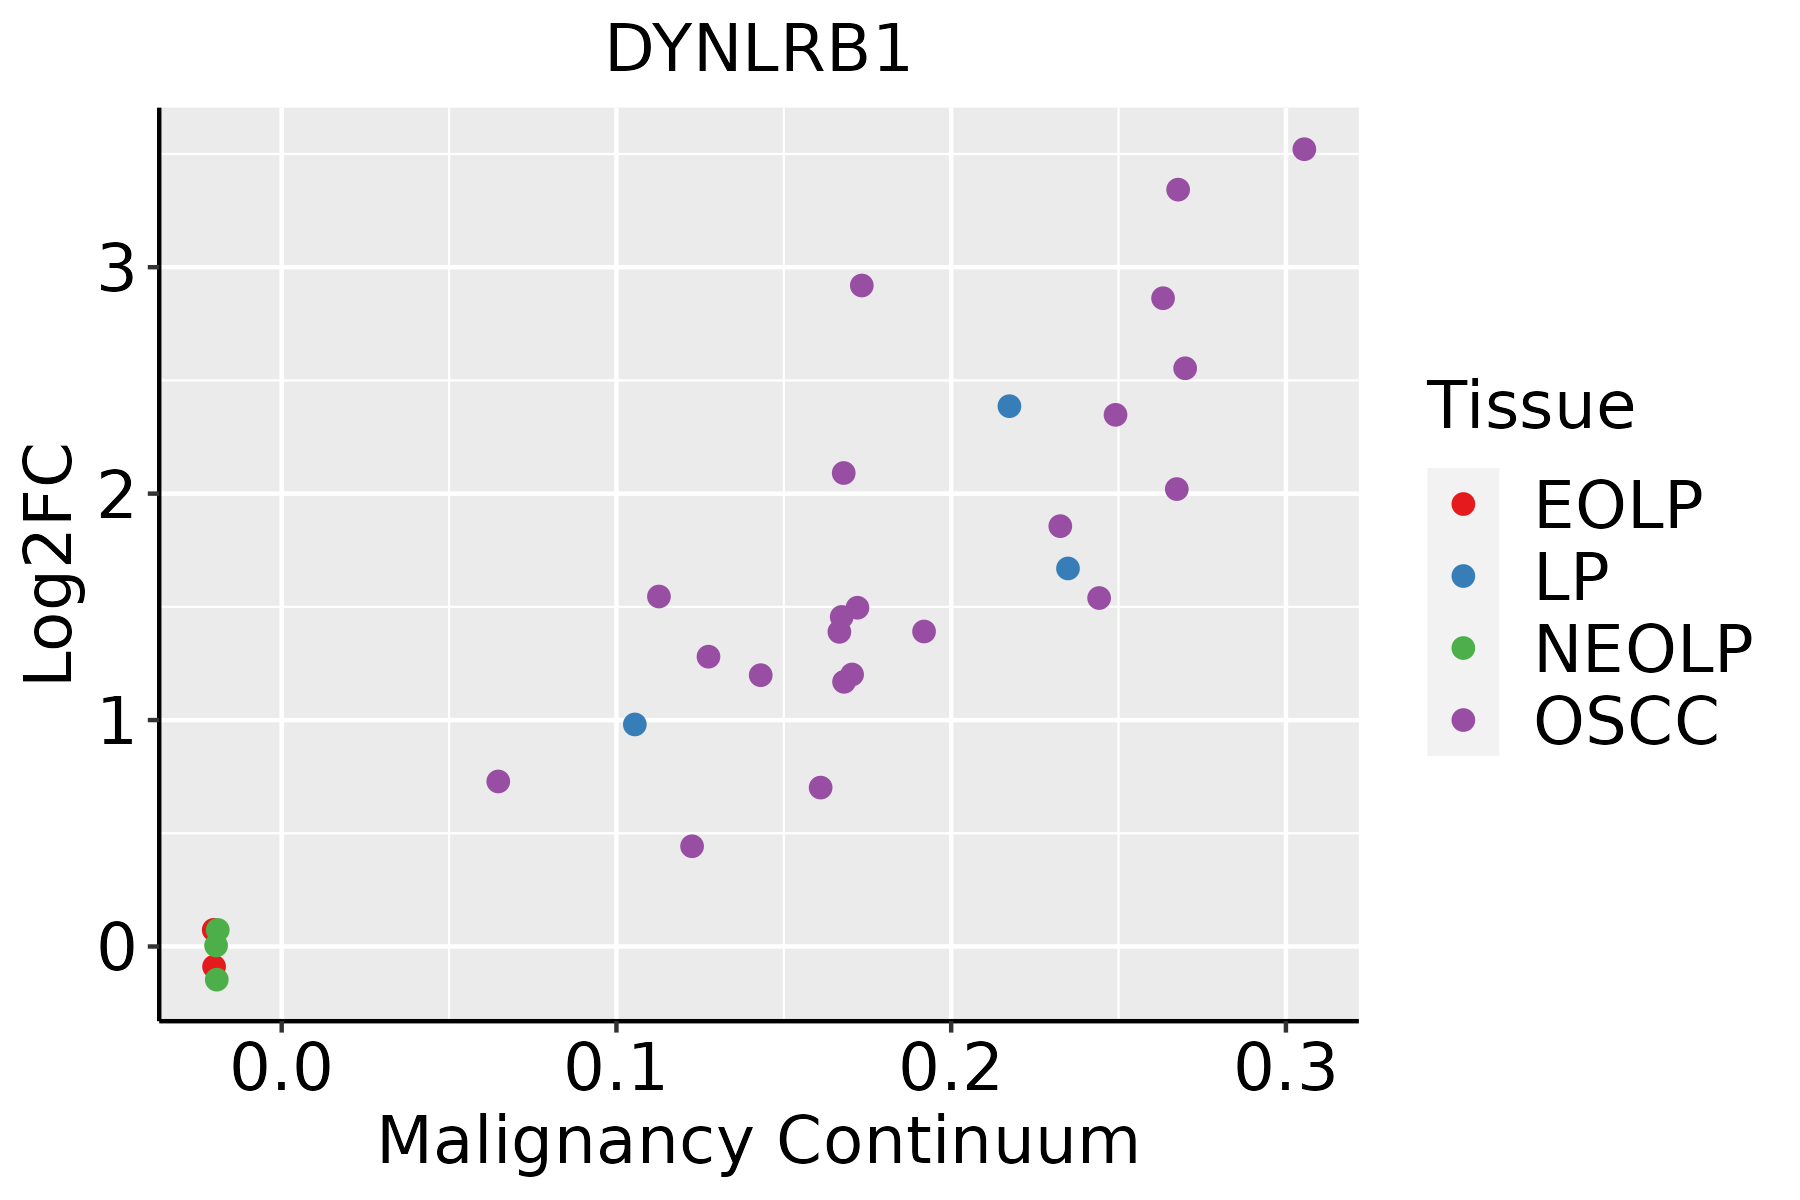 | EOLP: Erosive Oral lichen planus |
| LP: leukoplakia | ||
| NEOLP: Non-erosive oral lichen planus | ||
| OSCC: Oral squamous cell carcinoma | ||
| Prostate | 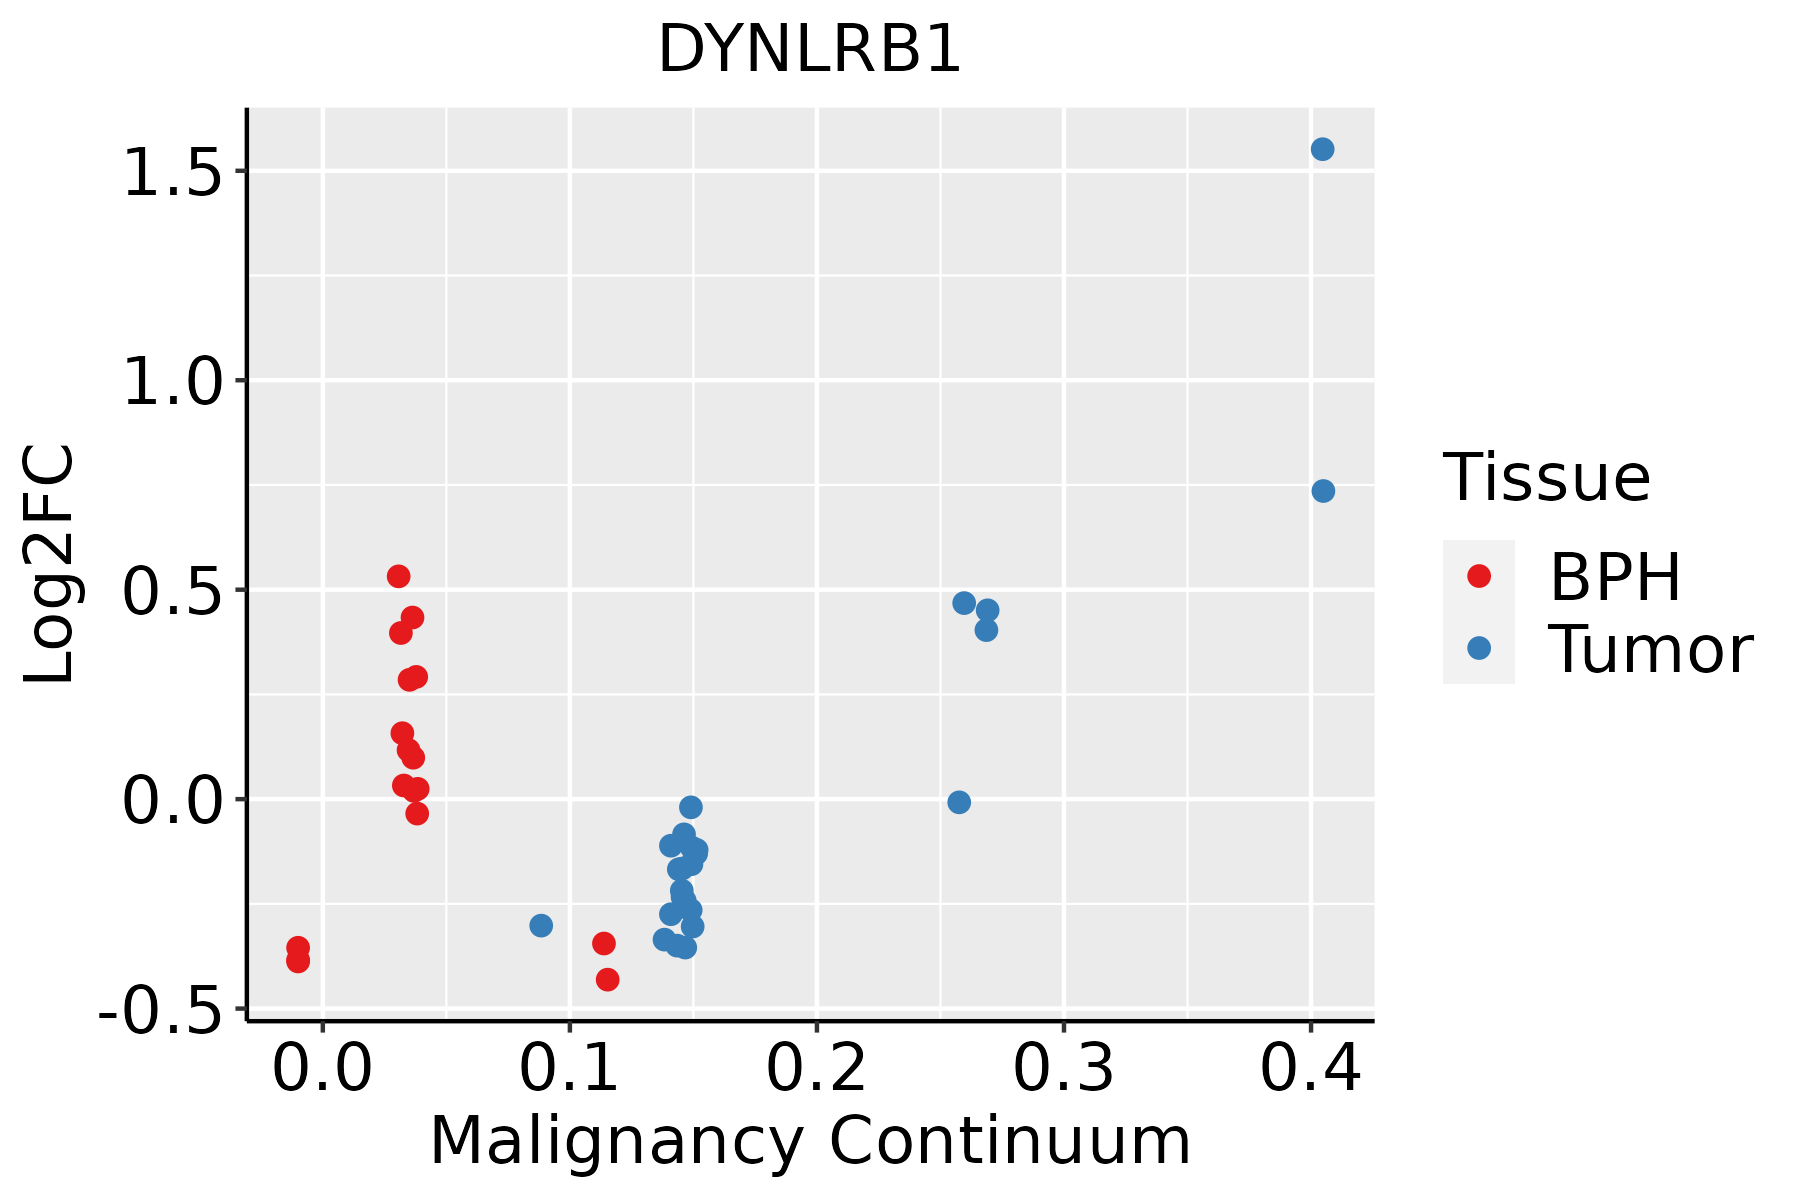 | BPH: Benign Prostatic Hyperplasia |
| Skin | 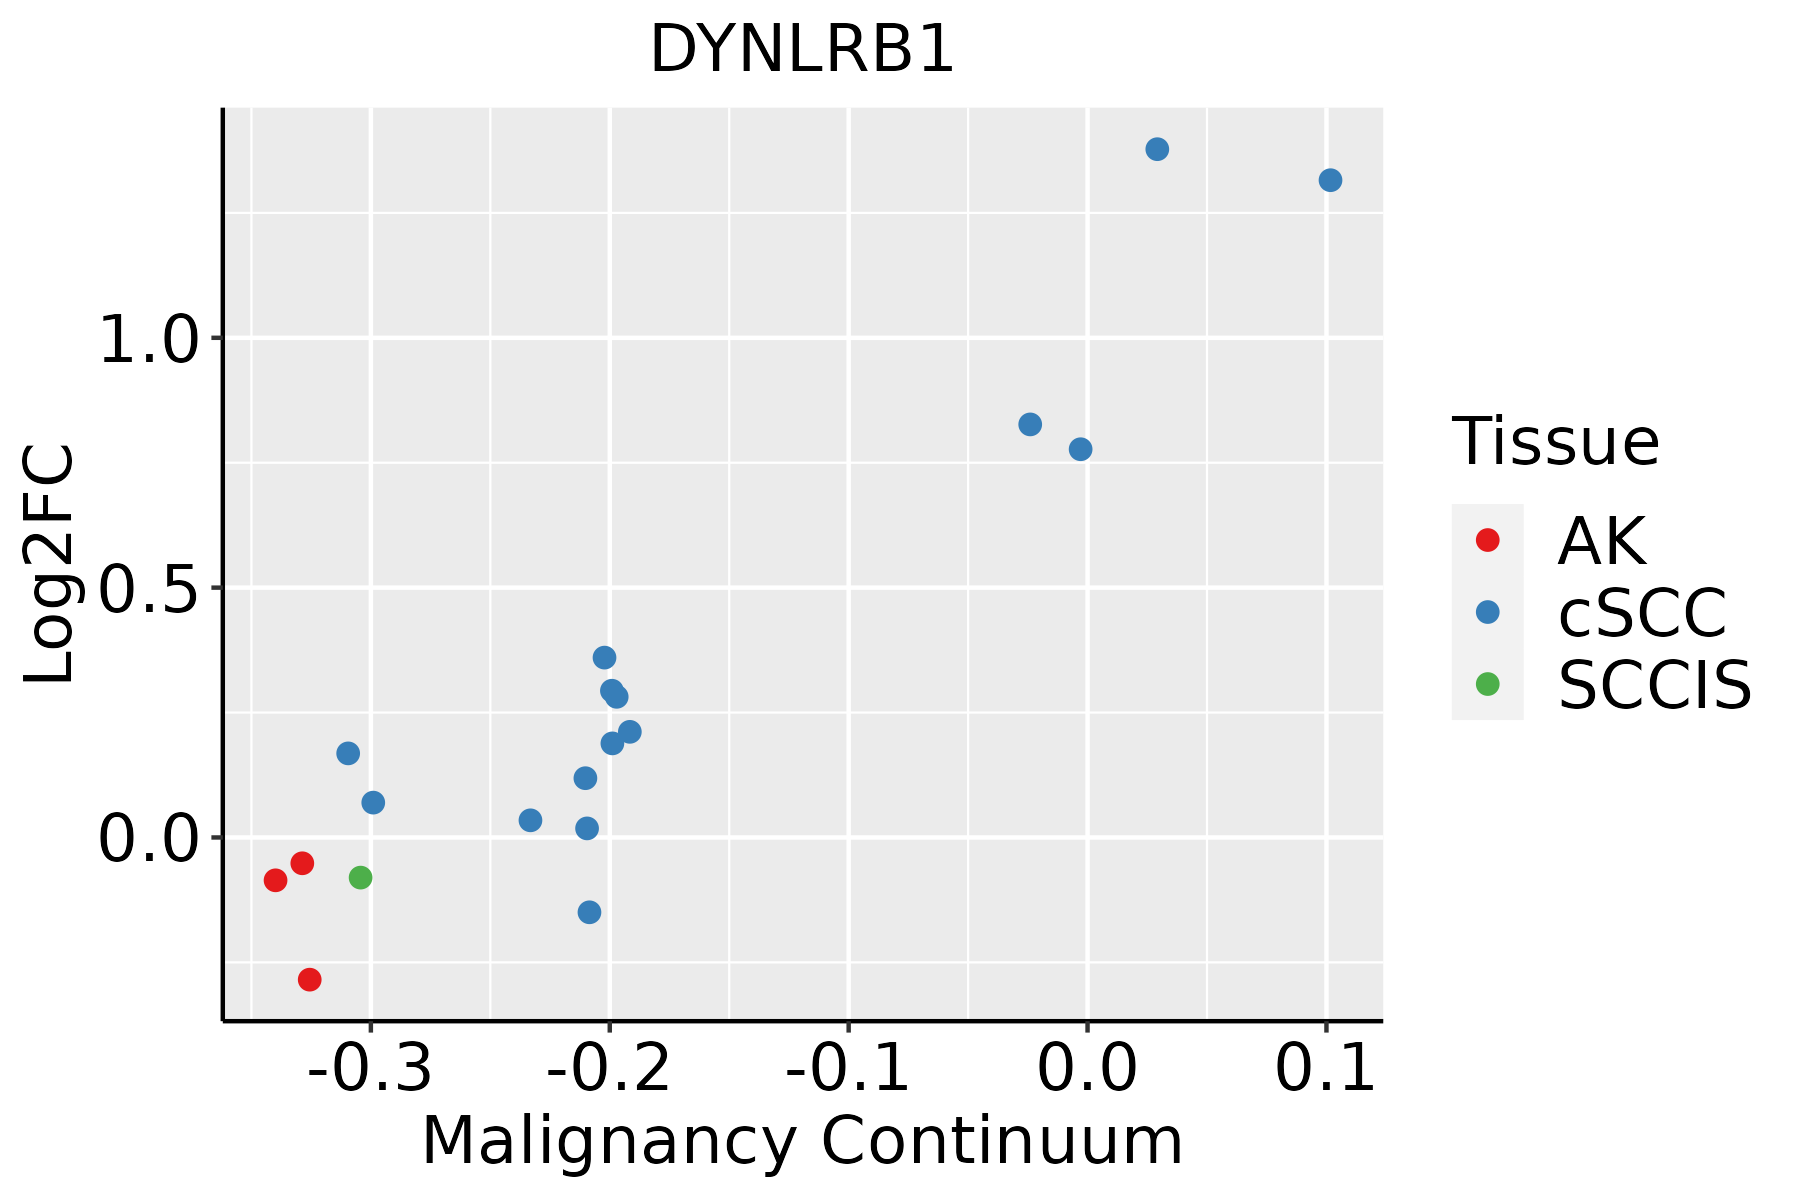 | AK: Actinic keratosis |
| cSCC: Cutaneous squamous cell carcinoma | ||
| SCCIS:squamous cell carcinoma in situ | ||
| Thyroid |  | ATC: Anaplastic thyroid cancer |
| HT: Hashimoto's thyroiditis | ||
| PTC: Papillary thyroid cancer |
| ∗log2FC in expression of this searched gene in stem-like cells from each diseased tissue sample relative to stem-like cells in normal samples in each tissue plotted against the malignancy continuum. Samples are colored based on if they are from different disease stage. |
Top |
Malignant transformation related pathway analysis |
| Find out the enriched GO biological processes and KEGG pathways involved in transition from healthy to precancer to cancer |
| Tissue | Disease Stage | Enriched GO biological Processes |
| Colorectum | AD |  |
| Colorectum | SER |  |
| Colorectum | MSS |  |
| Colorectum | MSI-H |  |
| Colorectum | FAP |  |
| ∗Top 15 enriched GO BP terms are showed in the bar plot of each disease state in each tissue. Each row represents a significant GO biological process which is colored according to the -log10(p.adjust). |
| Page: 1 2 3 4 5 6 7 8 9 |
| GO ID | Tissue | Disease Stage | Description | Gene Ratio | Bg Ratio | pvalue | p.adjust | Count |
| GO:00093148 | Breast | Precancer | response to radiation | 47/1080 | 456/18723 | 8.39e-05 | 1.62e-03 | 47 |
| GO:000931412 | Breast | IDC | response to radiation | 62/1434 | 456/18723 | 6.91e-06 | 2.10e-04 | 62 |
| GO:000931422 | Breast | DCIS | response to radiation | 62/1390 | 456/18723 | 2.56e-06 | 8.87e-05 | 62 |
| GO:00093149 | Cervix | CC | response to radiation | 86/2311 | 456/18723 | 3.50e-05 | 5.63e-04 | 86 |
| GO:00094163 | Cervix | CC | response to light stimulus | 54/2311 | 320/18723 | 1.03e-02 | 4.97e-02 | 54 |
| GO:000931410 | Endometrium | AEH | response to radiation | 70/2100 | 456/18723 | 3.99e-03 | 2.68e-02 | 70 |
| GO:000931413 | Endometrium | EEC | response to radiation | 71/2168 | 456/18723 | 5.69e-03 | 3.42e-02 | 71 |
| GO:000931418 | Esophagus | HGIN | response to radiation | 88/2587 | 456/18723 | 6.26e-04 | 8.65e-03 | 88 |
| GO:00094165 | Esophagus | HGIN | response to light stimulus | 61/2587 | 320/18723 | 5.20e-03 | 4.30e-02 | 61 |
| GO:000931419 | Esophagus | ESCC | response to radiation | 277/8552 | 456/18723 | 4.42e-11 | 1.43e-09 | 277 |
| GO:000941611 | Esophagus | ESCC | response to light stimulus | 183/8552 | 320/18723 | 2.03e-05 | 1.76e-04 | 183 |
| GO:00093146 | Liver | HCC | response to radiation | 223/7958 | 456/18723 | 3.08e-03 | 1.43e-02 | 223 |
| GO:000931416 | Oral cavity | OSCC | response to radiation | 241/7305 | 456/18723 | 9.76e-10 | 2.40e-08 | 241 |
| GO:00094164 | Oral cavity | OSCC | response to light stimulus | 159/7305 | 320/18723 | 5.98e-05 | 4.92e-04 | 159 |
| GO:000931417 | Oral cavity | LP | response to radiation | 155/4623 | 456/18723 | 4.12e-06 | 8.49e-05 | 155 |
| GO:000931432 | Oral cavity | NEOLP | response to radiation | 71/2005 | 456/18723 | 7.84e-04 | 6.25e-03 | 71 |
| GO:000931414 | Prostate | BPH | response to radiation | 105/3107 | 456/18723 | 2.07e-04 | 1.70e-03 | 105 |
| GO:000931415 | Prostate | Tumor | response to radiation | 109/3246 | 456/18723 | 1.94e-04 | 1.70e-03 | 109 |
| GO:000931424 | Skin | cSCC | response to radiation | 166/4864 | 456/18723 | 4.37e-07 | 8.41e-06 | 166 |
| GO:000941621 | Skin | cSCC | response to light stimulus | 107/4864 | 320/18723 | 1.66e-03 | 1.02e-02 | 107 |
| Page: 1 2 |
| Pathway ID | Tissue | Disease Stage | Description | Gene Ratio | Bg Ratio | pvalue | p.adjust | qvalue | Count |
| hsa0513218 | Breast | Precancer | Salmonella infection | 49/684 | 249/8465 | 2.92e-09 | 6.15e-08 | 4.71e-08 | 49 |
| hsa0513219 | Breast | Precancer | Salmonella infection | 49/684 | 249/8465 | 2.92e-09 | 6.15e-08 | 4.71e-08 | 49 |
| hsa0513224 | Breast | IDC | Salmonella infection | 55/867 | 249/8465 | 2.07e-08 | 4.49e-07 | 3.36e-07 | 55 |
| hsa0513234 | Breast | IDC | Salmonella infection | 55/867 | 249/8465 | 2.07e-08 | 4.49e-07 | 3.36e-07 | 55 |
| hsa0513243 | Breast | DCIS | Salmonella infection | 55/846 | 249/8465 | 8.71e-09 | 1.87e-07 | 1.38e-07 | 55 |
| hsa0513253 | Breast | DCIS | Salmonella infection | 55/846 | 249/8465 | 8.71e-09 | 1.87e-07 | 1.38e-07 | 55 |
| hsa0513220 | Cervix | CC | Salmonella infection | 74/1267 | 249/8465 | 1.33e-09 | 2.54e-08 | 1.50e-08 | 74 |
| hsa05132110 | Cervix | CC | Salmonella infection | 74/1267 | 249/8465 | 1.33e-09 | 2.54e-08 | 1.50e-08 | 74 |
| hsa0513244 | Cervix | N_HPV | Salmonella infection | 28/349 | 249/8465 | 1.18e-06 | 1.64e-05 | 1.28e-05 | 28 |
| hsa0513254 | Cervix | N_HPV | Salmonella infection | 28/349 | 249/8465 | 1.18e-06 | 1.64e-05 | 1.28e-05 | 28 |
| hsa05132 | Colorectum | AD | Salmonella infection | 102/2092 | 249/8465 | 7.65e-09 | 1.28e-07 | 8.17e-08 | 102 |
| hsa051321 | Colorectum | AD | Salmonella infection | 102/2092 | 249/8465 | 7.65e-09 | 1.28e-07 | 8.17e-08 | 102 |
| hsa051322 | Colorectum | SER | Salmonella infection | 77/1580 | 249/8465 | 1.56e-06 | 2.35e-05 | 1.71e-05 | 77 |
| hsa051323 | Colorectum | SER | Salmonella infection | 77/1580 | 249/8465 | 1.56e-06 | 2.35e-05 | 1.71e-05 | 77 |
| hsa051324 | Colorectum | MSS | Salmonella infection | 92/1875 | 249/8465 | 5.23e-08 | 9.74e-07 | 5.97e-07 | 92 |
| hsa051325 | Colorectum | MSS | Salmonella infection | 92/1875 | 249/8465 | 5.23e-08 | 9.74e-07 | 5.97e-07 | 92 |
| hsa051328 | Colorectum | FAP | Salmonella infection | 67/1404 | 249/8465 | 2.04e-05 | 2.52e-04 | 1.53e-04 | 67 |
| hsa051329 | Colorectum | FAP | Salmonella infection | 67/1404 | 249/8465 | 2.04e-05 | 2.52e-04 | 1.53e-04 | 67 |
| hsa0513226 | Endometrium | AEH | Salmonella infection | 71/1197 | 249/8465 | 1.69e-09 | 3.44e-08 | 2.52e-08 | 71 |
| hsa048144 | Endometrium | AEH | Motor proteins | 42/1197 | 193/8465 | 2.41e-03 | 1.42e-02 | 1.04e-02 | 42 |
| Page: 1 2 3 |
Top |
Cell-cell communication analysis |
| Identification of potential cell-cell interactions between two cell types and their ligand-receptor pairs for different disease states |
| Ligand | Receptor | LRpair | Pathway | Tissue | Disease Stage |
| Page: 1 |
Top |
Single-cell gene regulatory network inference analysis |
| Find out the significant the regulons (TFs) and the target genes of each regulon across cell types for different disease states |
| TF | Cell Type | Tissue | Disease Stage | Target Gene | RSS | Regulon Activity |
| ∗The dot plots of a searched regulon are shown for all cell subpopulations in each disease state of each tissue based on the regulon specific score inferred using pySCENIC and by calculating the average expression. |
| Page: 1 |
Top |
Somatic mutation of malignant transformation related genes |
| Annotation of somatic variants for genes involved in malignant transformation |
| Hugo Symbol | Variant Class | Variant Classification | dbSNP RS | HGVSc | HGVSp | HGVSp Short | SWISSPROT | BIOTYPE | SIFT | PolyPhen | Tumor Sample Barcode | Tissue | Histology | Sex | Age | Stage | Therapy Types | Drugs | Outcome |
| DYNLRB1 | SNV | Missense_Mutation | novel | c.257N>G | p.Tyr86Cys | p.Y86C | Q9NP97 | protein_coding | deleterious(0) | probably_damaging(0.918) | TCGA-DS-A5RQ-01 | Cervix | cervical & endocervical cancer | Female | >=65 | I/II | Chemotherapy | cisplatin | CR |
| DYNLRB1 | SNV | Missense_Mutation | c.214C>T | p.Arg72Cys | p.R72C | Q9NP97 | protein_coding | deleterious(0.03) | possibly_damaging(0.803) | TCGA-AA-A00N-01 | Colorectum | colon adenocarcinoma | Male | >=65 | I/II | Unknown | Unknown | PD | |
| DYNLRB1 | SNV | Missense_Mutation | c.160C>T | p.Arg54Trp | p.R54W | Q9NP97 | protein_coding | deleterious(0.01) | benign(0.065) | TCGA-B5-A0K9-01 | Endometrium | uterine corpus endometrioid carcinoma | Female | >=65 | I/II | Unknown | Unknown | SD | |
| DYNLRB1 | SNV | Missense_Mutation | rs754704650 | c.64G>A | p.Val22Ile | p.V22I | Q9NP97 | protein_coding | tolerated(0.93) | benign(0.059) | TCGA-FI-A2D0-01 | Endometrium | uterine corpus endometrioid carcinoma | Female | <65 | I/II | Unknown | Unknown | SD |
| DYNLRB1 | SNV | Missense_Mutation | novel | c.9G>T | p.Glu3Asp | p.E3D | Q9NP97 | protein_coding | tolerated(0.17) | benign(0.12) | TCGA-73-A9RS-01 | Lung | lung adenocarcinoma | Male | <65 | I/II | Chemotherapy | carboplatin | PD |
| DYNLRB1 | SNV | Missense_Mutation | novel | c.205N>T | p.Leu69Phe | p.L69F | Q9NP97 | protein_coding | tolerated(0.06) | probably_damaging(0.919) | TCGA-21-1079-01 | Lung | lung squamous cell carcinoma | Male | >=65 | III/IV | Unknown | Unknown | PD |
| DYNLRB1 | SNV | Missense_Mutation | c.223N>G | p.Lys75Glu | p.K75E | Q9NP97 | protein_coding | deleterious(0) | possibly_damaging(0.629) | TCGA-63-5131-01 | Lung | lung squamous cell carcinoma | Male | Unknown | I/II | Unknown | Unknown | SD | |
| DYNLRB1 | SNV | Missense_Mutation | novel | c.269N>C | p.Val90Ala | p.V90A | Q9NP97 | protein_coding | deleterious(0.01) | benign(0.077) | TCGA-CN-4738-01 | Oral cavity | head & neck squamous cell carcinoma | Male | <65 | I/II | Unknown | Unknown | SD |
| DYNLRB1 | SNV | Missense_Mutation | c.136N>G | p.Met46Val | p.M46V | Q9NP97 | protein_coding | tolerated(0.2) | benign(0.001) | TCGA-HU-A4GN-01 | Stomach | stomach adenocarcinoma | Male | <65 | I/II | Chemotherapy | mitomycin | PD | |
| DYNLRB1 | SNV | Missense_Mutation | novel | c.103N>A | p.Asp35Asn | p.D35N | Q9NP97 | protein_coding | tolerated(0.07) | possibly_damaging(0.6) | TCGA-IN-A6RL-01 | Stomach | stomach adenocarcinoma | Male | >=65 | III/IV | Unknown | Unknown | PD |
| Page: 1 |
Top |
Related drugs of malignant transformation related genes |
| Identification of chemicals and drugs interact with genes involved in malignant transfromation |
| (DGIdb 4.0) |
| Entrez ID | Symbol | Category | Interaction Types | Drug Claim Name | Drug Name | PMIDs |
| Page: 1 |

Copyright 2023-Present -The University of Texas Health Science Center at Houston |