
|
|||||
|
 | |
| |
| |
| |
| |
| |
|
Gene: DYNLL2 |
Gene summary for DYNLL2 |
| Gene information | Species | Human | Gene symbol | DYNLL2 | Gene ID | 140735 |
| Gene name | dynein light chain LC8-type 2 | |
| Gene Alias | DNCL1B | |
| Cytomap | 17q22 | |
| Gene Type | protein-coding | GO ID | GO:0006996 | UniProtAcc | Q96FJ2 |
Top |
Malignant transformation analysis |
| Identification of the aberrant gene expression in precancerous and cancerous lesions by comparing the gene expression of stem-like cells in diseased tissues with normal stem cells |
| Entrez ID | Symbol | Replicates | Species | Organ | Tissue | Adj P-value | Log2FC | Malignancy |
| 140735 | DYNLL2 | HTA11_3410_2000001011 | Human | Colorectum | AD | 2.53e-08 | 2.28e-01 | 0.0155 |
| 140735 | DYNLL2 | HTA11_2487_2000001011 | Human | Colorectum | SER | 1.39e-21 | 6.94e-01 | -0.1808 |
| 140735 | DYNLL2 | HTA11_1938_2000001011 | Human | Colorectum | AD | 3.23e-17 | 6.73e-01 | -0.0811 |
| 140735 | DYNLL2 | HTA11_78_2000001011 | Human | Colorectum | AD | 3.90e-11 | 5.08e-01 | -0.1088 |
| 140735 | DYNLL2 | HTA11_347_2000001011 | Human | Colorectum | AD | 5.41e-39 | 7.95e-01 | -0.1954 |
| 140735 | DYNLL2 | HTA11_411_2000001011 | Human | Colorectum | SER | 5.33e-13 | 9.86e-01 | -0.2602 |
| 140735 | DYNLL2 | HTA11_2112_2000001011 | Human | Colorectum | SER | 1.83e-05 | 7.36e-01 | -0.2196 |
| 140735 | DYNLL2 | HTA11_3361_2000001011 | Human | Colorectum | AD | 3.87e-15 | 7.20e-01 | -0.1207 |
| 140735 | DYNLL2 | HTA11_83_2000001011 | Human | Colorectum | SER | 8.30e-14 | 6.98e-01 | -0.1526 |
| 140735 | DYNLL2 | HTA11_696_2000001011 | Human | Colorectum | AD | 1.95e-38 | 7.67e-01 | -0.1464 |
| 140735 | DYNLL2 | HTA11_866_2000001011 | Human | Colorectum | AD | 2.57e-16 | 4.29e-01 | -0.1001 |
| 140735 | DYNLL2 | HTA11_1391_2000001011 | Human | Colorectum | AD | 3.16e-30 | 7.86e-01 | -0.059 |
| 140735 | DYNLL2 | HTA11_2992_2000001011 | Human | Colorectum | SER | 1.00e-10 | 7.00e-01 | -0.1706 |
| 140735 | DYNLL2 | HTA11_5212_2000001011 | Human | Colorectum | AD | 1.34e-16 | 7.25e-01 | -0.2061 |
| 140735 | DYNLL2 | HTA11_5216_2000001011 | Human | Colorectum | SER | 3.70e-08 | 5.03e-01 | -0.1462 |
| 140735 | DYNLL2 | HTA11_546_2000001011 | Human | Colorectum | AD | 3.76e-10 | 5.44e-01 | -0.0842 |
| 140735 | DYNLL2 | HTA11_7862_2000001011 | Human | Colorectum | AD | 2.39e-05 | 3.06e-01 | -0.0179 |
| 140735 | DYNLL2 | HTA11_866_3004761011 | Human | Colorectum | AD | 1.77e-19 | 5.20e-01 | 0.096 |
| 140735 | DYNLL2 | HTA11_4255_2000001011 | Human | Colorectum | SER | 3.42e-02 | 3.33e-01 | 0.0446 |
| 140735 | DYNLL2 | HTA11_9408_2000001011 | Human | Colorectum | AD | 4.47e-03 | 4.15e-01 | 0.0451 |
| Page: 1 2 3 4 5 6 7 8 |
| Tissue | Expression Dynamics | Abbreviation |
| Colorectum (GSE201348) |  | FAP: Familial adenomatous polyposis |
| CRC: Colorectal cancer | ||
| Colorectum (HTA11) |  | AD: Adenomas |
| SER: Sessile serrated lesions | ||
| MSI-H: Microsatellite-high colorectal cancer | ||
| MSS: Microsatellite stable colorectal cancer | ||
| Esophagus | 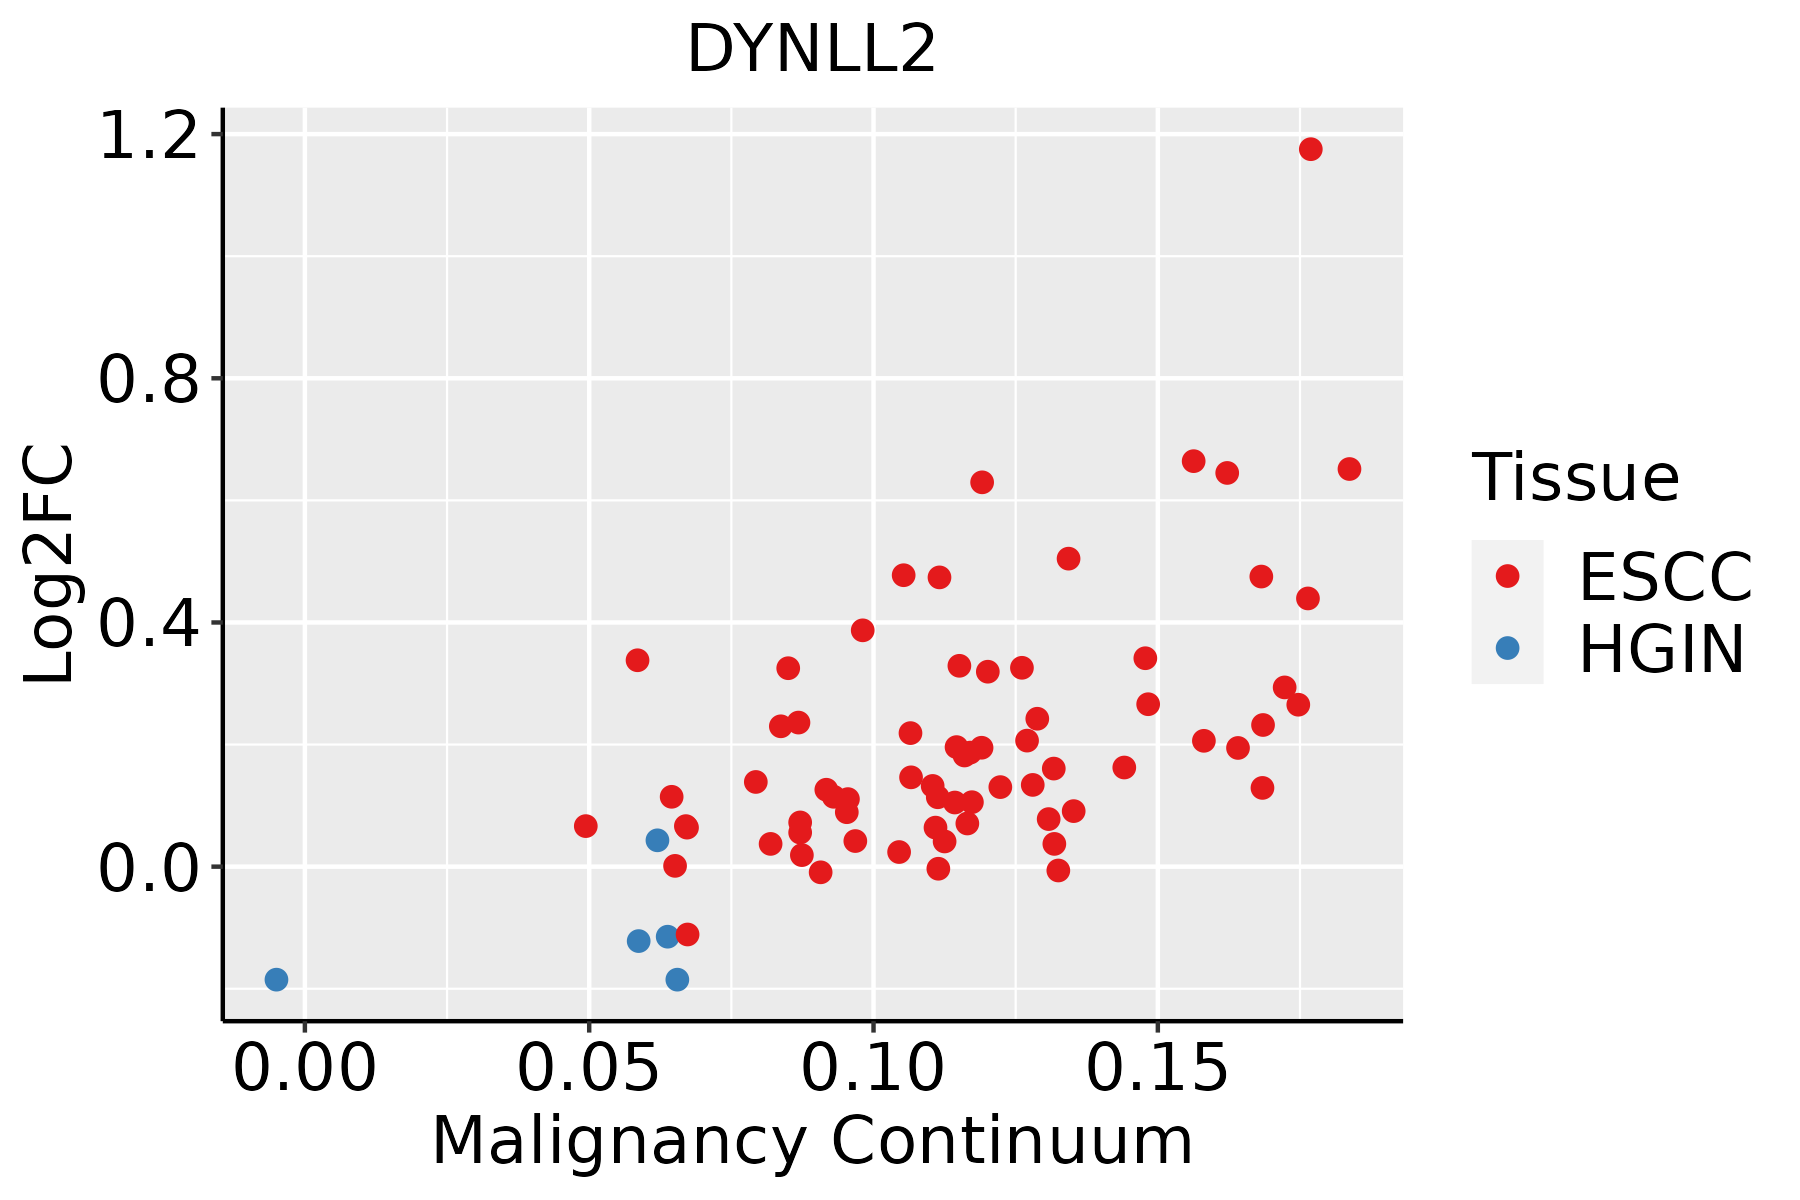 | ESCC: Esophageal squamous cell carcinoma |
| HGIN: High-grade intraepithelial neoplasias | ||
| LGIN: Low-grade intraepithelial neoplasias | ||
| Liver | 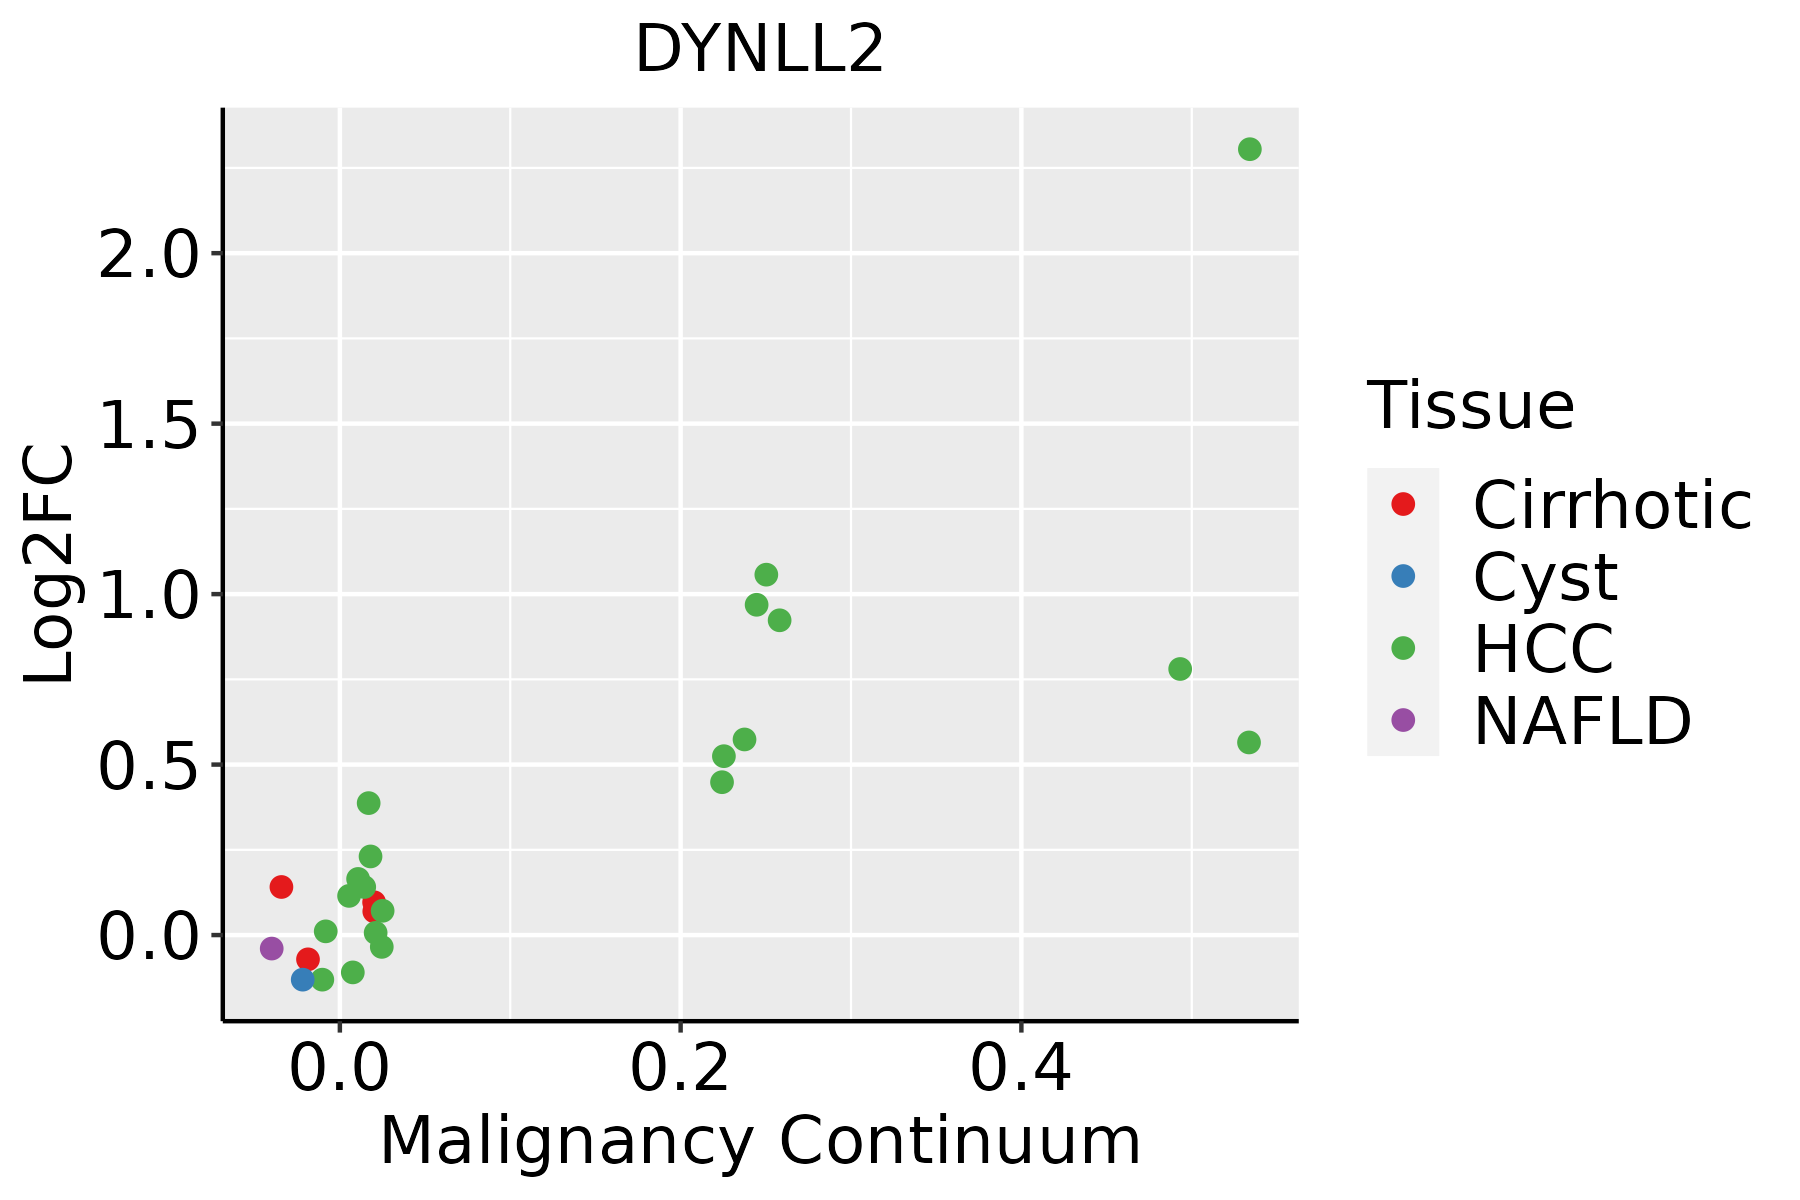 | HCC: Hepatocellular carcinoma |
| NAFLD: Non-alcoholic fatty liver disease | ||
| Oral Cavity | 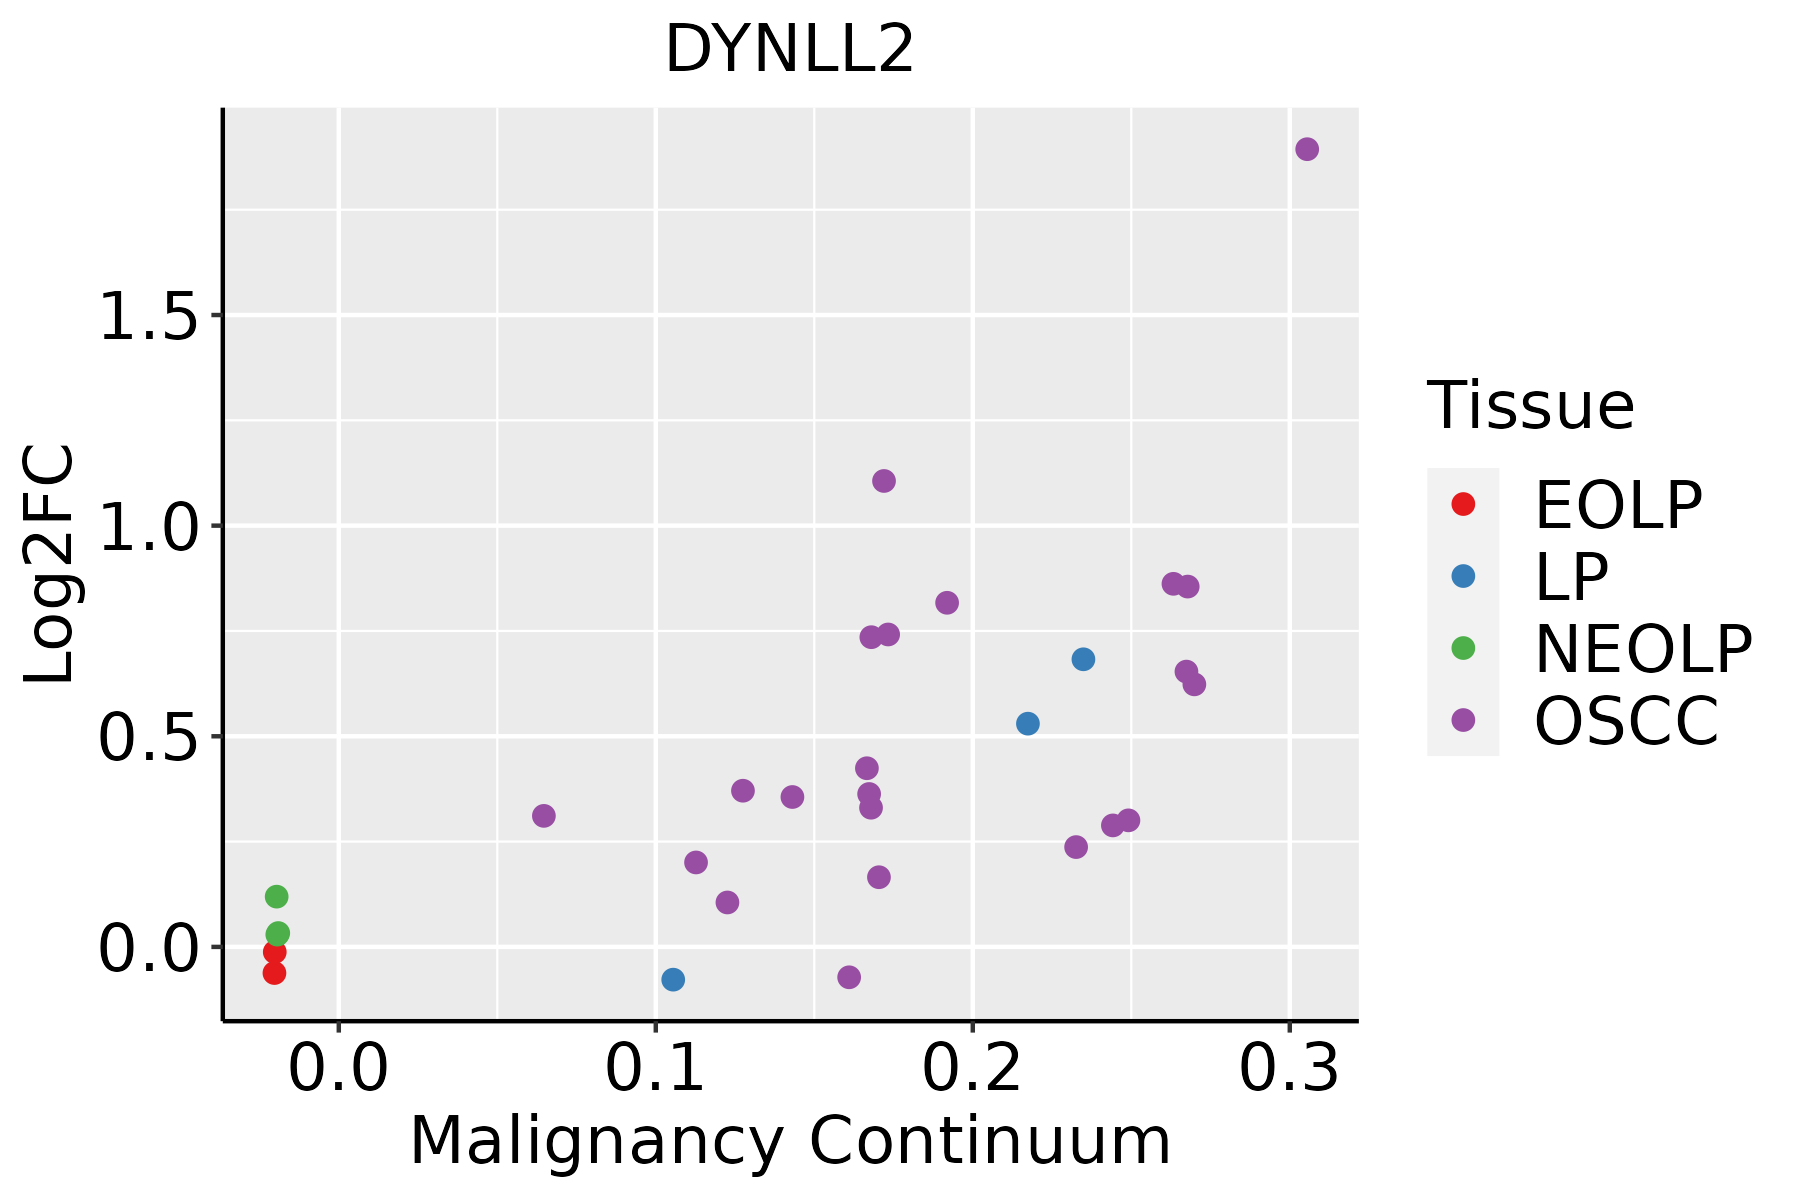 | EOLP: Erosive Oral lichen planus |
| LP: leukoplakia | ||
| NEOLP: Non-erosive oral lichen planus | ||
| OSCC: Oral squamous cell carcinoma | ||
| Prostate |  | BPH: Benign Prostatic Hyperplasia |
| Skin | 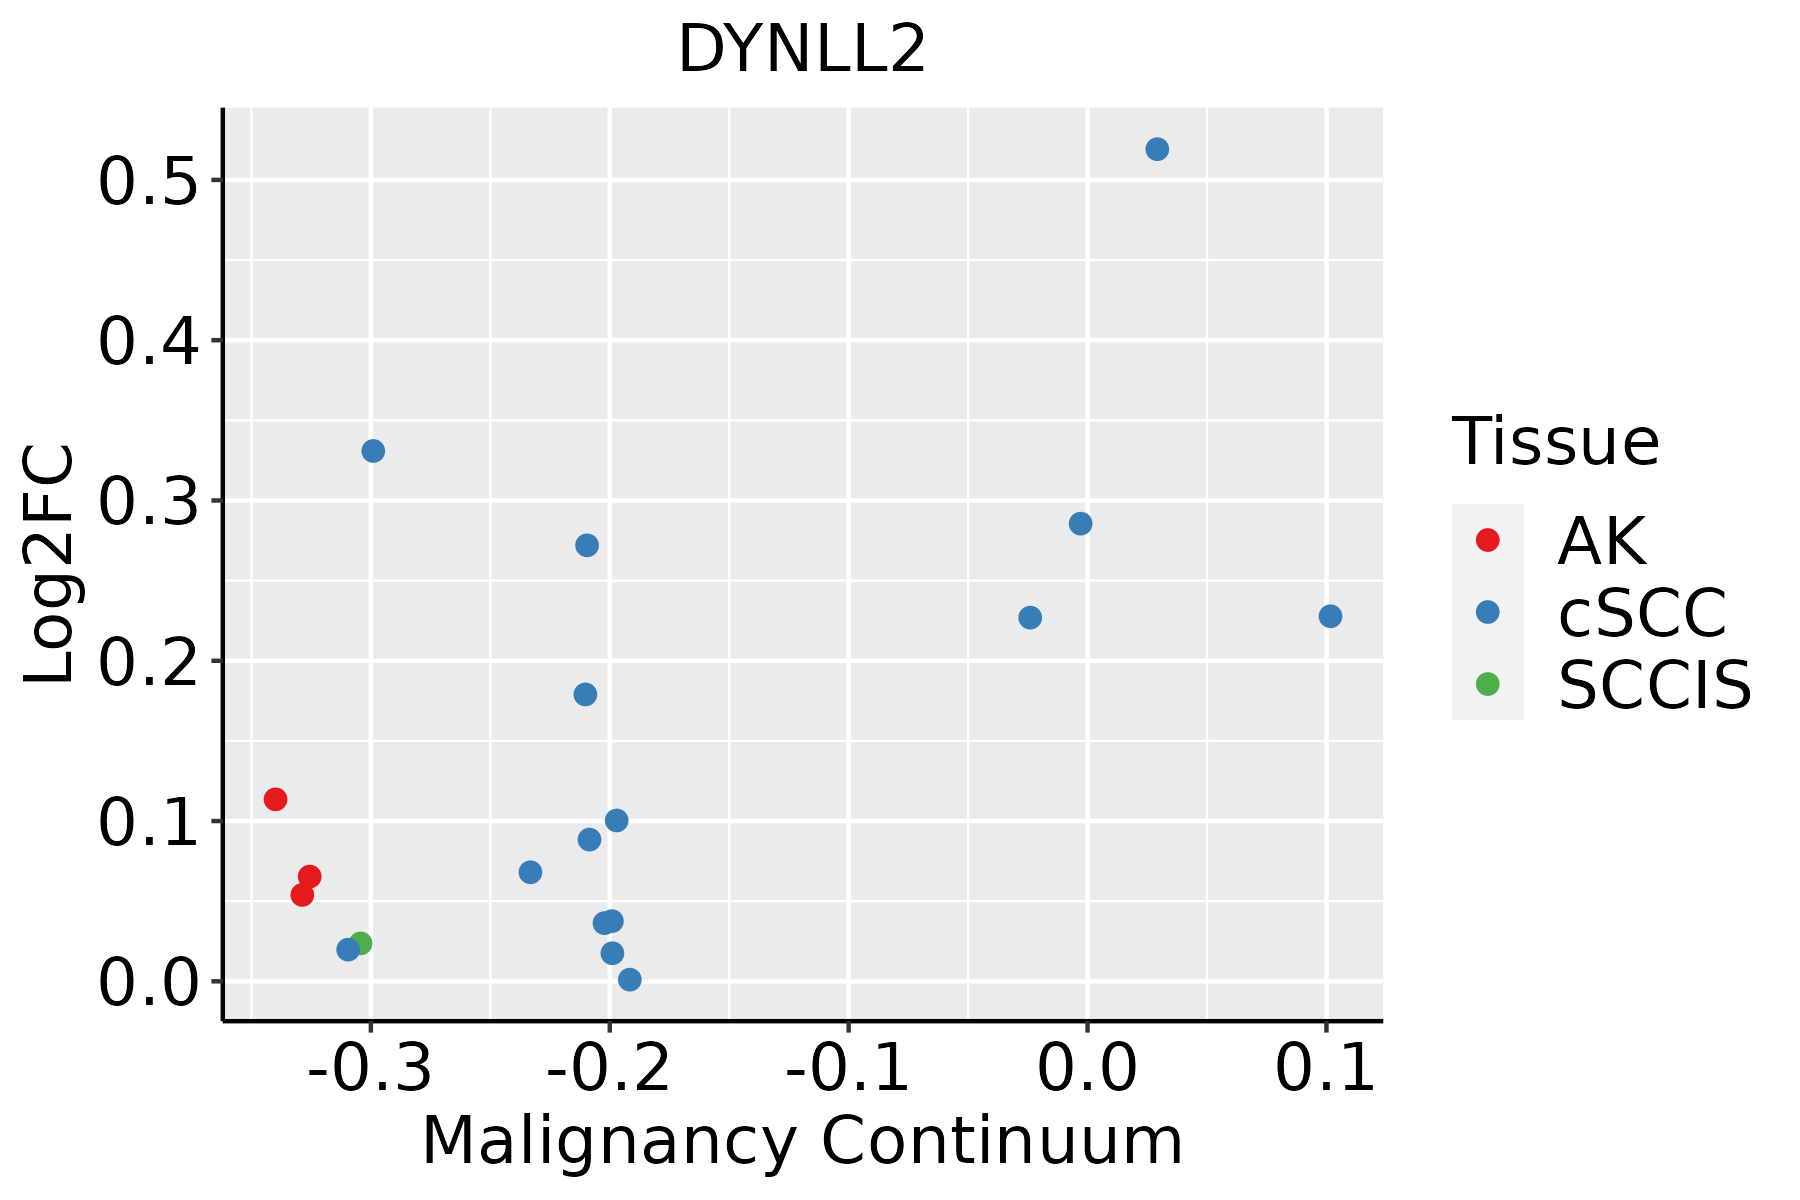 | AK: Actinic keratosis |
| cSCC: Cutaneous squamous cell carcinoma | ||
| SCCIS:squamous cell carcinoma in situ | ||
| Thyroid | 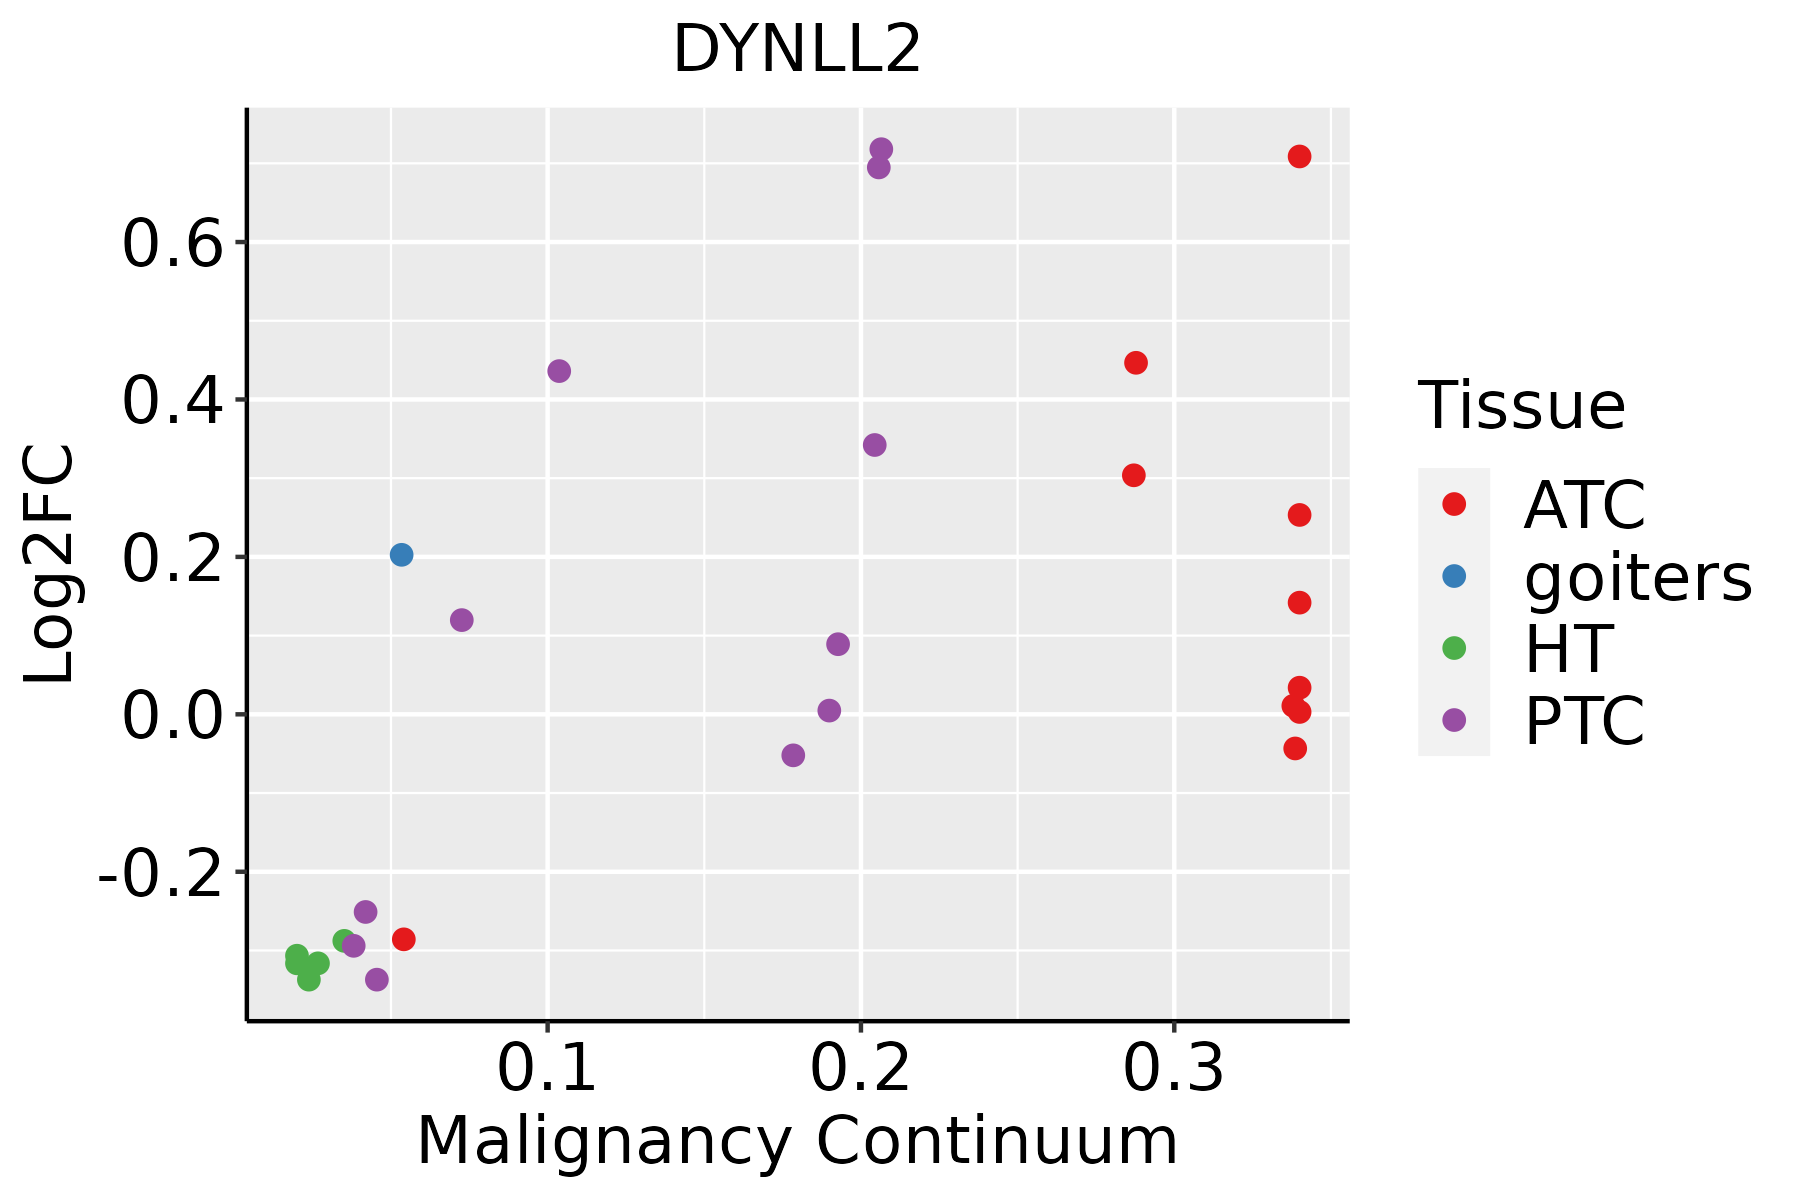 | ATC: Anaplastic thyroid cancer |
| HT: Hashimoto's thyroiditis | ||
| PTC: Papillary thyroid cancer |
| ∗log2FC in expression of this searched gene in stem-like cells from each diseased tissue sample relative to stem-like cells in normal samples in each tissue plotted against the malignancy continuum. Samples are colored based on if they are from different disease stage. |
Top |
Malignant transformation related pathway analysis |
| Find out the enriched GO biological processes and KEGG pathways involved in transition from healthy to precancer to cancer |
| Tissue | Disease Stage | Enriched GO biological Processes |
| Colorectum | AD |  |
| Colorectum | SER |  |
| Colorectum | MSS |  |
| Colorectum | MSI-H |  |
| Colorectum | FAP |  |
| ∗Top 15 enriched GO BP terms are showed in the bar plot of each disease state in each tissue. Each row represents a significant GO biological process which is colored according to the -log10(p.adjust). |
| Page: 1 2 3 4 5 6 7 8 9 |
| GO ID | Tissue | Disease Stage | Description | Gene Ratio | Bg Ratio | pvalue | p.adjust | Count |
| Page: 1 |
| Pathway ID | Tissue | Disease Stage | Description | Gene Ratio | Bg Ratio | pvalue | p.adjust | qvalue | Count |
| hsa05132 | Colorectum | AD | Salmonella infection | 102/2092 | 249/8465 | 7.65e-09 | 1.28e-07 | 8.17e-08 | 102 |
| hsa04962 | Colorectum | AD | Vasopressin-regulated water reabsorption | 19/2092 | 44/8465 | 5.48e-03 | 2.48e-02 | 1.58e-02 | 19 |
| hsa051321 | Colorectum | AD | Salmonella infection | 102/2092 | 249/8465 | 7.65e-09 | 1.28e-07 | 8.17e-08 | 102 |
| hsa049621 | Colorectum | AD | Vasopressin-regulated water reabsorption | 19/2092 | 44/8465 | 5.48e-03 | 2.48e-02 | 1.58e-02 | 19 |
| hsa051322 | Colorectum | SER | Salmonella infection | 77/1580 | 249/8465 | 1.56e-06 | 2.35e-05 | 1.71e-05 | 77 |
| hsa051323 | Colorectum | SER | Salmonella infection | 77/1580 | 249/8465 | 1.56e-06 | 2.35e-05 | 1.71e-05 | 77 |
| hsa051324 | Colorectum | MSS | Salmonella infection | 92/1875 | 249/8465 | 5.23e-08 | 9.74e-07 | 5.97e-07 | 92 |
| hsa049622 | Colorectum | MSS | Vasopressin-regulated water reabsorption | 17/1875 | 44/8465 | 9.76e-03 | 3.55e-02 | 2.18e-02 | 17 |
| hsa051325 | Colorectum | MSS | Salmonella infection | 92/1875 | 249/8465 | 5.23e-08 | 9.74e-07 | 5.97e-07 | 92 |
| hsa049623 | Colorectum | MSS | Vasopressin-regulated water reabsorption | 17/1875 | 44/8465 | 9.76e-03 | 3.55e-02 | 2.18e-02 | 17 |
| hsa051326 | Colorectum | MSI-H | Salmonella infection | 43/797 | 249/8465 | 5.91e-05 | 8.33e-04 | 6.98e-04 | 43 |
| hsa051327 | Colorectum | MSI-H | Salmonella infection | 43/797 | 249/8465 | 5.91e-05 | 8.33e-04 | 6.98e-04 | 43 |
| hsa05132211 | Esophagus | ESCC | Salmonella infection | 191/4205 | 249/8465 | 6.51e-19 | 5.45e-17 | 2.79e-17 | 191 |
| hsa0496223 | Esophagus | ESCC | Vasopressin-regulated water reabsorption | 33/4205 | 44/8465 | 5.27e-04 | 1.78e-03 | 9.13e-04 | 33 |
| hsa05132310 | Esophagus | ESCC | Salmonella infection | 191/4205 | 249/8465 | 6.51e-19 | 5.45e-17 | 2.79e-17 | 191 |
| hsa0496233 | Esophagus | ESCC | Vasopressin-regulated water reabsorption | 33/4205 | 44/8465 | 5.27e-04 | 1.78e-03 | 9.13e-04 | 33 |
| hsa0513222 | Liver | Cirrhotic | Salmonella infection | 121/2530 | 249/8465 | 2.47e-10 | 5.13e-09 | 3.16e-09 | 121 |
| hsa0513232 | Liver | Cirrhotic | Salmonella infection | 121/2530 | 249/8465 | 2.47e-10 | 5.13e-09 | 3.16e-09 | 121 |
| hsa0513242 | Liver | HCC | Salmonella infection | 178/4020 | 249/8465 | 5.90e-15 | 1.98e-13 | 1.10e-13 | 178 |
| hsa049624 | Liver | HCC | Vasopressin-regulated water reabsorption | 30/4020 | 44/8465 | 4.41e-03 | 1.32e-02 | 7.34e-03 | 30 |
| Page: 1 2 |
Top |
Cell-cell communication analysis |
| Identification of potential cell-cell interactions between two cell types and their ligand-receptor pairs for different disease states |
| Ligand | Receptor | LRpair | Pathway | Tissue | Disease Stage |
| Page: 1 |
Top |
Single-cell gene regulatory network inference analysis |
| Find out the significant the regulons (TFs) and the target genes of each regulon across cell types for different disease states |
| TF | Cell Type | Tissue | Disease Stage | Target Gene | RSS | Regulon Activity |
| ∗The dot plots of a searched regulon are shown for all cell subpopulations in each disease state of each tissue based on the regulon specific score inferred using pySCENIC and by calculating the average expression. |
| Page: 1 |
Top |
Somatic mutation of malignant transformation related genes |
| Annotation of somatic variants for genes involved in malignant transformation |
| Hugo Symbol | Variant Class | Variant Classification | dbSNP RS | HGVSc | HGVSp | HGVSp Short | SWISSPROT | BIOTYPE | SIFT | PolyPhen | Tumor Sample Barcode | Tissue | Histology | Sex | Age | Stage | Therapy Types | Drugs | Outcome |
| DYNLL2 | SNV | Missense_Mutation | novel | c.175N>A | p.Gly59Ser | p.G59S | Q96FJ2 | protein_coding | deleterious(0) | probably_damaging(0.986) | TCGA-CA-6717-01 | Colorectum | colon adenocarcinoma | Male | <65 | I/II | Chemotherapy | oxaliplatin | CR |
| DYNLL2 | SNV | Missense_Mutation | c.202N>T | p.His68Tyr | p.H68Y | Q96FJ2 | protein_coding | deleterious(0.04) | benign(0.181) | TCGA-AP-A059-01 | Endometrium | uterine corpus endometrioid carcinoma | Female | >=65 | I/II | Unknown | Unknown | SD | |
| DYNLL2 | SNV | Missense_Mutation | novel | c.116C>T | p.Ala39Val | p.A39V | Q96FJ2 | protein_coding | tolerated(0.12) | possibly_damaging(0.539) | TCGA-B5-A3FA-01 | Endometrium | uterine corpus endometrioid carcinoma | Female | >=65 | I/II | Unknown | Unknown | SD |
| DYNLL2 | SNV | Missense_Mutation | novel | c.30N>A | p.Asn10Lys | p.N10K | Q96FJ2 | protein_coding | deleterious(0.02) | possibly_damaging(0.644) | TCGA-B5-A5OC-01 | Endometrium | uterine corpus endometrioid carcinoma | Female | >=65 | III/IV | Chemotherapy | cisplatin | SD |
| DYNLL2 | SNV | Missense_Mutation | c.205G>A | p.Glu69Lys | p.E69K | Q96FJ2 | protein_coding | deleterious(0.03) | benign(0.382) | TCGA-BS-A0UV-01 | Endometrium | uterine corpus endometrioid carcinoma | Female | <65 | III/IV | Unknown | Unknown | SD | |
| DYNLL2 | SNV | Missense_Mutation | rs745581029 | c.64N>A | p.Val22Ile | p.V22I | Q96FJ2 | protein_coding | tolerated(0.52) | benign(0.03) | TCGA-EY-A215-01 | Endometrium | uterine corpus endometrioid carcinoma | Female | <65 | I/II | Unknown | Unknown | SD |
| DYNLL2 | SNV | Missense_Mutation | novel | c.263C>T | p.Ser88Leu | p.S88L | Q96FJ2 | protein_coding | deleterious(0) | probably_damaging(0.958) | TCGA-49-4512-01 | Lung | lung adenocarcinoma | Female | >=65 | III/IV | Unspecific | PD | |
| DYNLL2 | SNV | Missense_Mutation | c.58N>A | p.Asp20Asn | p.D20N | Q96FJ2 | protein_coding | tolerated(0.05) | benign(0.072) | TCGA-66-2758-01 | Lung | lung squamous cell carcinoma | Male | >=65 | I/II | Chemotherapy | cisplatin | CR | |
| DYNLL2 | deletion | In_Frame_Del | novel | c.140_151delNNNNNNNNNNNN | p.Lys48_Asn51del | p.K48_N51del | Q96FJ2 | protein_coding | TCGA-77-7465-01 | Lung | lung squamous cell carcinoma | Male | <65 | I/II | Unknown | Unknown | SD | ||
| DYNLL2 | SNV | Missense_Mutation | novel | c.31G>A | p.Ala11Thr | p.A11T | Q96FJ2 | protein_coding | tolerated(0.1) | benign(0.045) | TCGA-F7-A624-01 | Oral cavity | head & neck squamous cell carcinoma | Male | >=65 | I/II | Unknown | Unknown | SD |
| Page: 1 2 |
Top |
Related drugs of malignant transformation related genes |
| Identification of chemicals and drugs interact with genes involved in malignant transfromation |
| (DGIdb 4.0) |
| Entrez ID | Symbol | Category | Interaction Types | Drug Claim Name | Drug Name | PMIDs |
| Page: 1 |

Copyright 2023-Present -The University of Texas Health Science Center at Houston |