
|
|||||
|
 | |
| |
| |
| |
| |
| |
|
Gene: DYNLL1 |
Gene summary for DYNLL1 |
| Gene information | Species | Human | Gene symbol | DYNLL1 | Gene ID | 8655 |
| Gene name | dynein light chain LC8-type 1 | |
| Gene Alias | DLC1 | |
| Cytomap | 12q24.31 | |
| Gene Type | protein-coding | GO ID | GO:0000003 | UniProtAcc | P63167 |
Top |
Malignant transformation analysis |
| Identification of the aberrant gene expression in precancerous and cancerous lesions by comparing the gene expression of stem-like cells in diseased tissues with normal stem cells |
| Entrez ID | Symbol | Replicates | Species | Organ | Tissue | Adj P-value | Log2FC | Malignancy |
| 8655 | DYNLL1 | GSM4909277 | Human | Breast | Precancer | 1.57e-04 | 5.35e-01 | 0.0177 |
| 8655 | DYNLL1 | GSM4909280 | Human | Breast | Precancer | 2.23e-02 | 1.96e-01 | 0.0305 |
| 8655 | DYNLL1 | GSM4909281 | Human | Breast | IDC | 6.83e-17 | 4.48e-01 | 0.21 |
| 8655 | DYNLL1 | GSM4909282 | Human | Breast | IDC | 6.13e-05 | 3.12e-01 | -0.0288 |
| 8655 | DYNLL1 | GSM4909285 | Human | Breast | IDC | 4.89e-22 | 5.19e-01 | 0.21 |
| 8655 | DYNLL1 | GSM4909286 | Human | Breast | IDC | 7.88e-10 | 1.09e-01 | 0.1081 |
| 8655 | DYNLL1 | GSM4909288 | Human | Breast | IDC | 2.50e-10 | 4.83e-01 | 0.0988 |
| 8655 | DYNLL1 | GSM4909290 | Human | Breast | IDC | 2.92e-17 | 5.00e-01 | 0.2096 |
| 8655 | DYNLL1 | GSM4909291 | Human | Breast | IDC | 1.61e-14 | 4.83e-01 | 0.1753 |
| 8655 | DYNLL1 | GSM4909293 | Human | Breast | IDC | 6.04e-13 | 4.23e-01 | 0.1581 |
| 8655 | DYNLL1 | GSM4909296 | Human | Breast | IDC | 2.79e-17 | 3.59e-01 | 0.1524 |
| 8655 | DYNLL1 | GSM4909297 | Human | Breast | IDC | 3.92e-28 | 3.06e-01 | 0.1517 |
| 8655 | DYNLL1 | GSM4909298 | Human | Breast | IDC | 3.10e-05 | 2.44e-01 | 0.1551 |
| 8655 | DYNLL1 | GSM4909299 | Human | Breast | IDC | 7.86e-04 | 2.90e-01 | 0.035 |
| 8655 | DYNLL1 | GSM4909301 | Human | Breast | IDC | 3.67e-16 | 4.32e-01 | 0.1577 |
| 8655 | DYNLL1 | GSM4909304 | Human | Breast | IDC | 1.04e-26 | 4.78e-01 | 0.1636 |
| 8655 | DYNLL1 | GSM4909306 | Human | Breast | IDC | 6.56e-20 | 4.47e-01 | 0.1564 |
| 8655 | DYNLL1 | GSM4909307 | Human | Breast | IDC | 1.73e-05 | 3.17e-01 | 0.1569 |
| 8655 | DYNLL1 | GSM4909308 | Human | Breast | IDC | 2.11e-09 | 3.50e-01 | 0.158 |
| 8655 | DYNLL1 | GSM4909309 | Human | Breast | IDC | 2.09e-19 | 4.44e-01 | 0.0483 |
| Page: 1 2 3 4 5 6 7 8 9 10 11 12 13 14 15 16 17 |
| Tissue | Expression Dynamics | Abbreviation |
| Breast |  | IDC: Invasive ductal carcinoma |
| DCIS: Ductal carcinoma in situ | ||
| Precancer(BRCA1-mut): Precancerous lesion from BRCA1 mutation carriers | ||
| Cervix | 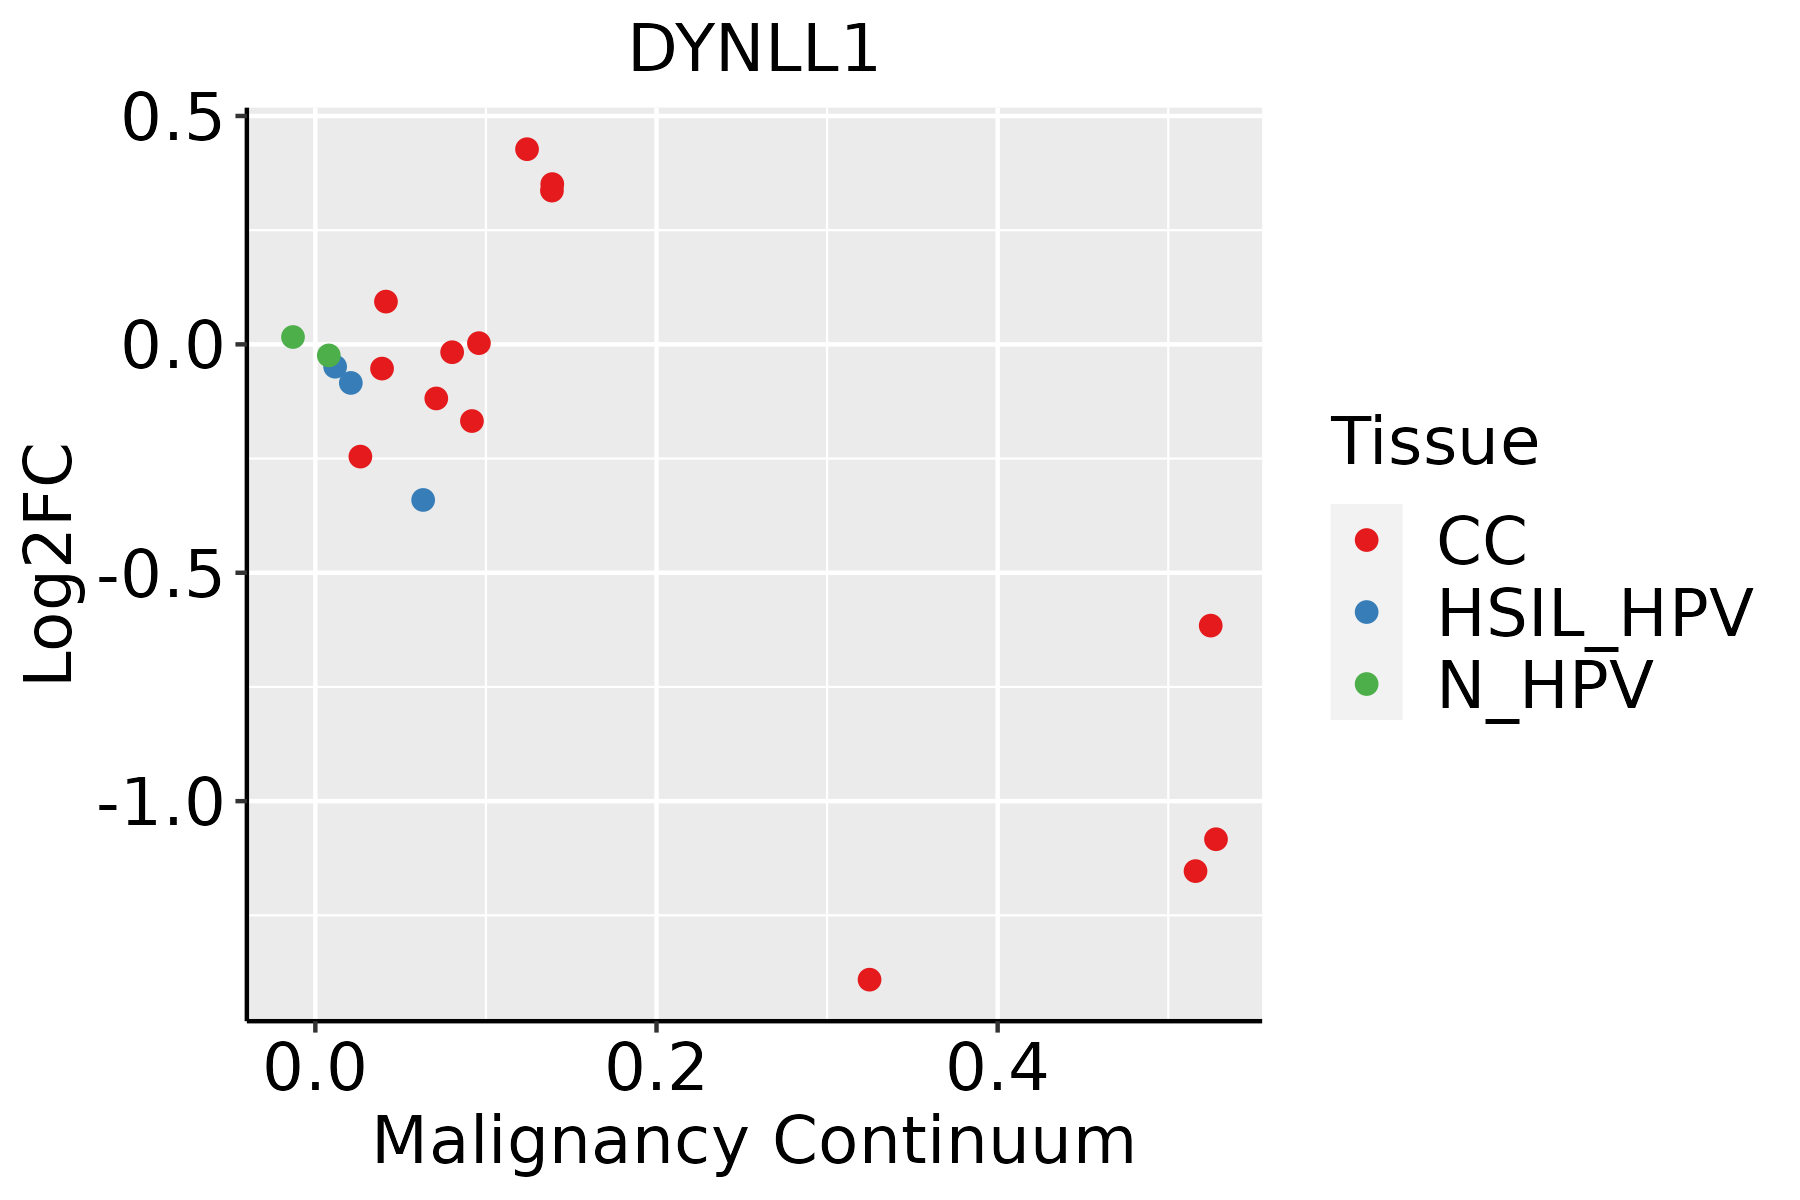 | CC: Cervix cancer |
| HSIL_HPV: HPV-infected high-grade squamous intraepithelial lesions | ||
| N_HPV: HPV-infected normal cervix | ||
| Colorectum (GSE201348) | 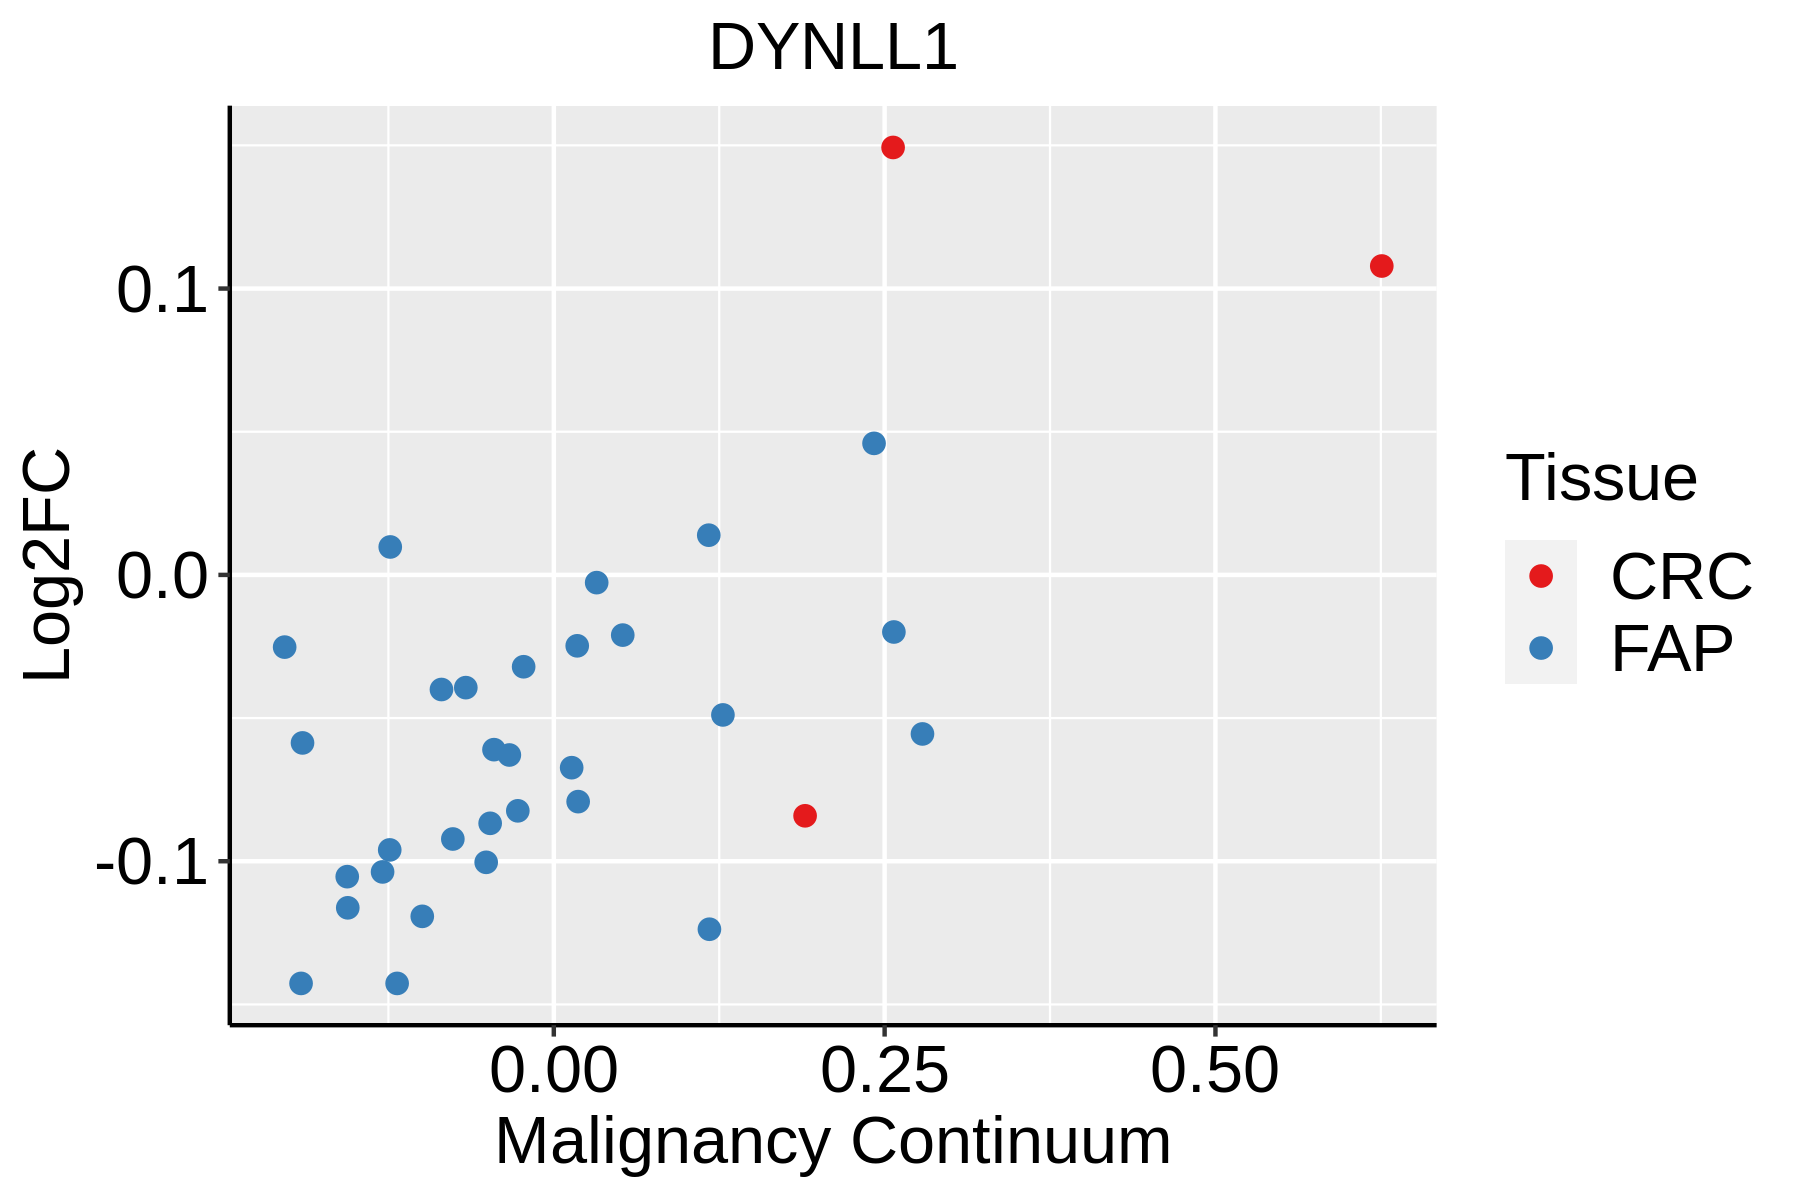 | FAP: Familial adenomatous polyposis |
| CRC: Colorectal cancer | ||
| Colorectum (HTA11) |  | AD: Adenomas |
| SER: Sessile serrated lesions | ||
| MSI-H: Microsatellite-high colorectal cancer | ||
| MSS: Microsatellite stable colorectal cancer | ||
| Endometrium |  | AEH: Atypical endometrial hyperplasia |
| EEC: Endometrioid Cancer | ||
| Esophagus | 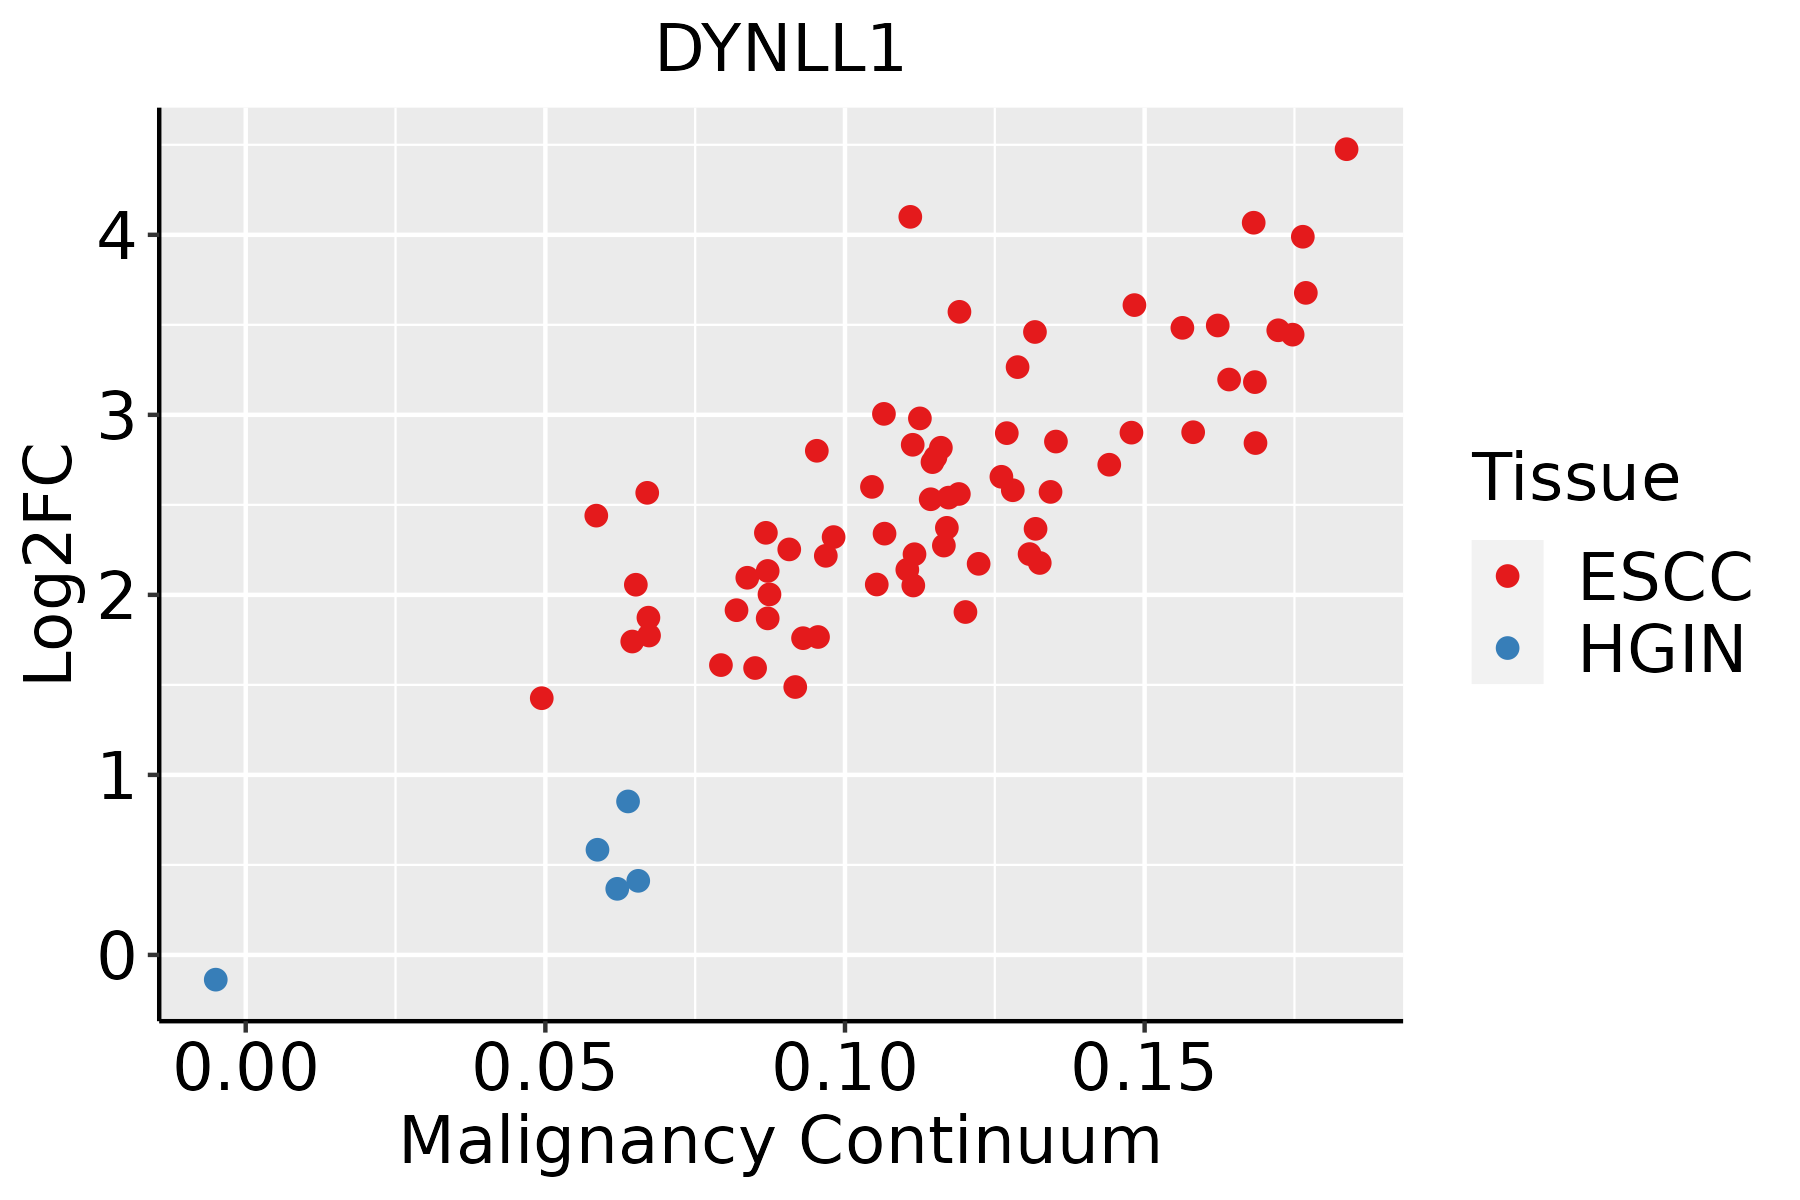 | ESCC: Esophageal squamous cell carcinoma |
| HGIN: High-grade intraepithelial neoplasias | ||
| LGIN: Low-grade intraepithelial neoplasias | ||
| GC | 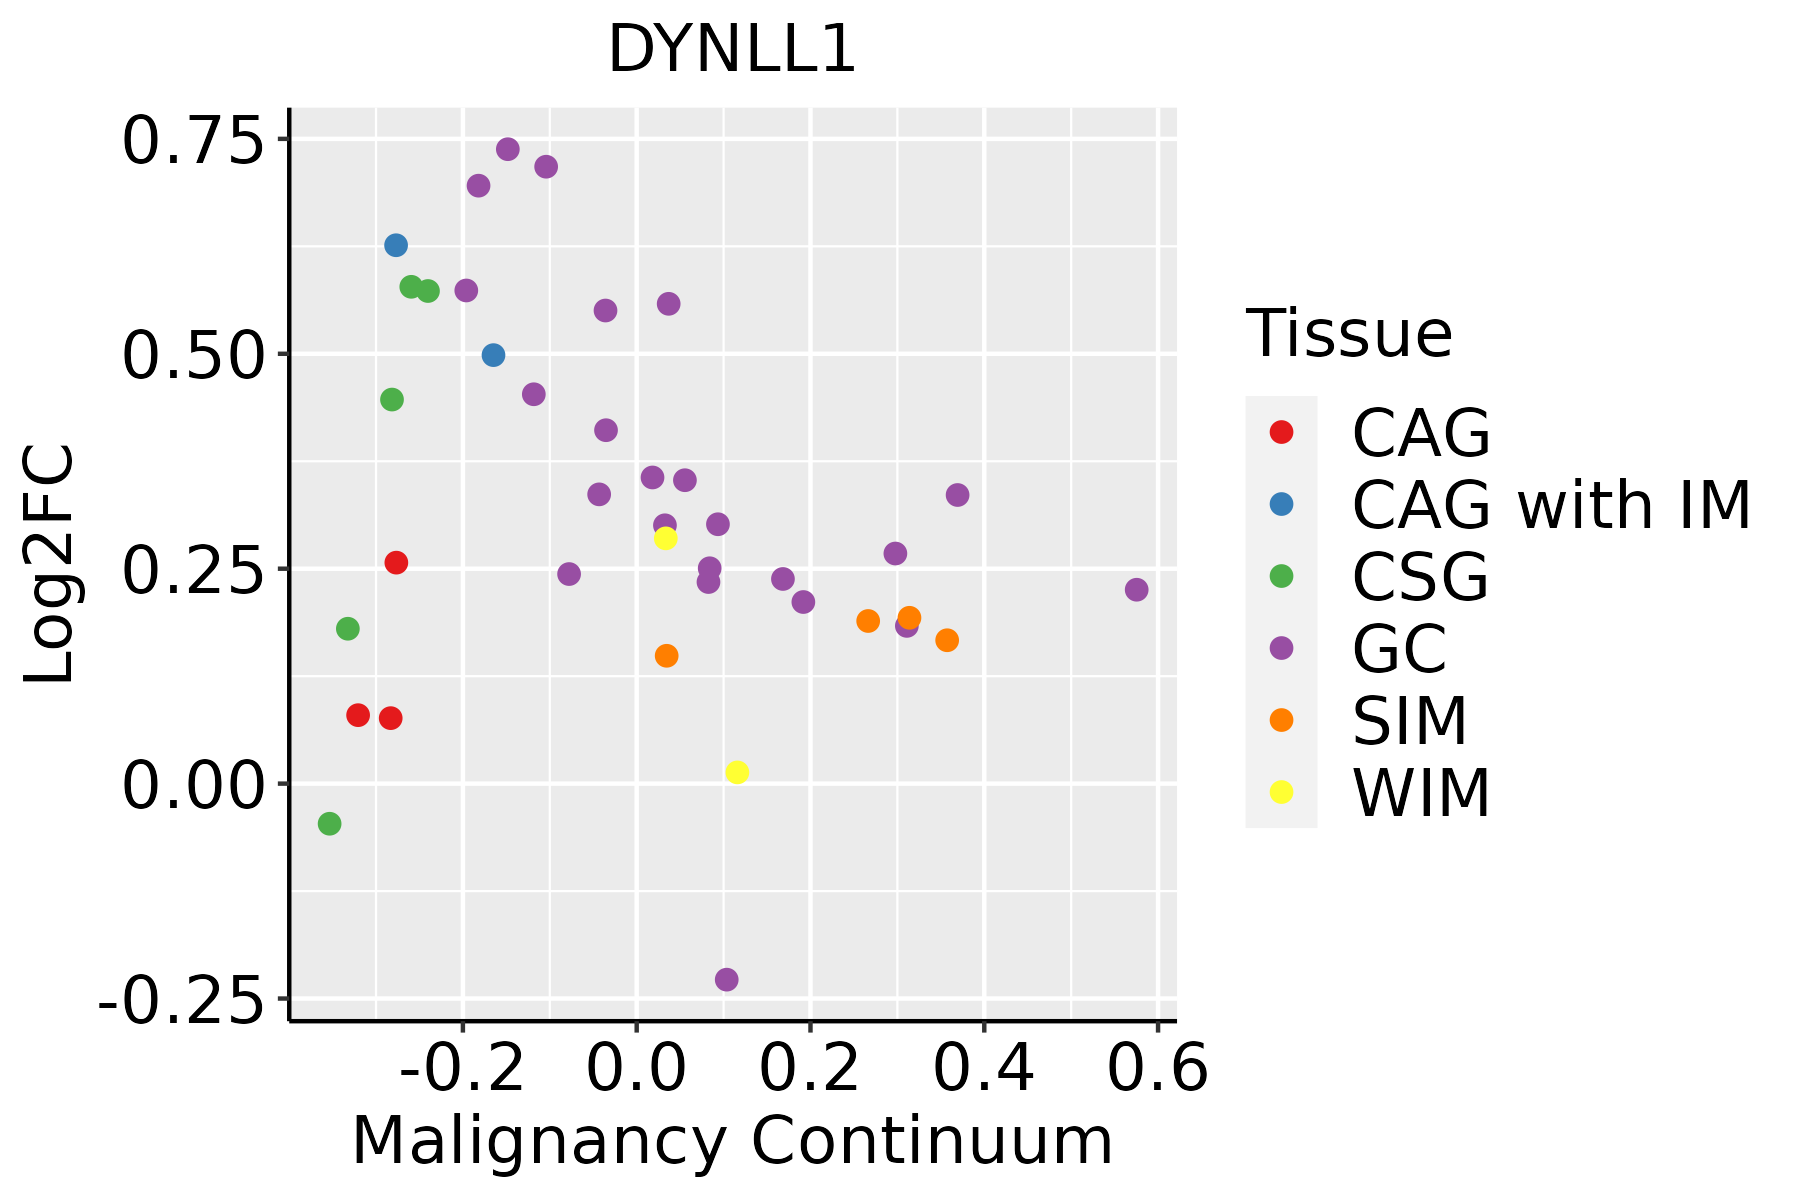 | CAG: Chronic atrophic gastritis |
| CAG with IM: Chronic atrophic gastritis with intestinal metaplasia | ||
| CSG: Chronic superficial gastritis | ||
| GC: Gastric cancer | ||
| SIM: Severe intestinal metaplasia | ||
| WIM: Wild intestinal metaplasia | ||
| Liver | 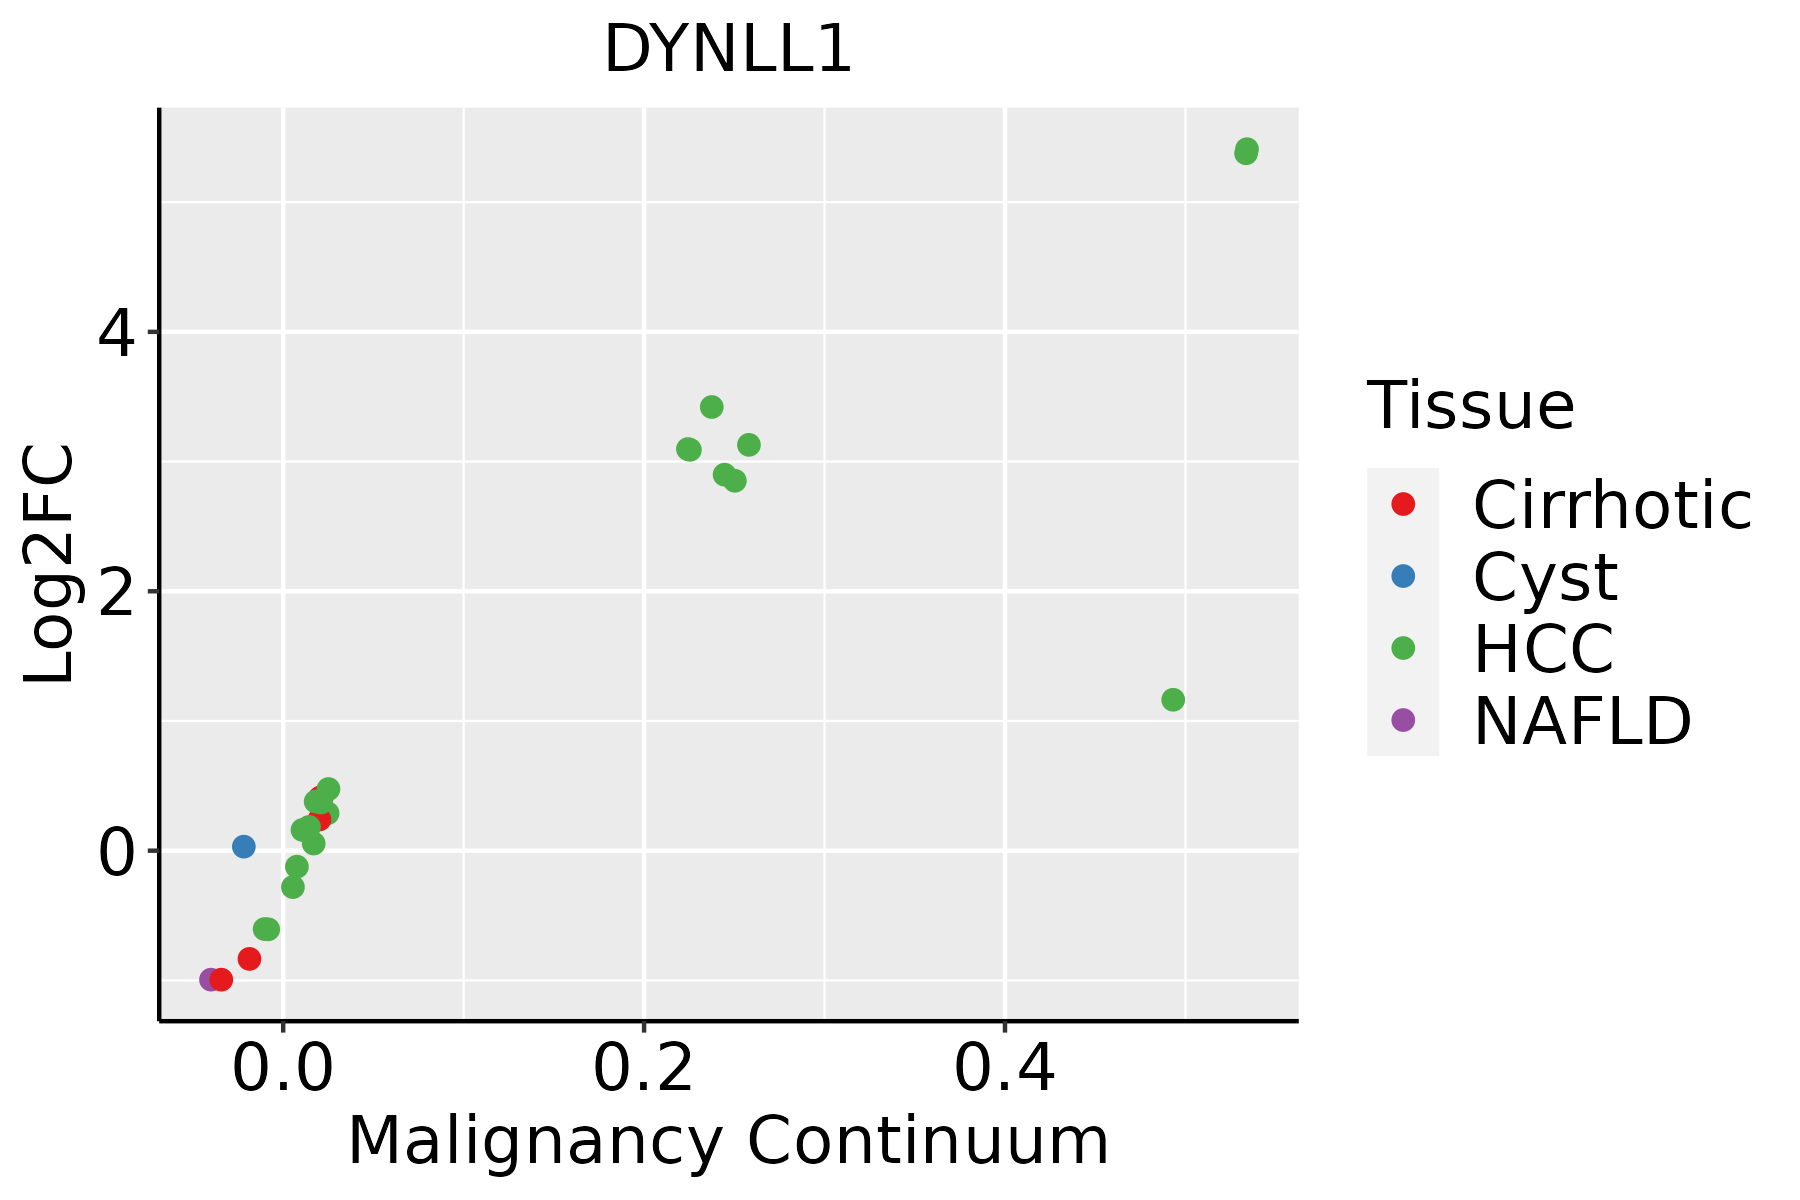 | HCC: Hepatocellular carcinoma |
| NAFLD: Non-alcoholic fatty liver disease | ||
| Lung | 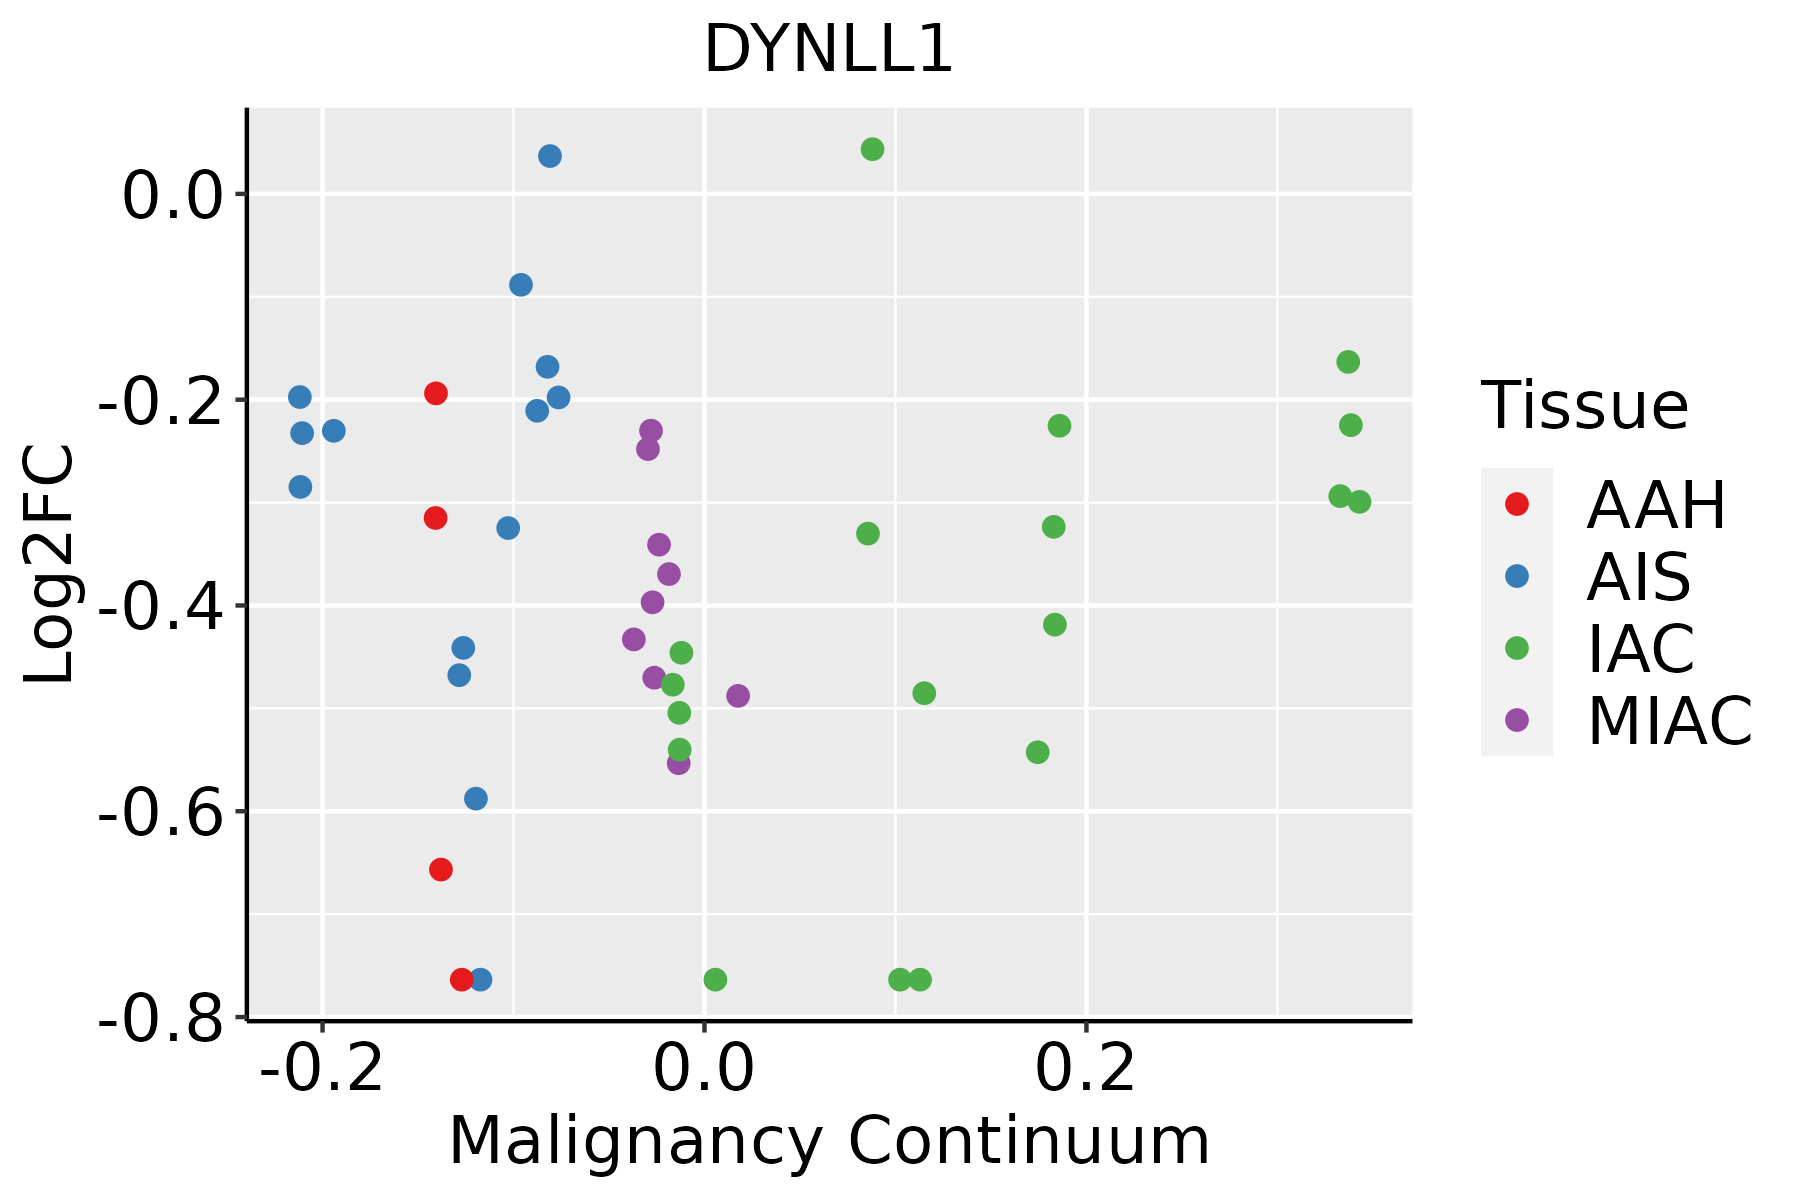 | AAH: Atypical adenomatous hyperplasia |
| AIS: Adenocarcinoma in situ | ||
| IAC: Invasive lung adenocarcinoma | ||
| MIA: Minimally invasive adenocarcinoma | ||
| Oral Cavity |  | EOLP: Erosive Oral lichen planus |
| LP: leukoplakia | ||
| NEOLP: Non-erosive oral lichen planus | ||
| OSCC: Oral squamous cell carcinoma | ||
| Prostate | 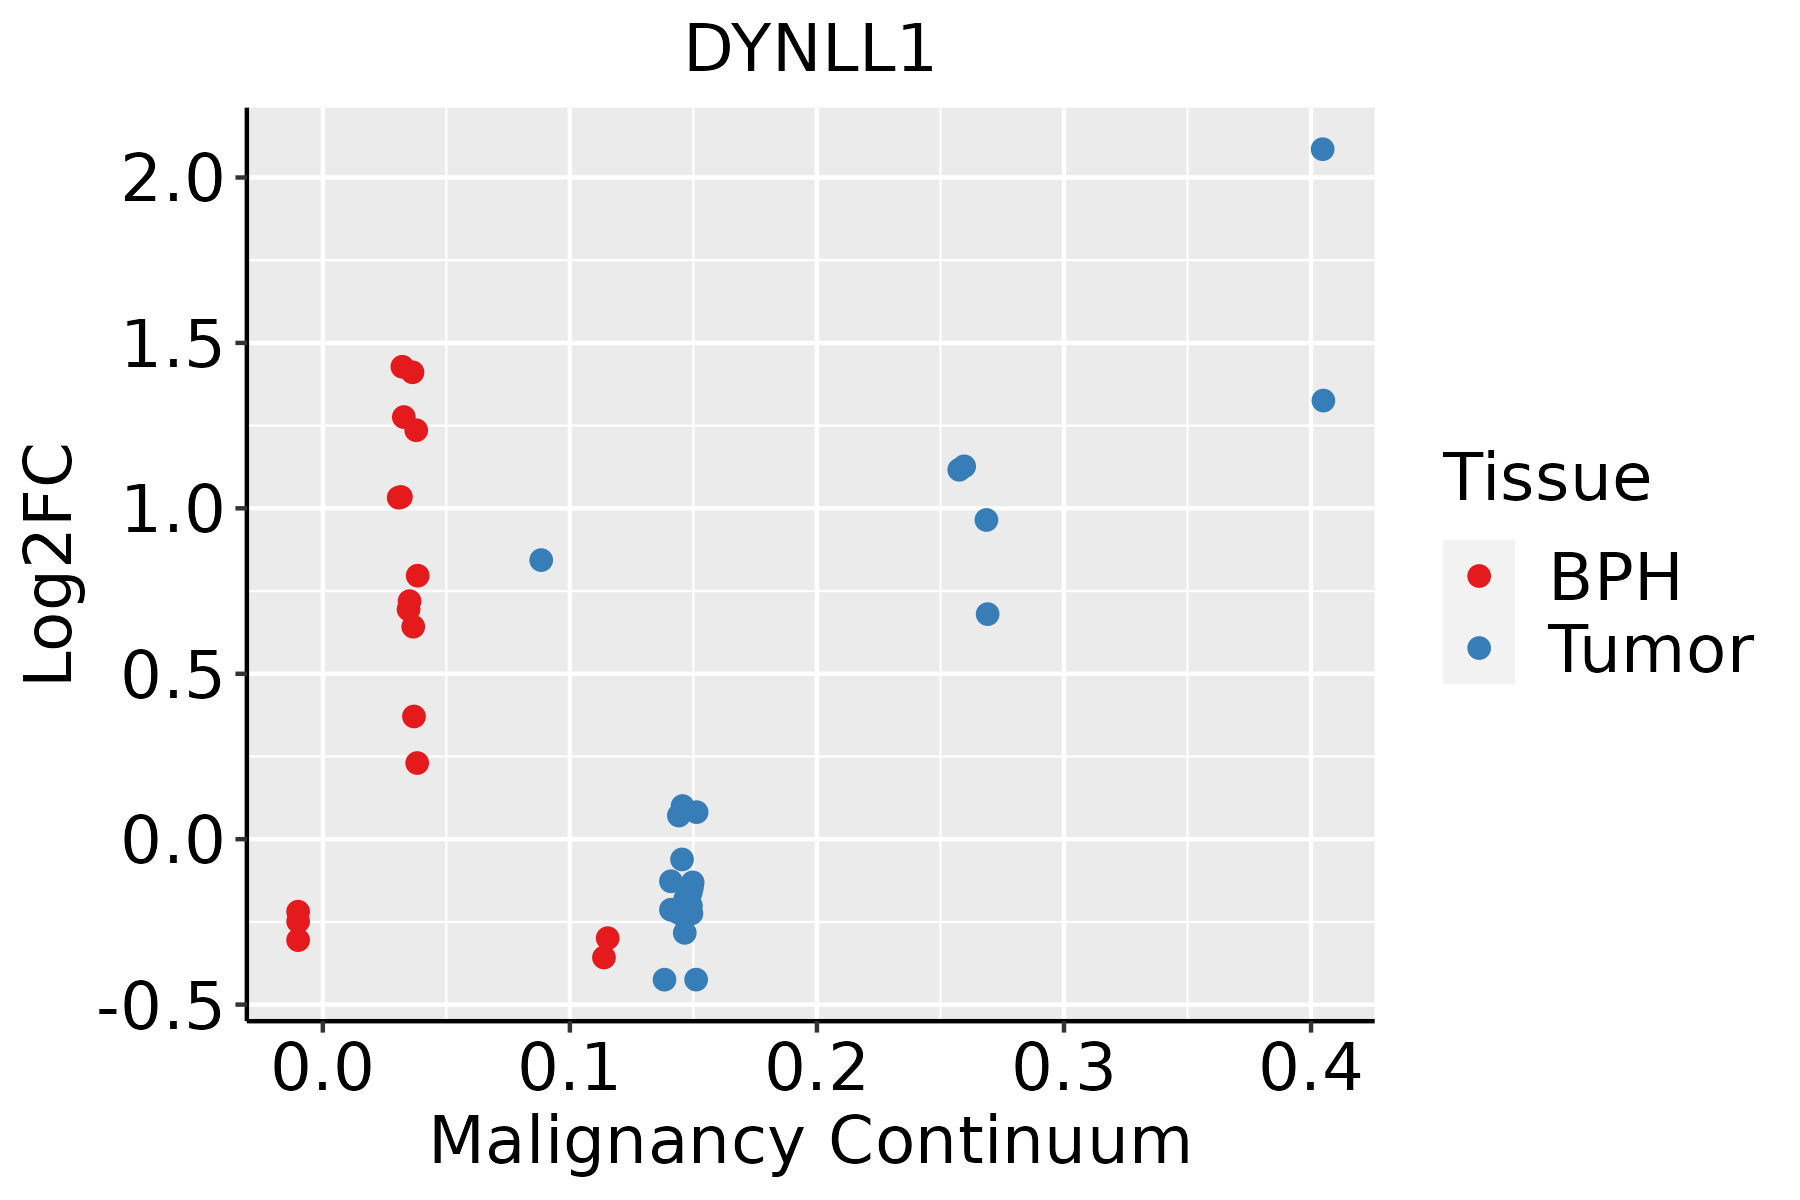 | BPH: Benign Prostatic Hyperplasia |
| Skin |  | AK: Actinic keratosis |
| cSCC: Cutaneous squamous cell carcinoma | ||
| SCCIS:squamous cell carcinoma in situ | ||
| Thyroid |  | ATC: Anaplastic thyroid cancer |
| HT: Hashimoto's thyroiditis | ||
| PTC: Papillary thyroid cancer |
| ∗log2FC in expression of this searched gene in stem-like cells from each diseased tissue sample relative to stem-like cells in normal samples in each tissue plotted against the malignancy continuum. Samples are colored based on if they are from different disease stage. |
Top |
Malignant transformation related pathway analysis |
| Find out the enriched GO biological processes and KEGG pathways involved in transition from healthy to precancer to cancer |
| Tissue | Disease Stage | Enriched GO biological Processes |
| Colorectum | AD |  |
| Colorectum | SER |  |
| Colorectum | MSS |  |
| Colorectum | MSI-H |  |
| Colorectum | FAP |  |
| ∗Top 15 enriched GO BP terms are showed in the bar plot of each disease state in each tissue. Each row represents a significant GO biological process which is colored according to the -log10(p.adjust). |
| Page: 1 2 3 4 5 6 7 8 9 |
| GO ID | Tissue | Disease Stage | Description | Gene Ratio | Bg Ratio | pvalue | p.adjust | Count |
| GO:00217629 | Breast | Precancer | substantia nigra development | 15/1080 | 44/18723 | 1.12e-08 | 7.98e-07 | 15 |
| GO:00309018 | Breast | Precancer | midbrain development | 20/1080 | 90/18723 | 1.50e-07 | 7.93e-06 | 20 |
| GO:00488578 | Breast | Precancer | neural nucleus development | 16/1080 | 64/18723 | 4.76e-07 | 2.11e-05 | 16 |
| GO:00342849 | Breast | Precancer | response to monosaccharide | 29/1080 | 225/18723 | 4.19e-05 | 9.00e-04 | 29 |
| GO:00097439 | Breast | Precancer | response to carbohydrate | 31/1080 | 253/18723 | 6.15e-05 | 1.25e-03 | 31 |
| GO:00425938 | Breast | Precancer | glucose homeostasis | 31/1080 | 258/18723 | 8.89e-05 | 1.69e-03 | 31 |
| GO:19049519 | Breast | Precancer | positive regulation of establishment of protein localization | 36/1080 | 319/18723 | 9.30e-05 | 1.75e-03 | 36 |
| GO:00335008 | Breast | Precancer | carbohydrate homeostasis | 31/1080 | 259/18723 | 9.56e-05 | 1.79e-03 | 31 |
| GO:00097469 | Breast | Precancer | response to hexose | 27/1080 | 219/18723 | 1.61e-04 | 2.69e-03 | 27 |
| GO:00097498 | Breast | Precancer | response to glucose | 25/1080 | 212/18723 | 5.46e-04 | 7.00e-03 | 25 |
| GO:00016787 | Breast | Precancer | cellular glucose homeostasis | 21/1080 | 172/18723 | 9.38e-04 | 1.06e-02 | 21 |
| GO:00713337 | Breast | Precancer | cellular response to glucose stimulus | 19/1080 | 151/18723 | 1.12e-03 | 1.23e-02 | 19 |
| GO:00713228 | Breast | Precancer | cellular response to carbohydrate stimulus | 20/1080 | 163/18723 | 1.15e-03 | 1.26e-02 | 20 |
| GO:00713317 | Breast | Precancer | cellular response to hexose stimulus | 19/1080 | 153/18723 | 1.31e-03 | 1.39e-02 | 19 |
| GO:00713267 | Breast | Precancer | cellular response to monosaccharide stimulus | 19/1080 | 154/18723 | 1.42e-03 | 1.48e-02 | 19 |
| GO:00512229 | Breast | Precancer | positive regulation of protein transport | 31/1080 | 303/18723 | 1.44e-03 | 1.50e-02 | 31 |
| GO:00507086 | Breast | Precancer | regulation of protein secretion | 28/1080 | 268/18723 | 1.76e-03 | 1.74e-02 | 28 |
| GO:00158336 | Breast | Precancer | peptide transport | 27/1080 | 264/18723 | 2.84e-03 | 2.49e-02 | 27 |
| GO:00900875 | Breast | Precancer | regulation of peptide transport | 22/1080 | 202/18723 | 3.14e-03 | 2.65e-02 | 22 |
| GO:00300736 | Breast | Precancer | insulin secretion | 21/1080 | 195/18723 | 4.38e-03 | 3.42e-02 | 21 |
| Page: 1 2 3 4 5 6 7 8 9 10 11 12 13 14 15 16 17 18 19 20 21 22 23 24 25 26 27 28 29 30 31 32 33 34 35 36 37 38 39 40 41 42 |
| Pathway ID | Tissue | Disease Stage | Description | Gene Ratio | Bg Ratio | pvalue | p.adjust | qvalue | Count |
| hsa0513218 | Breast | Precancer | Salmonella infection | 49/684 | 249/8465 | 2.92e-09 | 6.15e-08 | 4.71e-08 | 49 |
| hsa0513219 | Breast | Precancer | Salmonella infection | 49/684 | 249/8465 | 2.92e-09 | 6.15e-08 | 4.71e-08 | 49 |
| hsa0513224 | Breast | IDC | Salmonella infection | 55/867 | 249/8465 | 2.07e-08 | 4.49e-07 | 3.36e-07 | 55 |
| hsa0513234 | Breast | IDC | Salmonella infection | 55/867 | 249/8465 | 2.07e-08 | 4.49e-07 | 3.36e-07 | 55 |
| hsa0513243 | Breast | DCIS | Salmonella infection | 55/846 | 249/8465 | 8.71e-09 | 1.87e-07 | 1.38e-07 | 55 |
| hsa0513253 | Breast | DCIS | Salmonella infection | 55/846 | 249/8465 | 8.71e-09 | 1.87e-07 | 1.38e-07 | 55 |
| hsa0513220 | Cervix | CC | Salmonella infection | 74/1267 | 249/8465 | 1.33e-09 | 2.54e-08 | 1.50e-08 | 74 |
| hsa05132110 | Cervix | CC | Salmonella infection | 74/1267 | 249/8465 | 1.33e-09 | 2.54e-08 | 1.50e-08 | 74 |
| hsa0513225 | Cervix | HSIL_HPV | Salmonella infection | 34/459 | 249/8465 | 5.03e-07 | 1.13e-05 | 9.17e-06 | 34 |
| hsa0513235 | Cervix | HSIL_HPV | Salmonella infection | 34/459 | 249/8465 | 5.03e-07 | 1.13e-05 | 9.17e-06 | 34 |
| hsa05132 | Colorectum | AD | Salmonella infection | 102/2092 | 249/8465 | 7.65e-09 | 1.28e-07 | 8.17e-08 | 102 |
| hsa04962 | Colorectum | AD | Vasopressin-regulated water reabsorption | 19/2092 | 44/8465 | 5.48e-03 | 2.48e-02 | 1.58e-02 | 19 |
| hsa051321 | Colorectum | AD | Salmonella infection | 102/2092 | 249/8465 | 7.65e-09 | 1.28e-07 | 8.17e-08 | 102 |
| hsa049621 | Colorectum | AD | Vasopressin-regulated water reabsorption | 19/2092 | 44/8465 | 5.48e-03 | 2.48e-02 | 1.58e-02 | 19 |
| hsa051322 | Colorectum | SER | Salmonella infection | 77/1580 | 249/8465 | 1.56e-06 | 2.35e-05 | 1.71e-05 | 77 |
| hsa051323 | Colorectum | SER | Salmonella infection | 77/1580 | 249/8465 | 1.56e-06 | 2.35e-05 | 1.71e-05 | 77 |
| hsa051324 | Colorectum | MSS | Salmonella infection | 92/1875 | 249/8465 | 5.23e-08 | 9.74e-07 | 5.97e-07 | 92 |
| hsa049622 | Colorectum | MSS | Vasopressin-regulated water reabsorption | 17/1875 | 44/8465 | 9.76e-03 | 3.55e-02 | 2.18e-02 | 17 |
| hsa051325 | Colorectum | MSS | Salmonella infection | 92/1875 | 249/8465 | 5.23e-08 | 9.74e-07 | 5.97e-07 | 92 |
| hsa049623 | Colorectum | MSS | Vasopressin-regulated water reabsorption | 17/1875 | 44/8465 | 9.76e-03 | 3.55e-02 | 2.18e-02 | 17 |
| Page: 1 2 3 4 |
Top |
Cell-cell communication analysis |
| Identification of potential cell-cell interactions between two cell types and their ligand-receptor pairs for different disease states |
| Ligand | Receptor | LRpair | Pathway | Tissue | Disease Stage |
| Page: 1 |
Top |
Single-cell gene regulatory network inference analysis |
| Find out the significant the regulons (TFs) and the target genes of each regulon across cell types for different disease states |
| TF | Cell Type | Tissue | Disease Stage | Target Gene | RSS | Regulon Activity |
| ∗The dot plots of a searched regulon are shown for all cell subpopulations in each disease state of each tissue based on the regulon specific score inferred using pySCENIC and by calculating the average expression. |
| Page: 1 |
Top |
Somatic mutation of malignant transformation related genes |
| Annotation of somatic variants for genes involved in malignant transformation |
| Hugo Symbol | Variant Class | Variant Classification | dbSNP RS | HGVSc | HGVSp | HGVSp Short | SWISSPROT | BIOTYPE | SIFT | PolyPhen | Tumor Sample Barcode | Tissue | Histology | Sex | Age | Stage | Therapy Types | Drugs | Outcome |
| DYNLL1 | SNV | Missense_Mutation | rs11544060 | c.11N>A | p.Arg4Gln | p.R4Q | P63167 | protein_coding | tolerated(0.72) | benign(0.005) | TCGA-Q1-A5R2-01 | Cervix | cervical & endocervical cancer | Female | <65 | I/II | Chemotherapy | cisplatin | PR |
| DYNLL1 | SNV | Missense_Mutation | novel | c.140N>T | p.Asp47Val | p.D47V | P63167 | protein_coding | deleterious(0) | possibly_damaging(0.834) | TCGA-ZJ-AAXI-01 | Cervix | cervical & endocervical cancer | Female | >=65 | I/II | Unknown | Unknown | SD |
| DYNLL1 | SNV | Missense_Mutation | c.70T>C | p.Cys24Arg | p.C24R | P63167 | protein_coding | deleterious(0.05) | benign(0.03) | TCGA-A5-A0VP-01 | Endometrium | uterine corpus endometrioid carcinoma | Female | >=65 | I/II | Unknown | Unknown | SD | |
| DYNLL1 | SNV | Missense_Mutation | novel | c.263C>A | p.Ser88Tyr | p.S88Y | P63167 | protein_coding | deleterious(0) | probably_damaging(0.968) | TCGA-FI-A2D5-01 | Endometrium | uterine corpus endometrioid carcinoma | Female | <65 | III/IV | Chemotherapy | carboplatinum | PD |
| DYNLL1 | deletion | Frame_Shift_Del | novel | c.220delA | p.Ile74SerfsTer36 | p.I74Sfs*36 | P63167 | protein_coding | TCGA-44-7672-01 | Lung | lung adenocarcinoma | Female | <65 | I/II | Unknown | Unknown | SD | ||
| DYNLL1 | deletion | Frame_Shift_Del | novel | c.222_225delCTAC | p.Tyr75SerfsTer34 | p.Y75Sfs*34 | P63167 | protein_coding | TCGA-44-7672-01 | Lung | lung adenocarcinoma | Female | <65 | I/II | Unknown | Unknown | SD | ||
| DYNLL1 | insertion | Frame_Shift_Ins | novel | c.176_177insT | p.Arg60GlufsTer5 | p.R60Efs*5 | P63167 | protein_coding | TCGA-85-8070-01 | Lung | lung squamous cell carcinoma | Male | >=65 | I/II | Unknown | Unknown | SD | ||
| DYNLL1 | SNV | Missense_Mutation | rs748141393 | c.100N>G | p.Ile34Val | p.I34V | P63167 | protein_coding | tolerated(0.57) | benign(0.007) | TCGA-CN-6988-01 | Oral cavity | head & neck squamous cell carcinoma | Male | <65 | I/II | Unknown | Unknown | SD |
| DYNLL1 | SNV | Missense_Mutation | rs796315584 | c.65N>C | p.Val22Ala | p.V22A | P63167 | protein_coding | deleterious(0.05) | benign(0.13) | TCGA-VQ-A91D-01 | Stomach | stomach adenocarcinoma | Male | >=65 | III/IV | Chemotherapy | fluorouracil | PD |
| DYNLL1 | SNV | Missense_Mutation | novel | c.175N>T | p.Gly59Trp | p.G59W | P63167 | protein_coding | deleterious(0.01) | probably_damaging(0.998) | TCGA-E8-A2EA-01 | Thyroid | thyroid carcinoma | Female | <65 | I/II | Unknown | Unknown | SD |
| Page: 1 2 |
Top |
Related drugs of malignant transformation related genes |
| Identification of chemicals and drugs interact with genes involved in malignant transfromation |
| (DGIdb 4.0) |
| Entrez ID | Symbol | Category | Interaction Types | Drug Claim Name | Drug Name | PMIDs |
| Page: 1 |

Copyright 2023-Present -The University of Texas Health Science Center at Houston |