
|
|||||
|
 | |
| |
| |
| |
| |
| |
|
Gene: DYNC2H1 |
Gene summary for DYNC2H1 |
| Gene information | Species | Human | Gene symbol | DYNC2H1 | Gene ID | 79659 |
| Gene name | dynein cytoplasmic 2 heavy chain 1 | |
| Gene Alias | ATD3 | |
| Cytomap | 11q22.3 | |
| Gene Type | protein-coding | GO ID | GO:0001568 | UniProtAcc | Q8NCM8 |
Top |
Malignant transformation analysis |
| Identification of the aberrant gene expression in precancerous and cancerous lesions by comparing the gene expression of stem-like cells in diseased tissues with normal stem cells |
| Entrez ID | Symbol | Replicates | Species | Organ | Tissue | Adj P-value | Log2FC | Malignancy |
| 79659 | DYNC2H1 | HTA11_2487_2000001011 | Human | Colorectum | SER | 3.57e-02 | 1.56e-01 | -0.1808 |
| 79659 | DYNC2H1 | HTA11_1938_2000001011 | Human | Colorectum | AD | 1.44e-02 | 1.47e-01 | -0.0811 |
| 79659 | DYNC2H1 | HTA11_347_2000001011 | Human | Colorectum | AD | 3.39e-02 | 1.20e-01 | -0.1954 |
| 79659 | DYNC2H1 | CRC-3-11773 | Human | Colorectum | CRC | 3.11e-02 | 2.50e-01 | 0.2564 |
| 79659 | DYNC2H1 | LZE22D1 | Human | Esophagus | HGIN | 3.31e-07 | 5.97e-01 | 0.0595 |
| 79659 | DYNC2H1 | LZE22T | Human | Esophagus | ESCC | 1.16e-08 | 6.58e-01 | 0.068 |
| 79659 | DYNC2H1 | LZE24T | Human | Esophagus | ESCC | 5.42e-05 | 1.13e-01 | 0.0596 |
| 79659 | DYNC2H1 | LZE22D3 | Human | Esophagus | HGIN | 1.25e-03 | 1.16e+00 | 0.0653 |
| 79659 | DYNC2H1 | P2T-E | Human | Esophagus | ESCC | 6.31e-17 | 1.20e-01 | 0.1177 |
| 79659 | DYNC2H1 | P4T-E | Human | Esophagus | ESCC | 1.44e-03 | 6.41e-02 | 0.1323 |
| 79659 | DYNC2H1 | P5T-E | Human | Esophagus | ESCC | 1.19e-18 | 1.46e-01 | 0.1327 |
| 79659 | DYNC2H1 | P8T-E | Human | Esophagus | ESCC | 3.29e-17 | 4.48e-01 | 0.0889 |
| 79659 | DYNC2H1 | P10T-E | Human | Esophagus | ESCC | 5.62e-12 | 1.72e-01 | 0.116 |
| 79659 | DYNC2H1 | P11T-E | Human | Esophagus | ESCC | 1.78e-14 | 5.18e-01 | 0.1426 |
| 79659 | DYNC2H1 | P12T-E | Human | Esophagus | ESCC | 9.57e-14 | 6.43e-02 | 0.1122 |
| 79659 | DYNC2H1 | P15T-E | Human | Esophagus | ESCC | 1.30e-02 | 7.32e-02 | 0.1149 |
| 79659 | DYNC2H1 | P16T-E | Human | Esophagus | ESCC | 5.56e-14 | 2.32e-01 | 0.1153 |
| 79659 | DYNC2H1 | P20T-E | Human | Esophagus | ESCC | 6.66e-04 | 1.60e-02 | 0.1124 |
| 79659 | DYNC2H1 | P21T-E | Human | Esophagus | ESCC | 1.00e-21 | 2.14e-01 | 0.1617 |
| 79659 | DYNC2H1 | P22T-E | Human | Esophagus | ESCC | 1.77e-08 | 1.05e-02 | 0.1236 |
| Page: 1 2 3 4 5 |
| Tissue | Expression Dynamics | Abbreviation |
| Colorectum (GSE201348) |  | FAP: Familial adenomatous polyposis |
| CRC: Colorectal cancer | ||
| Colorectum (HTA11) |  | AD: Adenomas |
| SER: Sessile serrated lesions | ||
| MSI-H: Microsatellite-high colorectal cancer | ||
| MSS: Microsatellite stable colorectal cancer | ||
| Esophagus | 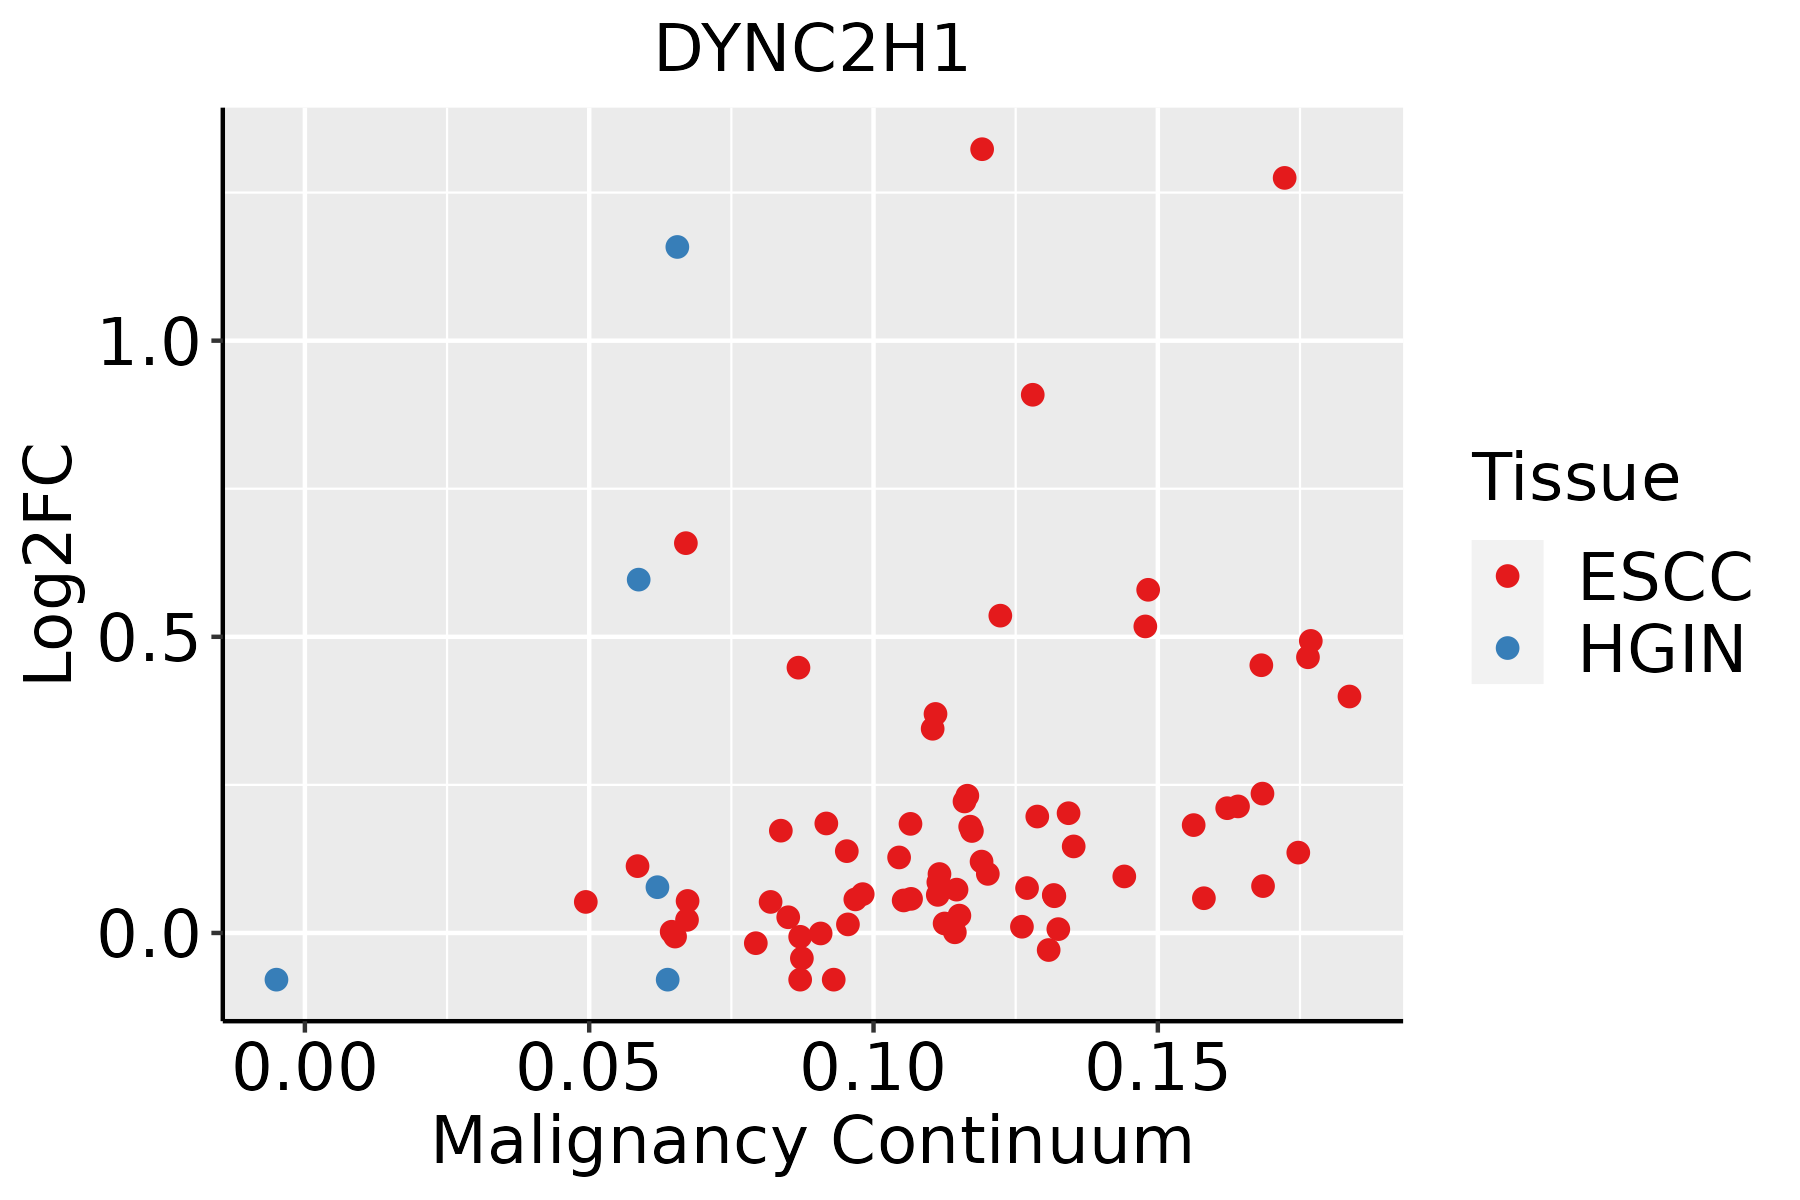 | ESCC: Esophageal squamous cell carcinoma |
| HGIN: High-grade intraepithelial neoplasias | ||
| LGIN: Low-grade intraepithelial neoplasias | ||
| Lung | 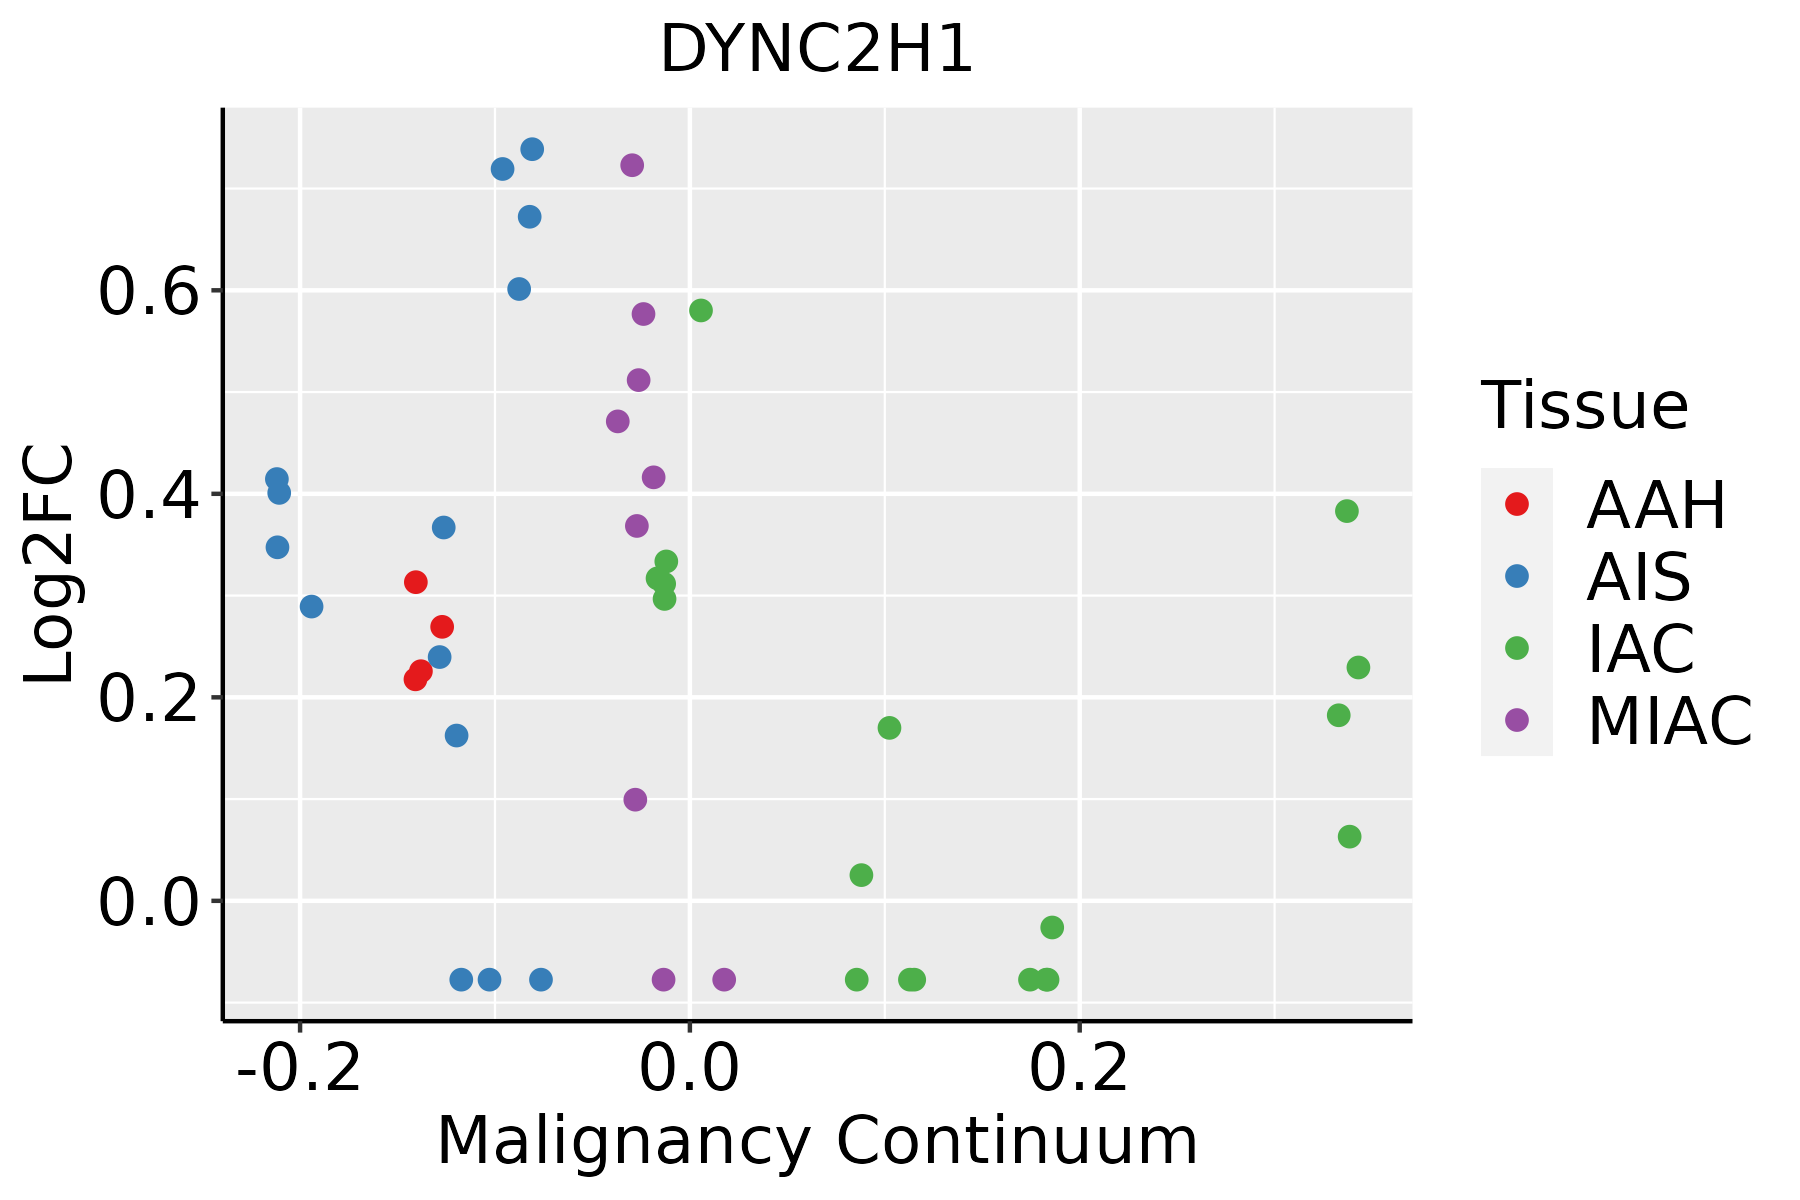 | AAH: Atypical adenomatous hyperplasia |
| AIS: Adenocarcinoma in situ | ||
| IAC: Invasive lung adenocarcinoma | ||
| MIA: Minimally invasive adenocarcinoma | ||
| Oral Cavity |  | EOLP: Erosive Oral lichen planus |
| LP: leukoplakia | ||
| NEOLP: Non-erosive oral lichen planus | ||
| OSCC: Oral squamous cell carcinoma | ||
| Prostate | 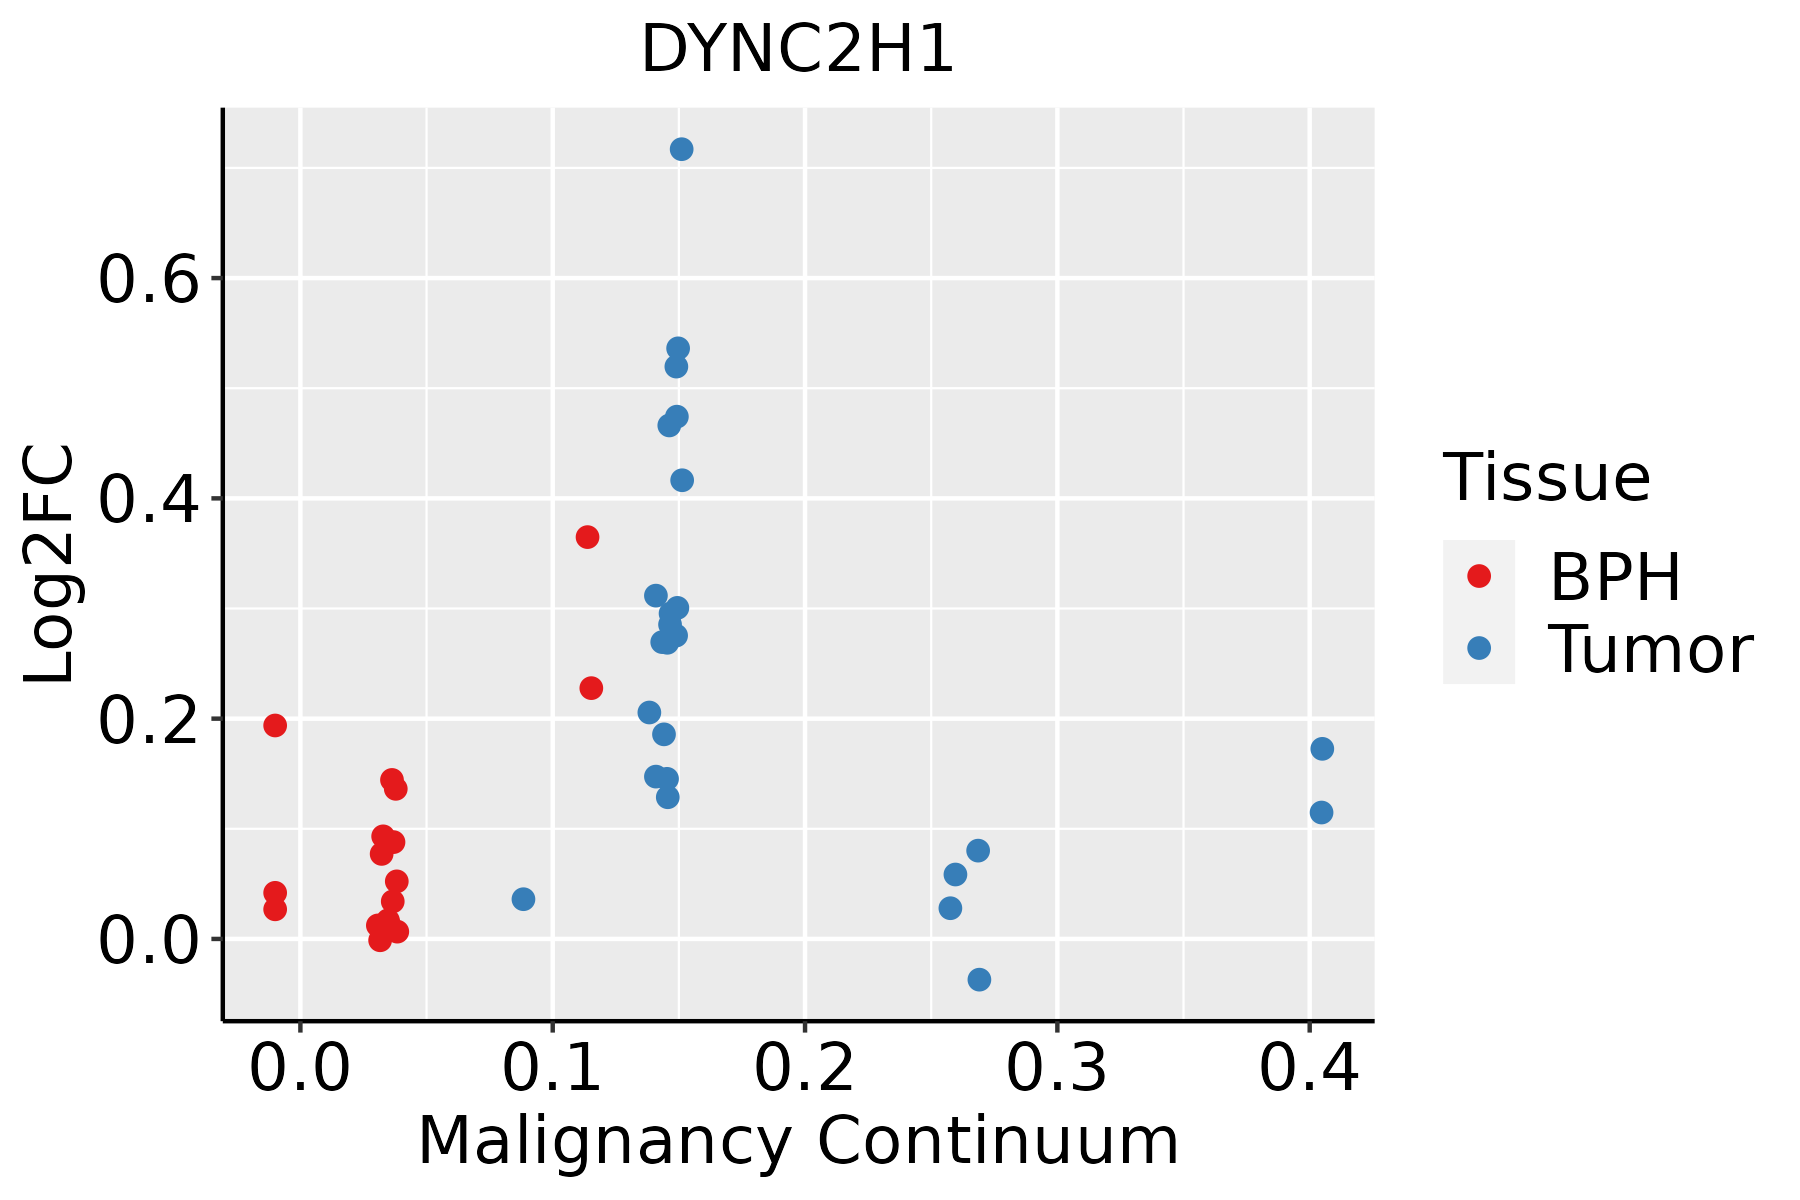 | BPH: Benign Prostatic Hyperplasia |
| Thyroid | 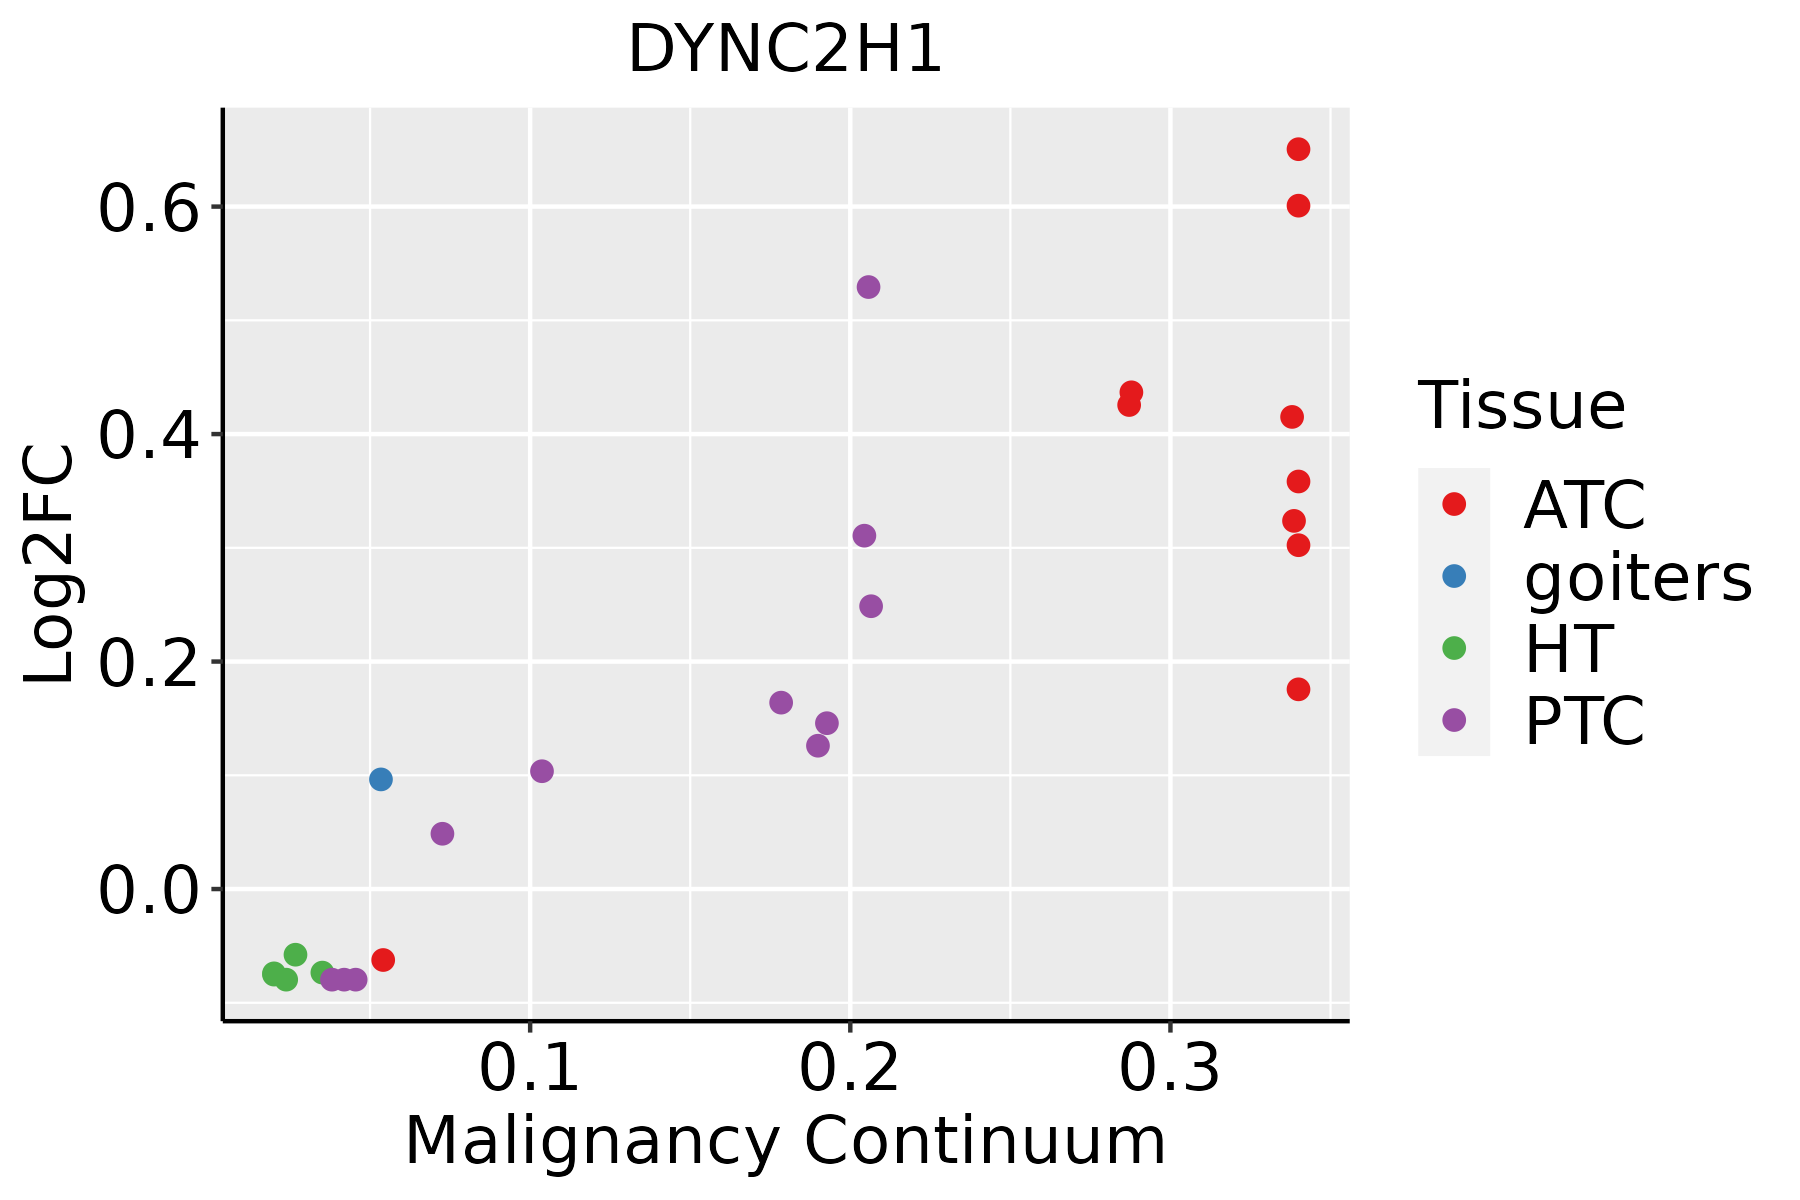 | ATC: Anaplastic thyroid cancer |
| HT: Hashimoto's thyroiditis | ||
| PTC: Papillary thyroid cancer |
| ∗log2FC in expression of this searched gene in stem-like cells from each diseased tissue sample relative to stem-like cells in normal samples in each tissue plotted against the malignancy continuum. Samples are colored based on if they are from different disease stage. |
Top |
Malignant transformation related pathway analysis |
| Find out the enriched GO biological processes and KEGG pathways involved in transition from healthy to precancer to cancer |
| Tissue | Disease Stage | Enriched GO biological Processes |
| Colorectum | AD |  |
| Colorectum | SER |  |
| Colorectum | MSS |  |
| Colorectum | MSI-H |  |
| Colorectum | FAP |  |
| ∗Top 15 enriched GO BP terms are showed in the bar plot of each disease state in each tissue. Each row represents a significant GO biological process which is colored according to the -log10(p.adjust). |
| Page: 1 2 3 4 5 6 7 8 9 |
| GO ID | Tissue | Disease Stage | Description | Gene Ratio | Bg Ratio | pvalue | p.adjust | Count |
| GO:0051604 | Colorectum | AD | protein maturation | 85/3918 | 294/18723 | 6.73e-04 | 6.91e-03 | 85 |
| GO:0030705 | Colorectum | AD | cytoskeleton-dependent intracellular transport | 60/3918 | 195/18723 | 7.56e-04 | 7.59e-03 | 60 |
| GO:0048736 | Colorectum | AD | appendage development | 51/3918 | 172/18723 | 4.20e-03 | 2.89e-02 | 51 |
| GO:0060173 | Colorectum | AD | limb development | 51/3918 | 172/18723 | 4.20e-03 | 2.89e-02 | 51 |
| GO:0016485 | Colorectum | AD | protein processing | 63/3918 | 225/18723 | 6.77e-03 | 4.19e-02 | 63 |
| GO:00516041 | Colorectum | SER | protein maturation | 73/2897 | 294/18723 | 1.82e-05 | 5.38e-04 | 73 |
| GO:00164851 | Colorectum | SER | protein processing | 55/2897 | 225/18723 | 2.84e-04 | 4.67e-03 | 55 |
| GO:00487361 | Colorectum | SER | appendage development | 42/2897 | 172/18723 | 1.43e-03 | 1.55e-02 | 42 |
| GO:00601731 | Colorectum | SER | limb development | 42/2897 | 172/18723 | 1.43e-03 | 1.55e-02 | 42 |
| GO:00307051 | Colorectum | SER | cytoskeleton-dependent intracellular transport | 44/2897 | 195/18723 | 5.53e-03 | 4.09e-02 | 44 |
| GO:0035107 | Colorectum | SER | appendage morphogenesis | 33/2897 | 138/18723 | 6.10e-03 | 4.42e-02 | 33 |
| GO:0035108 | Colorectum | SER | limb morphogenesis | 33/2897 | 138/18723 | 6.10e-03 | 4.42e-02 | 33 |
| GO:00307054 | Colorectum | CRC | cytoskeleton-dependent intracellular transport | 45/2078 | 195/18723 | 1.29e-06 | 7.21e-05 | 45 |
| GO:00351072 | Colorectum | CRC | appendage morphogenesis | 32/2078 | 138/18723 | 3.77e-05 | 9.26e-04 | 32 |
| GO:00351082 | Colorectum | CRC | limb morphogenesis | 32/2078 | 138/18723 | 3.77e-05 | 9.26e-04 | 32 |
| GO:00016552 | Colorectum | CRC | urogenital system development | 62/2078 | 338/18723 | 4.67e-05 | 1.10e-03 | 62 |
| GO:00720011 | Colorectum | CRC | renal system development | 56/2078 | 302/18723 | 7.85e-05 | 1.63e-03 | 56 |
| GO:00018221 | Colorectum | CRC | kidney development | 54/2078 | 293/18723 | 1.23e-04 | 2.40e-03 | 54 |
| GO:00309001 | Colorectum | CRC | forebrain development | 66/2078 | 379/18723 | 1.36e-04 | 2.57e-03 | 66 |
| GO:00487364 | Colorectum | CRC | appendage development | 34/2078 | 172/18723 | 5.80e-04 | 7.89e-03 | 34 |
| Page: 1 2 3 4 5 6 7 |
| Pathway ID | Tissue | Disease Stage | Description | Gene Ratio | Bg Ratio | pvalue | p.adjust | qvalue | Count |
| hsa05132 | Colorectum | AD | Salmonella infection | 102/2092 | 249/8465 | 7.65e-09 | 1.28e-07 | 8.17e-08 | 102 |
| hsa04962 | Colorectum | AD | Vasopressin-regulated water reabsorption | 19/2092 | 44/8465 | 5.48e-03 | 2.48e-02 | 1.58e-02 | 19 |
| hsa051321 | Colorectum | AD | Salmonella infection | 102/2092 | 249/8465 | 7.65e-09 | 1.28e-07 | 8.17e-08 | 102 |
| hsa049621 | Colorectum | AD | Vasopressin-regulated water reabsorption | 19/2092 | 44/8465 | 5.48e-03 | 2.48e-02 | 1.58e-02 | 19 |
| hsa051322 | Colorectum | SER | Salmonella infection | 77/1580 | 249/8465 | 1.56e-06 | 2.35e-05 | 1.71e-05 | 77 |
| hsa051323 | Colorectum | SER | Salmonella infection | 77/1580 | 249/8465 | 1.56e-06 | 2.35e-05 | 1.71e-05 | 77 |
| hsa0513210 | Colorectum | CRC | Salmonella infection | 48/1091 | 249/8465 | 2.43e-03 | 1.69e-02 | 1.15e-02 | 48 |
| hsa0513211 | Colorectum | CRC | Salmonella infection | 48/1091 | 249/8465 | 2.43e-03 | 1.69e-02 | 1.15e-02 | 48 |
| hsa0513239 | Esophagus | HGIN | Salmonella infection | 69/1383 | 249/8465 | 3.02e-06 | 4.47e-05 | 3.55e-05 | 69 |
| hsa049627 | Esophagus | HGIN | Vasopressin-regulated water reabsorption | 14/1383 | 44/8465 | 8.21e-03 | 4.71e-02 | 3.74e-02 | 14 |
| hsa05132115 | Esophagus | HGIN | Salmonella infection | 69/1383 | 249/8465 | 3.02e-06 | 4.47e-05 | 3.55e-05 | 69 |
| hsa0496214 | Esophagus | HGIN | Vasopressin-regulated water reabsorption | 14/1383 | 44/8465 | 8.21e-03 | 4.71e-02 | 3.74e-02 | 14 |
| hsa05132211 | Esophagus | ESCC | Salmonella infection | 191/4205 | 249/8465 | 6.51e-19 | 5.45e-17 | 2.79e-17 | 191 |
| hsa0414530 | Esophagus | ESCC | Phagosome | 100/4205 | 152/8465 | 3.81e-05 | 1.72e-04 | 8.82e-05 | 100 |
| hsa0496223 | Esophagus | ESCC | Vasopressin-regulated water reabsorption | 33/4205 | 44/8465 | 5.27e-04 | 1.78e-03 | 9.13e-04 | 33 |
| hsa05132310 | Esophagus | ESCC | Salmonella infection | 191/4205 | 249/8465 | 6.51e-19 | 5.45e-17 | 2.79e-17 | 191 |
| hsa04145114 | Esophagus | ESCC | Phagosome | 100/4205 | 152/8465 | 3.81e-05 | 1.72e-04 | 8.82e-05 | 100 |
| hsa0496233 | Esophagus | ESCC | Vasopressin-regulated water reabsorption | 33/4205 | 44/8465 | 5.27e-04 | 1.78e-03 | 9.13e-04 | 33 |
| hsa0513216 | Lung | IAC | Salmonella infection | 52/1053 | 249/8465 | 9.46e-05 | 1.28e-03 | 8.50e-04 | 52 |
| hsa0513217 | Lung | IAC | Salmonella infection | 52/1053 | 249/8465 | 9.46e-05 | 1.28e-03 | 8.50e-04 | 52 |
| Page: 1 2 3 |
Top |
Cell-cell communication analysis |
| Identification of potential cell-cell interactions between two cell types and their ligand-receptor pairs for different disease states |
| Ligand | Receptor | LRpair | Pathway | Tissue | Disease Stage |
| Page: 1 |
Top |
Single-cell gene regulatory network inference analysis |
| Find out the significant the regulons (TFs) and the target genes of each regulon across cell types for different disease states |
| TF | Cell Type | Tissue | Disease Stage | Target Gene | RSS | Regulon Activity |
| ∗The dot plots of a searched regulon are shown for all cell subpopulations in each disease state of each tissue based on the regulon specific score inferred using pySCENIC and by calculating the average expression. |
| Page: 1 |
Top |
Somatic mutation of malignant transformation related genes |
| Annotation of somatic variants for genes involved in malignant transformation |
| Hugo Symbol | Variant Class | Variant Classification | dbSNP RS | HGVSc | HGVSp | HGVSp Short | SWISSPROT | BIOTYPE | SIFT | PolyPhen | Tumor Sample Barcode | Tissue | Histology | Sex | Age | Stage | Therapy Types | Drugs | Outcome |
| DYNC2H1 | SNV | Missense_Mutation | novel | c.12526N>C | p.Asp4176His | p.D4176H | Q8NCM8 | protein_coding | deleterious(0.01) | probably_damaging(0.981) | TCGA-5L-AAT1-01 | Breast | breast invasive carcinoma | Female | <65 | III/IV | Hormone Therapy | letrozol | SD |
| DYNC2H1 | SNV | Missense_Mutation | novel | c.3252N>T | p.Lys1084Asn | p.K1084N | Q8NCM8 | protein_coding | deleterious(0.01) | probably_damaging(0.94) | TCGA-A1-A0SK-01 | Breast | breast invasive carcinoma | Female | <65 | I/II | Unknown | Unknown | PD |
| DYNC2H1 | SNV | Missense_Mutation | novel | c.7225N>C | p.Gly2409Arg | p.G2409R | Q8NCM8 | protein_coding | deleterious(0) | possibly_damaging(0.81) | TCGA-A2-A04P-01 | Breast | breast invasive carcinoma | Female | <65 | III/IV | Chemotherapy | taxol | PD |
| DYNC2H1 | SNV | Missense_Mutation | novel | c.6479A>G | p.Asn2160Ser | p.N2160S | Q8NCM8 | protein_coding | tolerated(0.33) | benign(0.006) | TCGA-A2-A0SV-01 | Breast | breast invasive carcinoma | Female | <65 | III/IV | Other, specify in notesBisphosphonate therapy | zometa | PD |
| DYNC2H1 | SNV | Missense_Mutation | rs774441276 | c.7214N>T | p.Ser2405Phe | p.S2405F | Q8NCM8 | protein_coding | deleterious(0) | probably_damaging(0.998) | TCGA-A2-A1G0-01 | Breast | breast invasive carcinoma | Female | <65 | I/II | Chemotherapy | taxotere | SD |
| DYNC2H1 | SNV | Missense_Mutation | rs779949950 | c.3634N>T | p.Asp1212Tyr | p.D1212Y | Q8NCM8 | protein_coding | deleterious(0) | possibly_damaging(0.891) | TCGA-A8-A06R-01 | Breast | breast invasive carcinoma | Female | >=65 | I/II | Chemotherapy | 5-fluorouracil | CR |
| DYNC2H1 | SNV | Missense_Mutation | c.1306N>C | p.Glu436Gln | p.E436Q | Q8NCM8 | protein_coding | tolerated(0.24) | benign(0.281) | TCGA-A8-A09I-01 | Breast | breast invasive carcinoma | Female | >=65 | I/II | Hormone Therapy | anastrozole | SD | |
| DYNC2H1 | SNV | Missense_Mutation | rs749815980 | c.9314N>A | p.Arg3105Gln | p.R3105Q | Q8NCM8 | protein_coding | deleterious(0.01) | benign(0.294) | TCGA-A8-A09I-01 | Breast | breast invasive carcinoma | Female | >=65 | I/II | Hormone Therapy | anastrozole | SD |
| DYNC2H1 | SNV | Missense_Mutation | rs745867734 | c.3958N>A | p.Gly1320Arg | p.G1320R | Q8NCM8 | protein_coding | deleterious(0.02) | benign(0.037) | TCGA-A8-A09M-01 | Breast | breast invasive carcinoma | Female | >=65 | III/IV | Chemotherapy | paclitaxel | CR |
| DYNC2H1 | SNV | Missense_Mutation | novel | c.4714G>C | p.Glu1572Gln | p.E1572Q | Q8NCM8 | protein_coding | tolerated(0.17) | benign(0.097) | TCGA-AC-A23H-01 | Breast | breast invasive carcinoma | Female | >=65 | I/II | Unknown | Unknown | PD |
| Page: 1 2 3 4 5 6 7 8 9 10 11 12 13 14 15 16 17 18 19 20 21 22 23 24 25 26 27 28 29 30 31 32 33 34 35 36 37 38 39 40 41 42 43 44 45 46 |
Top |
Related drugs of malignant transformation related genes |
| Identification of chemicals and drugs interact with genes involved in malignant transfromation |
| (DGIdb 4.0) |
| Entrez ID | Symbol | Category | Interaction Types | Drug Claim Name | Drug Name | PMIDs |
| 79659 | DYNC2H1 | CLINICALLY ACTIONABLE | Platinum compounds | 21118971 | ||
| 79659 | DYNC2H1 | CLINICALLY ACTIONABLE | etoposide | ETOPOSIDE | 21118971 |
| Page: 1 |

Copyright 2023-Present -The University of Texas Health Science Center at Houston |