
|
|||||
|
 | |
| |
| |
| |
| |
| |
|
Gene: DYNC1LI2 |
Gene summary for DYNC1LI2 |
| Gene information | Species | Human | Gene symbol | DYNC1LI2 | Gene ID | 1783 |
| Gene name | dynein cytoplasmic 1 light intermediate chain 2 | |
| Gene Alias | DNCLI2 | |
| Cytomap | 16q22.1 | |
| Gene Type | protein-coding | GO ID | GO:0000226 | UniProtAcc | O43237 |
Top |
Malignant transformation analysis |
| Identification of the aberrant gene expression in precancerous and cancerous lesions by comparing the gene expression of stem-like cells in diseased tissues with normal stem cells |
| Entrez ID | Symbol | Replicates | Species | Organ | Tissue | Adj P-value | Log2FC | Malignancy |
| 1783 | DYNC1LI2 | LZE2T | Human | Esophagus | ESCC | 1.98e-09 | 6.34e-01 | 0.082 |
| 1783 | DYNC1LI2 | LZE3D | Human | Esophagus | HGIN | 4.07e-04 | 5.06e-01 | 0.0668 |
| 1783 | DYNC1LI2 | LZE4T | Human | Esophagus | ESCC | 1.97e-19 | 8.24e-01 | 0.0811 |
| 1783 | DYNC1LI2 | LZE5T | Human | Esophagus | ESCC | 3.86e-03 | 6.71e-01 | 0.0514 |
| 1783 | DYNC1LI2 | LZE7T | Human | Esophagus | ESCC | 6.58e-07 | 6.98e-01 | 0.0667 |
| 1783 | DYNC1LI2 | LZE8T | Human | Esophagus | ESCC | 3.20e-09 | 3.92e-01 | 0.067 |
| 1783 | DYNC1LI2 | LZE20T | Human | Esophagus | ESCC | 3.30e-07 | 3.34e-01 | 0.0662 |
| 1783 | DYNC1LI2 | LZE22T | Human | Esophagus | ESCC | 7.31e-05 | 3.26e-01 | 0.068 |
| 1783 | DYNC1LI2 | LZE24T | Human | Esophagus | ESCC | 1.32e-17 | 4.83e-01 | 0.0596 |
| 1783 | DYNC1LI2 | LZE21T | Human | Esophagus | ESCC | 1.70e-09 | 3.80e-01 | 0.0655 |
| 1783 | DYNC1LI2 | P1T-E | Human | Esophagus | ESCC | 4.96e-16 | 1.03e+00 | 0.0875 |
| 1783 | DYNC1LI2 | P2T-E | Human | Esophagus | ESCC | 2.39e-49 | 8.78e-01 | 0.1177 |
| 1783 | DYNC1LI2 | P4T-E | Human | Esophagus | ESCC | 9.97e-37 | 1.00e+00 | 0.1323 |
| 1783 | DYNC1LI2 | P5T-E | Human | Esophagus | ESCC | 1.88e-19 | 4.10e-01 | 0.1327 |
| 1783 | DYNC1LI2 | P8T-E | Human | Esophagus | ESCC | 2.00e-41 | 8.66e-01 | 0.0889 |
| 1783 | DYNC1LI2 | P9T-E | Human | Esophagus | ESCC | 1.58e-12 | 3.08e-01 | 0.1131 |
| 1783 | DYNC1LI2 | P10T-E | Human | Esophagus | ESCC | 1.46e-41 | 8.06e-01 | 0.116 |
| 1783 | DYNC1LI2 | P11T-E | Human | Esophagus | ESCC | 1.92e-24 | 1.22e+00 | 0.1426 |
| 1783 | DYNC1LI2 | P12T-E | Human | Esophagus | ESCC | 1.79e-26 | 6.57e-01 | 0.1122 |
| 1783 | DYNC1LI2 | P15T-E | Human | Esophagus | ESCC | 3.34e-29 | 8.01e-01 | 0.1149 |
| Page: 1 2 3 4 5 6 7 8 |
| Tissue | Expression Dynamics | Abbreviation |
| Esophagus | 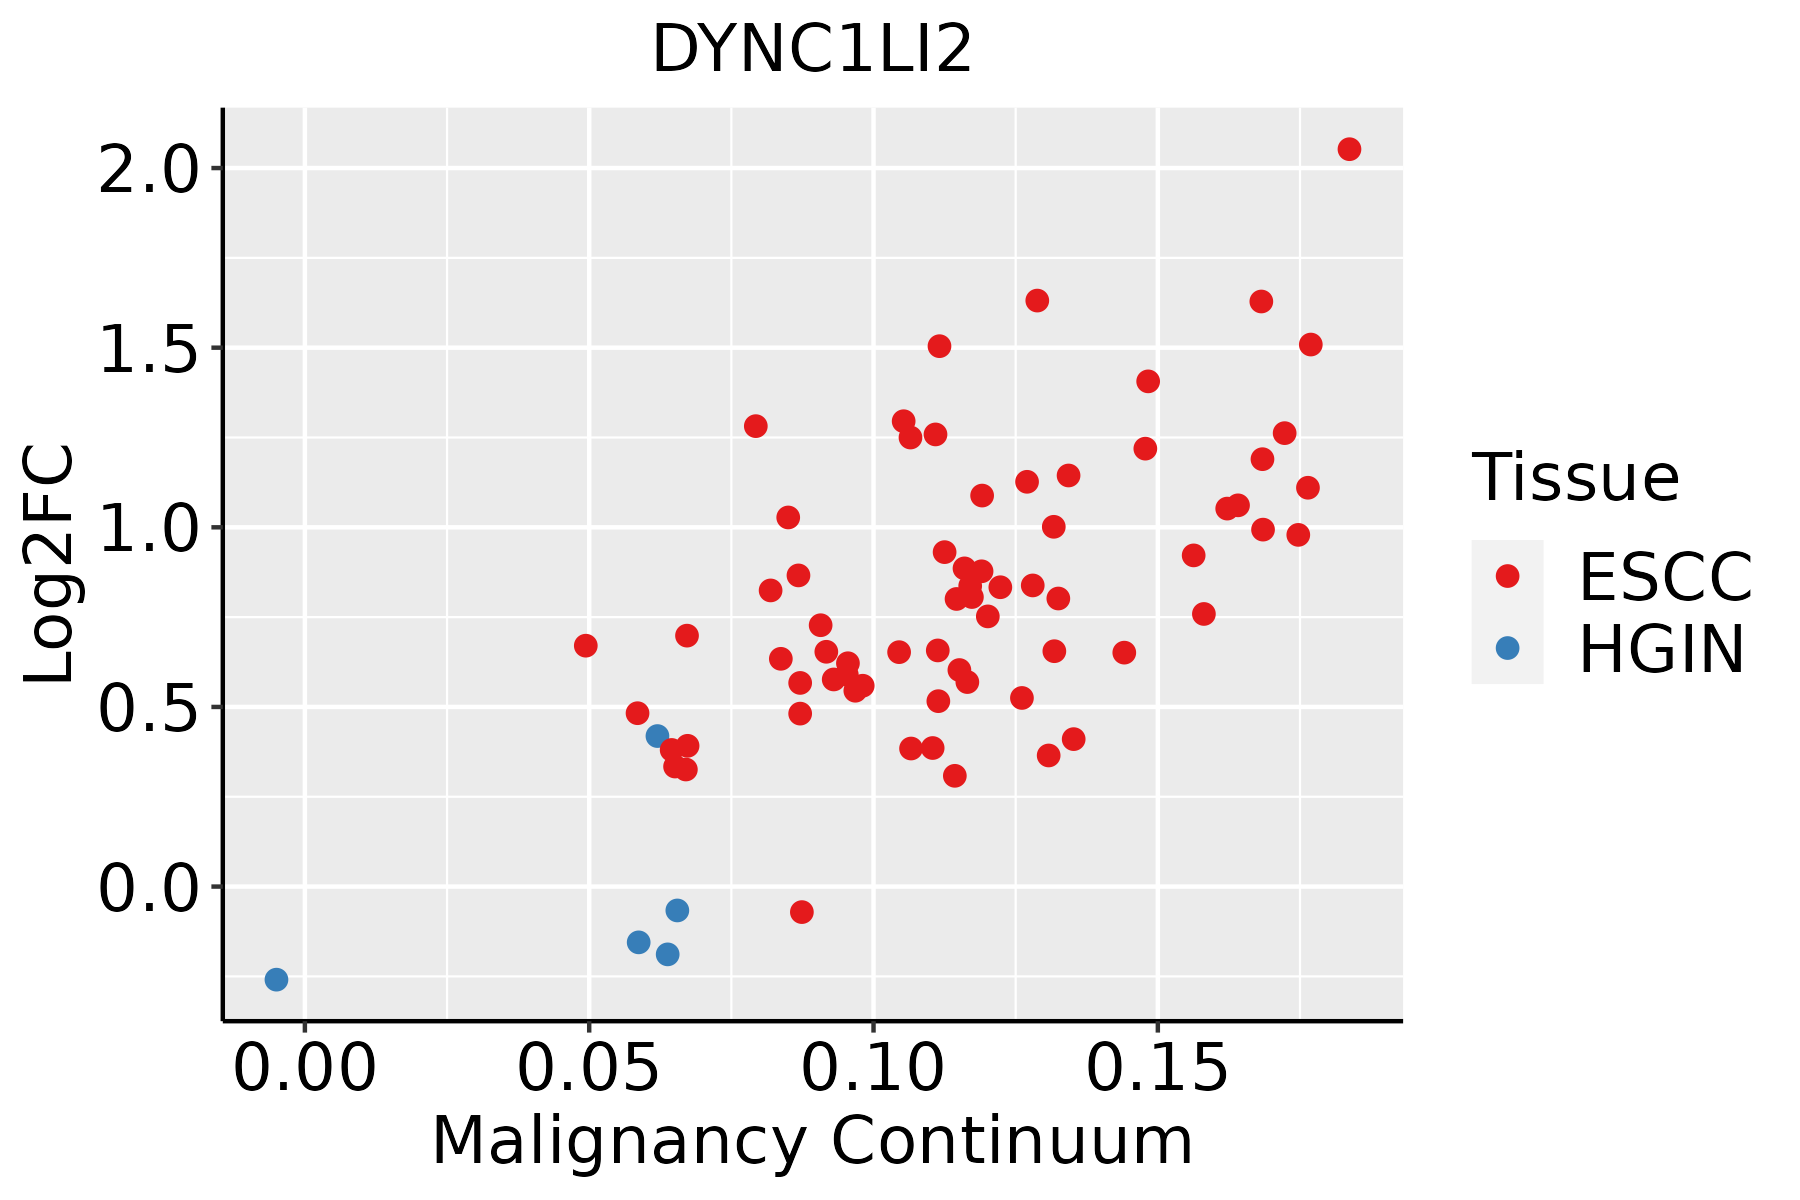 | ESCC: Esophageal squamous cell carcinoma |
| HGIN: High-grade intraepithelial neoplasias | ||
| LGIN: Low-grade intraepithelial neoplasias | ||
| Liver | 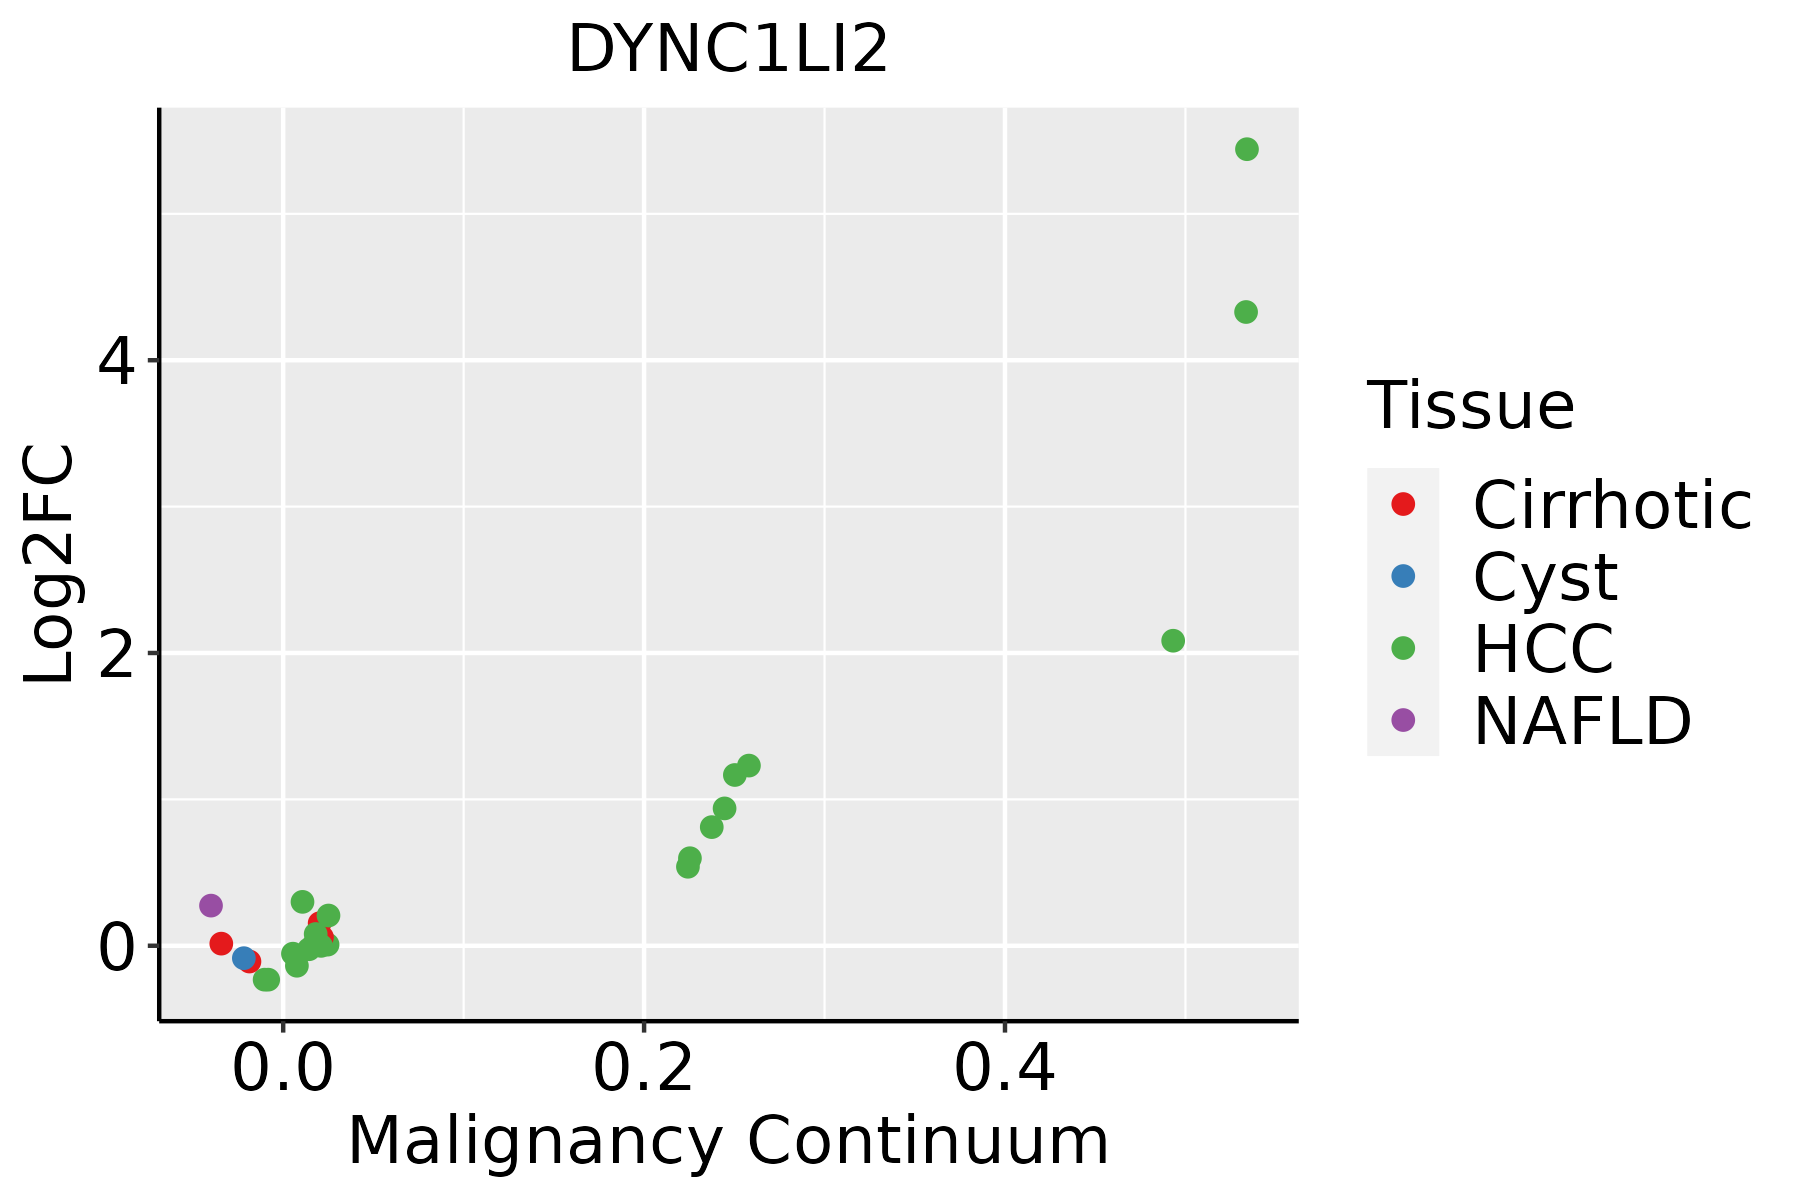 | HCC: Hepatocellular carcinoma |
| NAFLD: Non-alcoholic fatty liver disease | ||
| Oral Cavity |  | EOLP: Erosive Oral lichen planus |
| LP: leukoplakia | ||
| NEOLP: Non-erosive oral lichen planus | ||
| OSCC: Oral squamous cell carcinoma | ||
| Prostate |  | BPH: Benign Prostatic Hyperplasia |
| Skin |  | AK: Actinic keratosis |
| cSCC: Cutaneous squamous cell carcinoma | ||
| SCCIS:squamous cell carcinoma in situ | ||
| Thyroid | 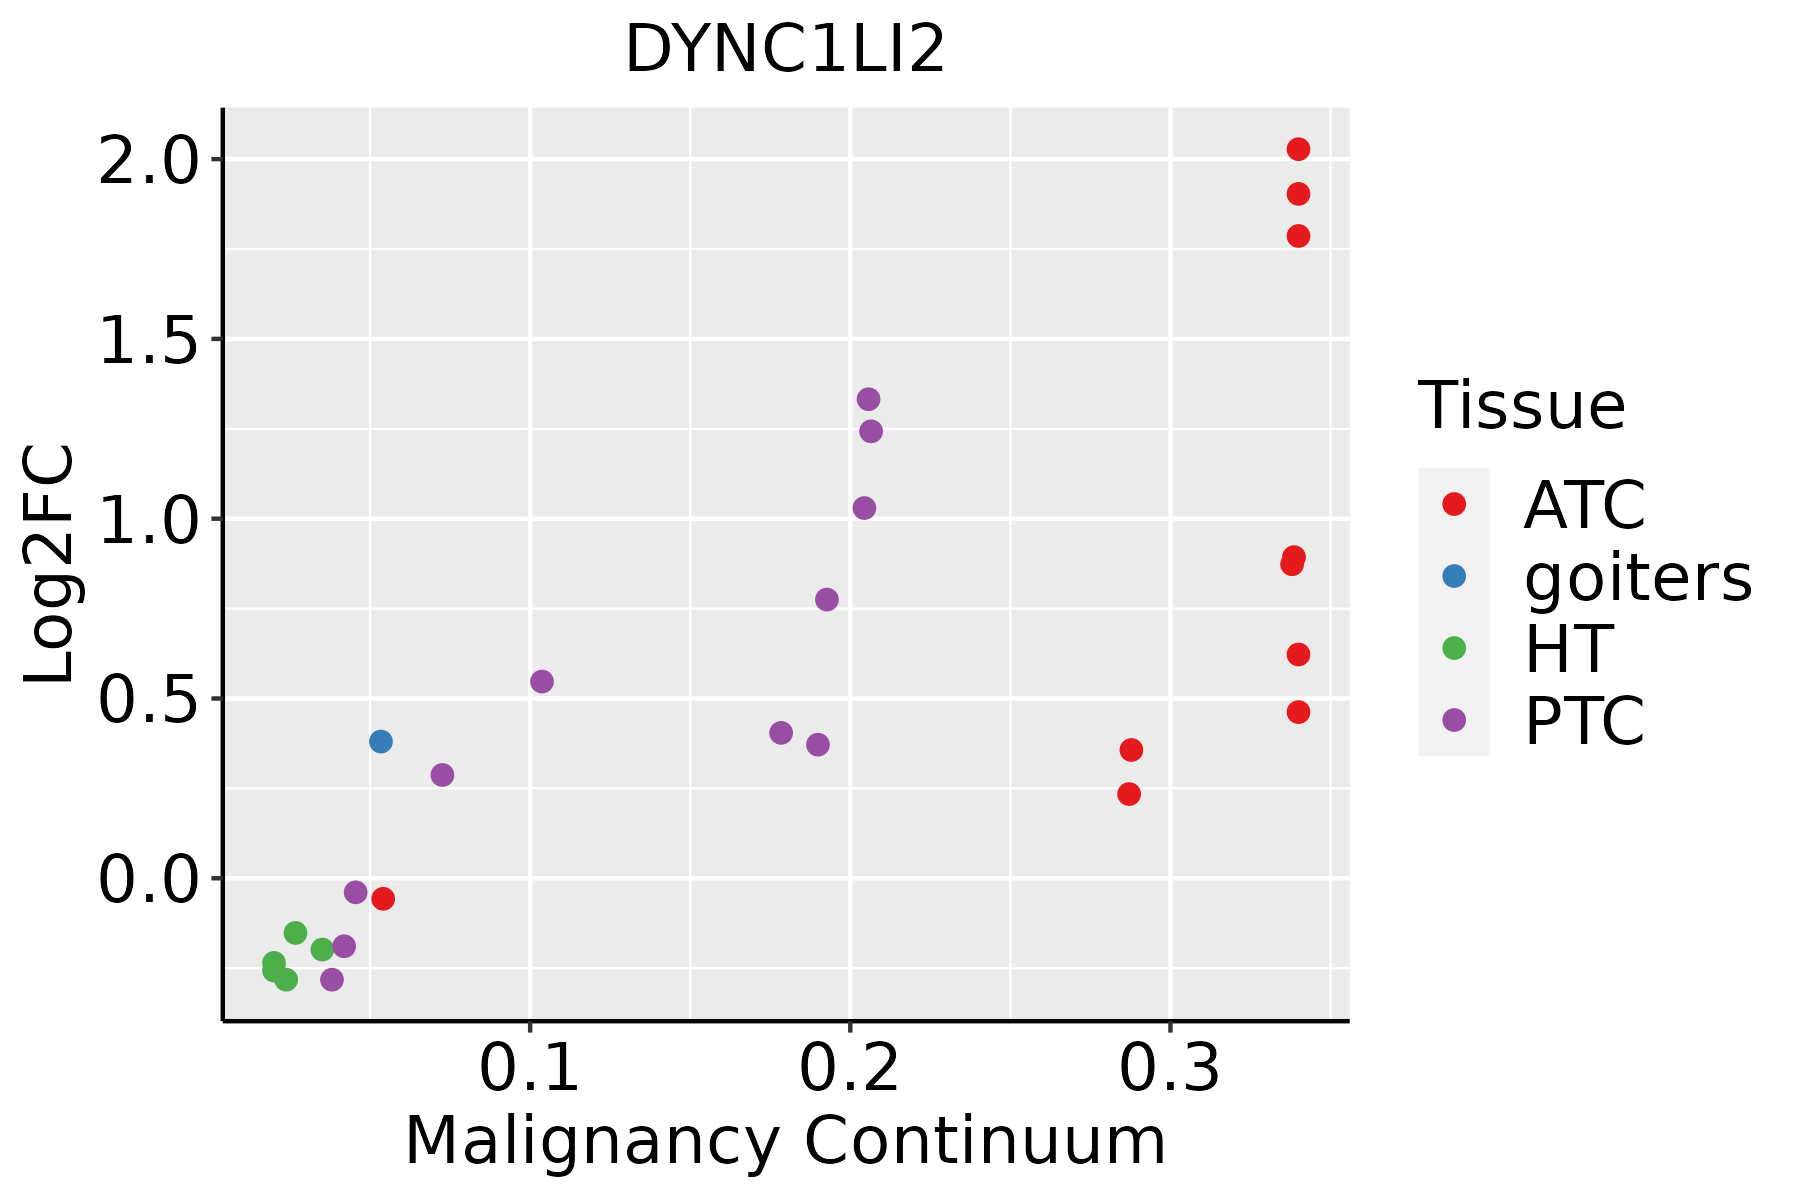 | ATC: Anaplastic thyroid cancer |
| HT: Hashimoto's thyroiditis | ||
| PTC: Papillary thyroid cancer |
| ∗log2FC in expression of this searched gene in stem-like cells from each diseased tissue sample relative to stem-like cells in normal samples in each tissue plotted against the malignancy continuum. Samples are colored based on if they are from different disease stage. |
Top |
Malignant transformation related pathway analysis |
| Find out the enriched GO biological processes and KEGG pathways involved in transition from healthy to precancer to cancer |
| Tissue | Disease Stage | Enriched GO biological Processes |
| Colorectum | AD |  |
| Colorectum | SER |  |
| Colorectum | MSS |  |
| Colorectum | MSI-H |  |
| Colorectum | FAP |  |
| ∗Top 15 enriched GO BP terms are showed in the bar plot of each disease state in each tissue. Each row represents a significant GO biological process which is colored according to the -log10(p.adjust). |
| Page: 1 2 3 4 5 6 7 8 9 |
| GO ID | Tissue | Disease Stage | Description | Gene Ratio | Bg Ratio | pvalue | p.adjust | Count |
| GO:00618428 | Esophagus | ESCC | microtubule organizing center localization | 28/8552 | 33/18723 | 3.80e-06 | 4.12e-05 | 28 |
| GO:00516428 | Esophagus | ESCC | centrosome localization | 27/8552 | 32/18723 | 7.10e-06 | 7.12e-05 | 27 |
| GO:199009017 | Esophagus | ESCC | cellular response to nerve growth factor stimulus | 38/8552 | 53/18723 | 1.10e-04 | 7.69e-04 | 38 |
| GO:199008916 | Esophagus | ESCC | response to nerve growth factor | 39/8552 | 56/18723 | 2.44e-04 | 1.51e-03 | 39 |
| GO:199009011 | Liver | Cirrhotic | cellular response to nerve growth factor stimulus | 24/4634 | 53/18723 | 8.86e-04 | 6.37e-03 | 24 |
| GO:199008911 | Liver | Cirrhotic | response to nerve growth factor | 25/4634 | 56/18723 | 9.03e-04 | 6.46e-03 | 25 |
| GO:199009021 | Liver | HCC | cellular response to nerve growth factor stimulus | 36/7958 | 53/18723 | 1.62e-04 | 1.29e-03 | 36 |
| GO:199008921 | Liver | HCC | response to nerve growth factor | 37/7958 | 56/18723 | 3.13e-04 | 2.22e-03 | 37 |
| GO:00618427 | Oral cavity | OSCC | microtubule organizing center localization | 25/7305 | 33/18723 | 1.95e-05 | 1.87e-04 | 25 |
| GO:00516427 | Oral cavity | OSCC | centrosome localization | 24/7305 | 32/18723 | 3.83e-05 | 3.37e-04 | 24 |
| GO:199009014 | Oral cavity | OSCC | cellular response to nerve growth factor stimulus | 35/7305 | 53/18723 | 6.14e-05 | 5.02e-04 | 35 |
| GO:19900899 | Oral cavity | OSCC | response to nerve growth factor | 36/7305 | 56/18723 | 1.12e-04 | 8.24e-04 | 36 |
| GO:199009022 | Oral cavity | NEOLP | cellular response to nerve growth factor stimulus | 14/2005 | 53/18723 | 1.06e-03 | 8.06e-03 | 14 |
| GO:005164213 | Oral cavity | NEOLP | centrosome localization | 10/2005 | 32/18723 | 1.36e-03 | 9.75e-03 | 10 |
| GO:006184221 | Oral cavity | NEOLP | microtubule organizing center localization | 10/2005 | 33/18723 | 1.77e-03 | 1.22e-02 | 10 |
| GO:199008923 | Oral cavity | NEOLP | response to nerve growth factor | 14/2005 | 56/18723 | 1.89e-03 | 1.28e-02 | 14 |
| GO:19900898 | Prostate | BPH | response to nerve growth factor | 22/3107 | 56/18723 | 4.21e-05 | 4.48e-04 | 22 |
| GO:199009010 | Prostate | BPH | cellular response to nerve growth factor stimulus | 21/3107 | 53/18723 | 5.39e-05 | 5.50e-04 | 21 |
| GO:00618426 | Prostate | BPH | microtubule organizing center localization | 14/3107 | 33/18723 | 4.08e-04 | 2.97e-03 | 14 |
| GO:00516426 | Prostate | BPH | centrosome localization | 13/3107 | 32/18723 | 1.07e-03 | 6.67e-03 | 13 |
| Page: 1 2 3 |
| Pathway ID | Tissue | Disease Stage | Description | Gene Ratio | Bg Ratio | pvalue | p.adjust | qvalue | Count |
| hsa05132211 | Esophagus | ESCC | Salmonella infection | 191/4205 | 249/8465 | 6.51e-19 | 5.45e-17 | 2.79e-17 | 191 |
| hsa0414530 | Esophagus | ESCC | Phagosome | 100/4205 | 152/8465 | 3.81e-05 | 1.72e-04 | 8.82e-05 | 100 |
| hsa0496223 | Esophagus | ESCC | Vasopressin-regulated water reabsorption | 33/4205 | 44/8465 | 5.27e-04 | 1.78e-03 | 9.13e-04 | 33 |
| hsa05132310 | Esophagus | ESCC | Salmonella infection | 191/4205 | 249/8465 | 6.51e-19 | 5.45e-17 | 2.79e-17 | 191 |
| hsa04145114 | Esophagus | ESCC | Phagosome | 100/4205 | 152/8465 | 3.81e-05 | 1.72e-04 | 8.82e-05 | 100 |
| hsa0496233 | Esophagus | ESCC | Vasopressin-regulated water reabsorption | 33/4205 | 44/8465 | 5.27e-04 | 1.78e-03 | 9.13e-04 | 33 |
| hsa0513222 | Liver | Cirrhotic | Salmonella infection | 121/2530 | 249/8465 | 2.47e-10 | 5.13e-09 | 3.16e-09 | 121 |
| hsa0414514 | Liver | Cirrhotic | Phagosome | 73/2530 | 152/8465 | 1.61e-06 | 1.78e-05 | 1.10e-05 | 73 |
| hsa0513232 | Liver | Cirrhotic | Salmonella infection | 121/2530 | 249/8465 | 2.47e-10 | 5.13e-09 | 3.16e-09 | 121 |
| hsa0414515 | Liver | Cirrhotic | Phagosome | 73/2530 | 152/8465 | 1.61e-06 | 1.78e-05 | 1.10e-05 | 73 |
| hsa0513242 | Liver | HCC | Salmonella infection | 178/4020 | 249/8465 | 5.90e-15 | 1.98e-13 | 1.10e-13 | 178 |
| hsa0414521 | Liver | HCC | Phagosome | 93/4020 | 152/8465 | 4.27e-04 | 1.88e-03 | 1.05e-03 | 93 |
| hsa049624 | Liver | HCC | Vasopressin-regulated water reabsorption | 30/4020 | 44/8465 | 4.41e-03 | 1.32e-02 | 7.34e-03 | 30 |
| hsa0513252 | Liver | HCC | Salmonella infection | 178/4020 | 249/8465 | 5.90e-15 | 1.98e-13 | 1.10e-13 | 178 |
| hsa0414531 | Liver | HCC | Phagosome | 93/4020 | 152/8465 | 4.27e-04 | 1.88e-03 | 1.05e-03 | 93 |
| hsa0496211 | Liver | HCC | Vasopressin-regulated water reabsorption | 30/4020 | 44/8465 | 4.41e-03 | 1.32e-02 | 7.34e-03 | 30 |
| hsa0513230 | Oral cavity | OSCC | Salmonella infection | 174/3704 | 249/8465 | 2.67e-17 | 1.49e-15 | 7.58e-16 | 174 |
| hsa0414528 | Oral cavity | OSCC | Phagosome | 88/3704 | 152/8465 | 2.83e-04 | 9.13e-04 | 4.65e-04 | 88 |
| hsa049626 | Oral cavity | OSCC | Vasopressin-regulated water reabsorption | 29/3704 | 44/8465 | 2.47e-03 | 6.52e-03 | 3.32e-03 | 29 |
| hsa05132114 | Oral cavity | OSCC | Salmonella infection | 174/3704 | 249/8465 | 2.67e-17 | 1.49e-15 | 7.58e-16 | 174 |
| Page: 1 2 |
Top |
Cell-cell communication analysis |
| Identification of potential cell-cell interactions between two cell types and their ligand-receptor pairs for different disease states |
| Ligand | Receptor | LRpair | Pathway | Tissue | Disease Stage |
| Page: 1 |
Top |
Single-cell gene regulatory network inference analysis |
| Find out the significant the regulons (TFs) and the target genes of each regulon across cell types for different disease states |
| TF | Cell Type | Tissue | Disease Stage | Target Gene | RSS | Regulon Activity |
| ∗The dot plots of a searched regulon are shown for all cell subpopulations in each disease state of each tissue based on the regulon specific score inferred using pySCENIC and by calculating the average expression. |
| Page: 1 |
Top |
Somatic mutation of malignant transformation related genes |
| Annotation of somatic variants for genes involved in malignant transformation |
| Hugo Symbol | Variant Class | Variant Classification | dbSNP RS | HGVSc | HGVSp | HGVSp Short | SWISSPROT | BIOTYPE | SIFT | PolyPhen | Tumor Sample Barcode | Tissue | Histology | Sex | Age | Stage | Therapy Types | Drugs | Outcome |
| DYNC1LI2 | SNV | Missense_Mutation | c.851N>G | p.Tyr284Cys | p.Y284C | O43237 | protein_coding | deleterious(0) | possibly_damaging(0.877) | TCGA-A2-A04Y-01 | Breast | breast invasive carcinoma | Female | <65 | I/II | Chemotherapy | cytoxan | SD | |
| DYNC1LI2 | SNV | Missense_Mutation | c.846G>C | p.Leu282Phe | p.L282F | O43237 | protein_coding | deleterious(0.01) | possibly_damaging(0.464) | TCGA-A8-A07R-01 | Breast | breast invasive carcinoma | Female | >=65 | III/IV | Ancillary | zoledronic | SD | |
| DYNC1LI2 | SNV | Missense_Mutation | c.187G>C | p.Asp63His | p.D63H | O43237 | protein_coding | deleterious(0.01) | probably_damaging(0.993) | TCGA-D8-A1JK-01 | Breast | breast invasive carcinoma | Female | >=65 | I/II | Unknown | Unknown | SD | |
| DYNC1LI2 | SNV | Missense_Mutation | novel | c.175G>A | p.Val59Ile | p.V59I | O43237 | protein_coding | tolerated(0.07) | benign(0.05) | TCGA-2W-A8YY-01 | Cervix | cervical & endocervical cancer | Female | <65 | I/II | Chemotherapy | cisplatin | CR |
| DYNC1LI2 | SNV | Missense_Mutation | novel | c.1051N>C | p.Asp351His | p.D351H | O43237 | protein_coding | deleterious(0) | probably_damaging(0.96) | TCGA-VS-A8EL-01 | Cervix | cervical & endocervical cancer | Female | <65 | I/II | Chemotherapy | cisplatin | CR |
| DYNC1LI2 | deletion | Frame_Shift_Del | novel | c.973delG | p.Glu325LysfsTer6 | p.E325Kfs*6 | O43237 | protein_coding | TCGA-DR-A0ZM-01 | Cervix | cervical & endocervical cancer | Female | <65 | III/IV | Unspecific | Cisplatin | SD | ||
| DYNC1LI2 | SNV | Missense_Mutation | novel | c.775N>T | p.Arg259Trp | p.R259W | O43237 | protein_coding | deleterious(0) | probably_damaging(1) | TCGA-A6-3807-01 | Colorectum | colon adenocarcinoma | Female | <65 | III/IV | Ancillary | leucovorin | SD |
| DYNC1LI2 | SNV | Missense_Mutation | rs751253445 | c.308N>A | p.Arg103His | p.R103H | O43237 | protein_coding | deleterious(0.04) | probably_damaging(0.998) | TCGA-AG-A002-01 | Colorectum | rectum adenocarcinoma | Male | <65 | I/II | Unknown | Unknown | SD |
| DYNC1LI2 | SNV | Missense_Mutation | novel | c.598N>A | p.Pro200Thr | p.P200T | O43237 | protein_coding | tolerated(0.61) | benign(0.074) | TCGA-AG-A014-01 | Colorectum | rectum adenocarcinoma | Male | >=65 | I/II | Unknown | Unknown | SD |
| DYNC1LI2 | SNV | Missense_Mutation | novel | c.1178N>T | p.Arg393Met | p.R393M | O43237 | protein_coding | deleterious(0) | probably_damaging(0.995) | TCGA-A5-A0G2-01 | Endometrium | uterine corpus endometrioid carcinoma | Female | <65 | III/IV | Unknown | Unknown | SD |
| Page: 1 2 3 4 5 |
Top |
Related drugs of malignant transformation related genes |
| Identification of chemicals and drugs interact with genes involved in malignant transfromation |
| (DGIdb 4.0) |
| Entrez ID | Symbol | Category | Interaction Types | Drug Claim Name | Drug Name | PMIDs |
| Page: 1 |

Copyright 2023-Present -The University of Texas Health Science Center at Houston |